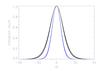
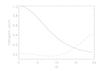
Fig. 16
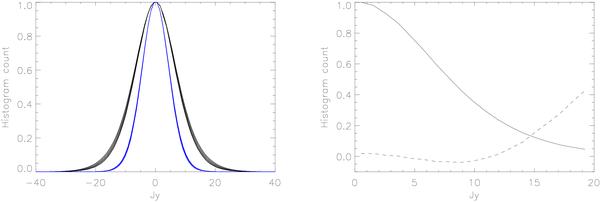
Left: the distribution of the real part of the residual visibilities after differencing two adjacent 100 kHz-wide subbands for the 3C 196 data. The eleven samples of the 139.3 MHz (black lines) and of the 154.7 MHz (blue lines) bands are plotted. Both peaks are arbitrarly normalized to one. Right: the average distribution of the residual visibilities for the 139.3 MHz band (solid line) and the fractional residual from the best-fitting Gaussian (dashed line).
Current usage metrics show cumulative count of Article Views (full-text article views including HTML views, PDF and ePub downloads, according to the available data) and Abstracts Views on Vision4Press platform.
Data correspond to usage on the plateform after 2015. The current usage metrics is available 48-96 hours after online publication and is updated daily on week days.
Initial download of the metrics may take a while.