Fig. 4
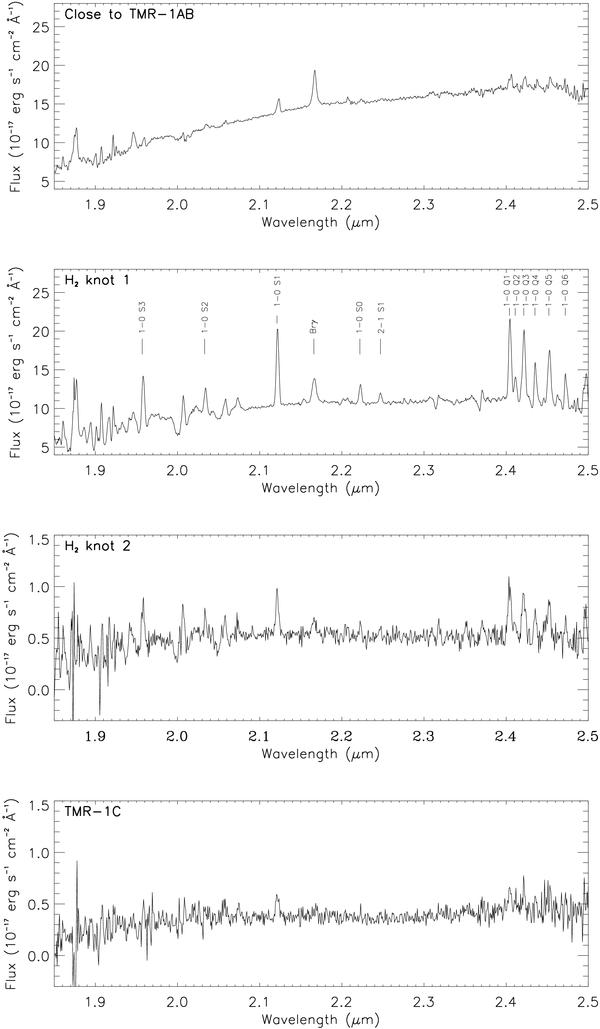
Extracted TMR-1 spectra. All spectra cover the same wavelength range from 1.85 –2.5 μm. The identification and positions of ro-vibrational H2 lines and the Brγ emission line are indicated in the spectrum of the H2 knot 1. Note that atomic hydrogen emission lines (in particular the Brγ-line) are caused or reinforced by division through the standard star, which shows hydrogen absorption (see text for further discussion).
Current usage metrics show cumulative count of Article Views (full-text article views including HTML views, PDF and ePub downloads, according to the available data) and Abstracts Views on Vision4Press platform.
Data correspond to usage on the plateform after 2015. The current usage metrics is available 48-96 hours after online publication and is updated daily on week days.
Initial download of the metrics may take a while.