Fig. 10
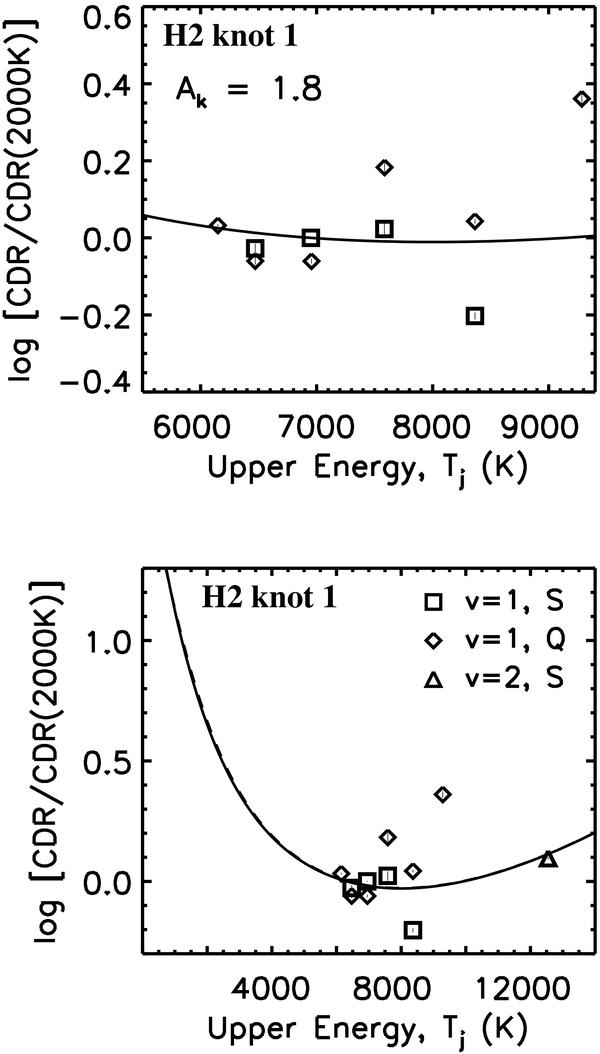
Log(CDR) diagram derived for the H2 knot 1 position. The solid line represents a C-type bow shock model. The upper panel and lower panel show the same datapoints, with the exception that the lower panel has a wider range of energies, and includes the measurement at H2 2–1 S(1).
Current usage metrics show cumulative count of Article Views (full-text article views including HTML views, PDF and ePub downloads, according to the available data) and Abstracts Views on Vision4Press platform.
Data correspond to usage on the plateform after 2015. The current usage metrics is available 48-96 hours after online publication and is updated daily on week days.
Initial download of the metrics may take a while.