Fig. 1
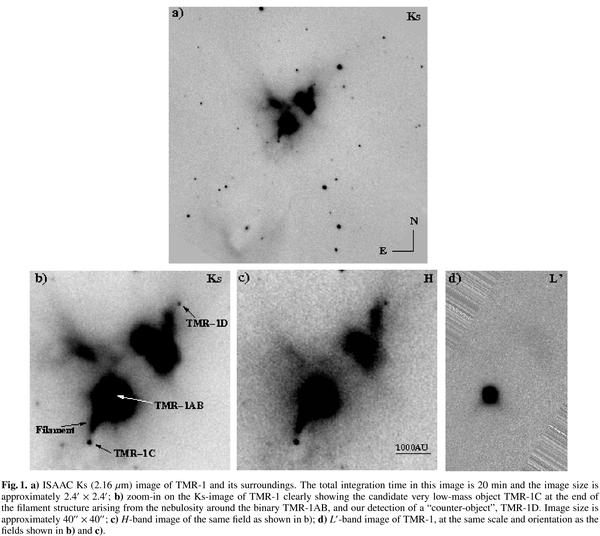
a) ISAAC Ks (2.16 μm) image of TMR-1 and its surroundings. The total integration time in this image is 20 min and the image size is approximately 2.4′ × 2.4′; b) zoom-in on the Ks-image of TMR-1 clearly showing the candidate very low-mass object TMR-1C at the end of the filament structure arising from the nebulosity around the binary TMR-1AB, and our detection of a “counter-object”, TMR-1D. Image size is approximately 40′′ × 40′′; c) H-band image of the same field as shown in b); d) L′-band image of TMR-1, at the same scale and orientation as the fields shown in b) and c).
Current usage metrics show cumulative count of Article Views (full-text article views including HTML views, PDF and ePub downloads, according to the available data) and Abstracts Views on Vision4Press platform.
Data correspond to usage on the plateform after 2015. The current usage metrics is available 48-96 hours after online publication and is updated daily on week days.
Initial download of the metrics may take a while.