Fig. 10
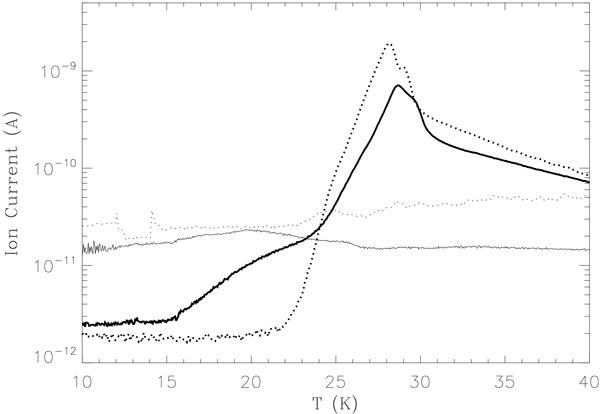
CO ice desorption during warmup for two different deposition temperatures, 7 K (thick solid trace) and 20 K (thick dotted trace). The desorption of H2 in the samples deposited at 7 K (thin solid trace) and 20 K (thin dotted trace) are also shown. The ion current (A) is plotted on a logarithmic scale, for a better appreciation of the curve profile, and roughly corresponds to partial pressure in mbar.
Current usage metrics show cumulative count of Article Views (full-text article views including HTML views, PDF and ePub downloads, according to the available data) and Abstracts Views on Vision4Press platform.
Data correspond to usage on the plateform after 2015. The current usage metrics is available 48-96 hours after online publication and is updated daily on week days.
Initial download of the metrics may take a while.