Fig. 4
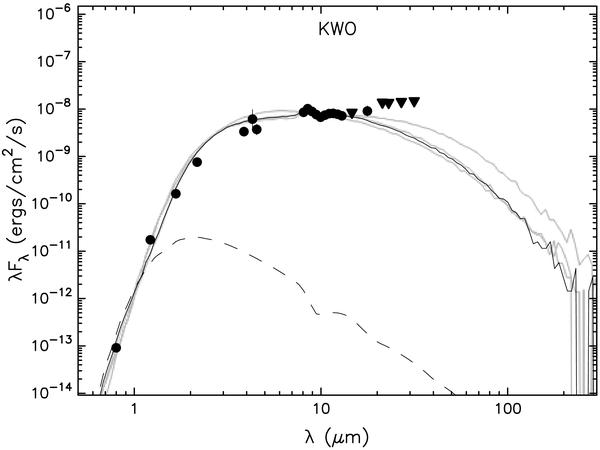
Best SED fits, obtained with the Online SED model fitter. The black solid line corresponds to the best fitting model, the gray lines to the 9 next best fits. The dashed line shows the stellar photosphere model with the best-fit interstellar extinction taken into account. The dots and triangles represent the data the fit was applied to, dots denote regular data points and triangles upper limits, respectively.
Current usage metrics show cumulative count of Article Views (full-text article views including HTML views, PDF and ePub downloads, according to the available data) and Abstracts Views on Vision4Press platform.
Data correspond to usage on the plateform after 2015. The current usage metrics is available 48-96 hours after online publication and is updated daily on week days.
Initial download of the metrics may take a while.