Fig. 1
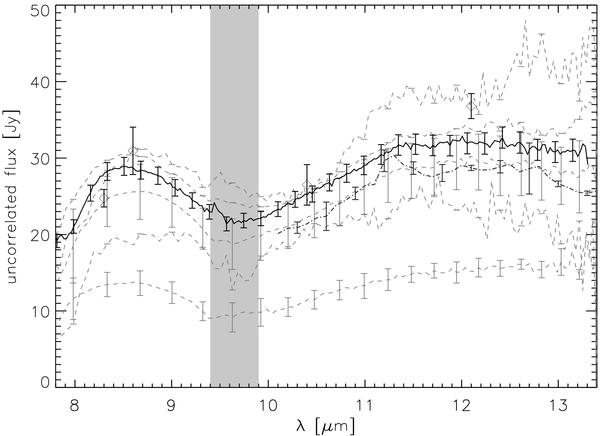
Photometry of the KWO. The dashed, gray lines depict the spectra as obtained by MIDI, the dash-dotted, dark gray line archival IRS data, the diamonds the N-band SED from Chini et al. (2004), and the bold, black line the spectrum used for further analysis. The vertical gray bar denotes the wavelength regime of the atmospheric ozone absorption feature.
Current usage metrics show cumulative count of Article Views (full-text article views including HTML views, PDF and ePub downloads, according to the available data) and Abstracts Views on Vision4Press platform.
Data correspond to usage on the plateform after 2015. The current usage metrics is available 48-96 hours after online publication and is updated daily on week days.
Initial download of the metrics may take a while.