Fig. 2
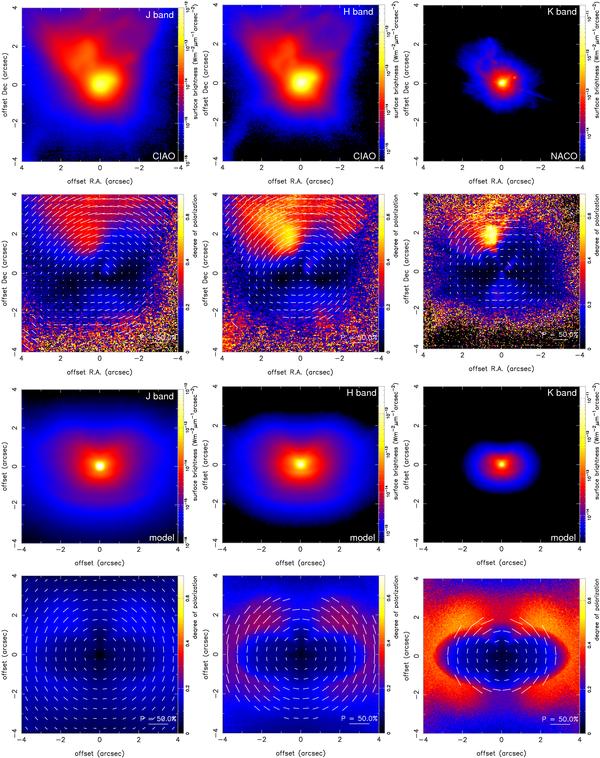
The intensity and polarization images in the J, H, and KS bands. The polarization vector lines are overlaid on the polarization images. The upper two rows show our previous observational results (Murakawa et al. 2008a). The JH-band data and the KS-band data are the results of the Subaru / CIAO and VLT / NACO observations, respectively. The bottom two rows are our selected model results. In these results, Gaussian functions that have the corresponding PSF sizes are convolved.
Current usage metrics show cumulative count of Article Views (full-text article views including HTML views, PDF and ePub downloads, according to the available data) and Abstracts Views on Vision4Press platform.
Data correspond to usage on the plateform after 2015. The current usage metrics is available 48-96 hours after online publication and is updated daily on week days.
Initial download of the metrics may take a while.