Fig. 2
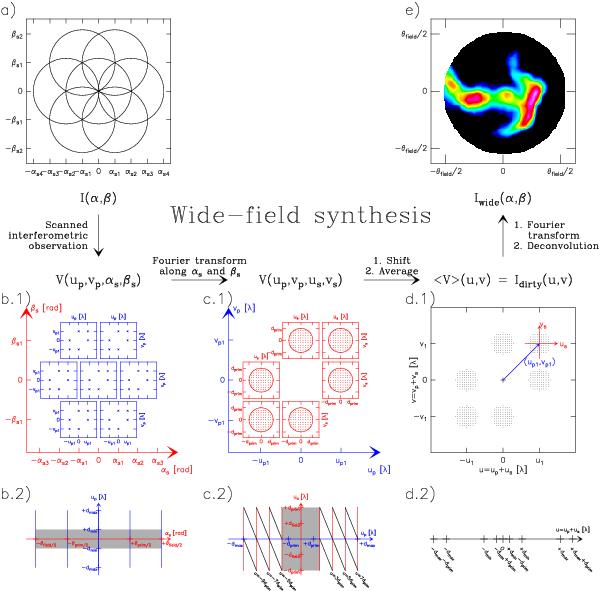
Illustration of the principles of wide-field synthesis, which enables us to image wide-field interferometric observations. The top row displays the sky plane. The middle row displays the 4-dimensional visibility space and the bottom row shows 2-dimensional cuts of this space at different stages of the processing. In panels b) to d), the scanned dimensions (αs and us) are displayed in blue while the phased spatial scale dimensions (up) are displayed in red and the spatial scale dimensions (u) of the final wide-field uv plane are displayed in black. The grey zones of panels b.2) and c.2) show the regions of the visibility space without measurements (missing short-spacings). In detail, panel a) shows a possible scanning strategy of the sky to measure the unknown brightness distribution at high angular resolution: for simplicity it is here just a 7-field mosaic. Panels b.1) and b.2) sketch the space of measured visibilities: the uv plane at each of the 7 measured sky positions is displayed as a blue square box in panel b.1) and a blue vertical line in panel b.2). For simplicity, only 6 visibilities are plotted in panel b.1). Panels c.1) and c.2) sketch the space of synthesized visibilities after Fourier transform of the measured visibilities along the scanned coordinate (αs): at each measured spatial frequency up (displayed on the blue axes) is associated one space of synthesized wide-field spatial frequencies displayed as one of the red squares in panel c.1) and the red vertical lines in panel c.2). The wide-field spatial scales are synthesized 1) on a grid whose cell size is related to the total field of view of the observation and 2) only inside circles whose radius is the primary diameter of the interferometer antennas. Panels d.1) and d.2) display the final, wide-field uv plane. This plane is built by application of the shift-and-average operator along the black lines on panel c.2), lines that display the region of constant u spatial frequency in the (up, us) space. Standard inverse Fourier transform and deconvolution methods then produce a wide-field distribution of sky brightnesses as shown in panel e).
Current usage metrics show cumulative count of Article Views (full-text article views including HTML views, PDF and ePub downloads, according to the available data) and Abstracts Views on Vision4Press platform.
Data correspond to usage on the plateform after 2015. The current usage metrics is available 48-96 hours after online publication and is updated daily on week days.
Initial download of the metrics may take a while.