


| Issue |
A&A
Volume 710, June 2026
|
|
|---|---|---|
| Article Number | L9 | |
| Number of page(s) | 7 | |
| Section | Letters to the Editor | |
| DOI | https://doi.org/10.1051/0004-6361/202659205 | |
| Published online | 29 May 2026 | |
Letter to the Editor
EWOCS-V: Is Wd1-72 a recent post-interaction WR+O binary?
1
Max-Planck-Institut für Kernphysik, Saupfercheckweg 1, D-69117 Heidelberg, Germany
2
Zentrum für Astronomie der Universität Heidelberg, Astronomisches Rechen-Institut, Mönchhofstr. 12-14, 69120 Heidelberg, Germany
3
Max-Planck-Institut für Astronomie, Königstuhl 17, D-69117 Heidelberg, Germany
4
Astronomy & Astrophysics Section, School of Cosmic Physics, Dublin Institute for Advanced Studies, DIAS Dunsink Observatory, Dublin D15 XR2R, Ireland
5
Max Planck Institute for Astrophysics, Karl-Schwarzschild-Str. 1, 85748 Garching, Germany
6
Universität Heidelberg, Interdisziplinäres Zentrum für Wissenschaftliches Rechnen, 69120 Heidelberg, Germany
7
Istituto Nazionale di Astrofisica (INAF) – Osservatorio Astronomico di Palermo, Piazza del Parlamento 1, 90134 Palermo, Italy
8
European Southern Observatory, Karl-Schwarzschild-Strasse 2, 85748 Garching bei München, Germany
9
Lockheed Martin Solar and Astrophysics Laboratory, 3251 Hanover Street, Palo Alto, CA 94304, USA
10
School of Physical and Chemical Sciences, Queen Mary University of London, Mile End, London E1 4NS, UK
11
Gemini Observatory/NSFs NOIRLab, 950 N. Cherry Ave., Tucson, AZ 85719, USA
12
Departamento de Astrofísica, Centro de Astrobiología, CSIC-INTA, Ctra. Torrejón a Ajalvir km 4, E-28850 Torrejón de Ardoz, Spain
13
Department of Physics and Astronomy, The Open University, Walton Hall, Milton Keynes MK7 6AA, UK
⋆ Corresponding author: This email address is being protected from spambots. You need JavaScript enabled to view it.
Received:
29
January
2026
Accepted:
20
March
2026
Abstract
The evolutionary origin of Wolf-Rayet (WR) stars at solar metallicity is unclear. Single-star evolution from massive O stars, possibly via a luminous blue variable phase, is challenged by binary period distributions of different WR subtypes. Wd1-72 is a WN7b+O binary embedded in the collective wind of the Galactic young massive cluster Westerlund 1 (Wd 1). It is surrounded by highly structured nebulosity, with cometary tails pointing away from Wd 1 and quasi-spherical droplets towards it. In this Letter, we demonstrate that this morphology can be qualitatively reproduced by a hydrodynamic simulation of non-conservative Roche-lobe overflow (RLOF) mass loss into a cluster wind. Our model is based on a detailed binary evolution track consistent with key known properties of Wd1-72. Our work suggests Wd1-72 could be only ∼10 kyr post-RLOF, and the hydrogen-free nature of Wd1-72 favours this being a second or subsequent RLOF episode. Follow-up observations could make Wd1-72 a valuable benchmark for probing mass loss and mass transfer in forming gravitational-wave binary-progenitor systems.
Key words: hydrodynamics / binaries: close / circumstellar matter / stars: winds, outflows / stars: Wolf-Rayet
© The Authors 2026
 Open Access article, published by EDP Sciences, under the terms of the Creative Commons Attribution License (https://creativecommons.org/licenses/by/4.0), which permits unrestricted use, distribution, and reproduction in any medium, provided the original work is properly cited.
This article is published in open access under the Subscribe to Open model.
Open Access funding provided by Max Planck Society.
1. Introduction
In the classical single-star scenario proposed by Conti (1975), massive O stars undergo intense mass loss (ML), stripping the hydrogen (H) envelope and producing a Wolf-Rayet (WR) star. This may apply to the most massive stars (Minit ≳ 100 M⊙, e.g., Sabhahit et al. 2022), but steady winds alone are potentially insufficient to do this for a wider range of initial masses. A brief luminous blue variable (LBV) phase with eruptive ML has therefore been suggested (Langer et al. 1994) and is applied in grids of massive-star evolution models (e.g., Ekström et al. 2012). In these evolution models, the resulting WR stars usually begin with a nitrogen-rich surface (WN-type) of a late subtype and then pass gradually to earlier subtypes and eventually to the carbon-rich WC stage (e.g. Groh et al. 2014). However, while there are a few observations of transitional WN/WC and even WN/WO stars (e.g., Conti & Massey 1989; Sander et al. 2026), the single-star nature of larger LBV eruptions has been questioned (e.g., Boffin et al. 2016; Hirai et al. 2021).
The majority of massive stars are in multiple systems and will experience some binary interaction in their lifetime (e.g. Sana et al. 2012; de Mink et al. 2014). These effects have long been suggested as an alternative path to strip away enough of the outer envelope to form a WR star (e.g. Paczyński 1967). Binary stripping could also break the presumption of self-stripping, where WR stars form as (very) late WN subtypes and then consecutively evolve to earlier ones. Dsilva et al. (2023) showed that the Galactic WN binary population has mostly short periods (1–10 d), whereas the WC population distribution peaks at ∼5000 d. This implies that their formation pathways are different, leaving many open questions about descendants of these systems. This has implications not only for our understanding of WR formation, but also for the properties of the progenitors of gravitational waves from black hole binary mergers (e.g., Higgins et al. 2021; Marchant & Bodensteiner 2024).
The young massive cluster Westerlund 1 (Wd 1) is an ideal laboratory for studying massive stellar evolution due to its large, diverse, and likely coeval (age ∼ 5.5 Myr; Castellanos et al. 2026, although this is debated by e.g. Beasor et al. 2021) population of massive stars. This includes 24 WR stars (> 90% of which are binaries, Crowther et al. 2006; Anastasopoulou et al. 2024) and the sgB[e] star Wd1-9 (Clark et al. 2020), which is likely a WR+OB binary system that recently experienced case-B mass transfer (Anastasopoulou et al. 2025). JWST observations of Wd 1 by the Extended Westerlund 1 and 2 Open Clusters Survey (EWOCS) collaboration showed that the cluster is surrounded by complex nebulosity (Guarcello et al. 2025). This finding is unexpected for a cluster this old because feedback is expected to have dispersed leftover natal gas on much shorter timescales (Portegies Zwart et al. 2010). In the west and south of Wd 1, the nebulosity appears to be embedded in a collective radially expanding cluster wind, driven by the powerful WR stars in the core. In the east, however, the cometary-like droplets appear to be centred on Wd1-72, a WN7b + late-O supergiant binary system (also known as WR A or WR 77sc) with two observed periods. A 7.63 d period (P) was reported by Bonanos (2007) in optical data and was also observed in X-rays by Anastasopoulou et al. (2024), who found an additional stronger P of 81 d. The X-ray spectrum of Wd1-72 is very similar to that of Wd1-9 (Clark et al. 2008; Anastasopoulou et al. 2024). Wd1-72 is also a binary, with both components similar to the Wd1-9 model proposed by Anastasopoulou et al. (2025), who suggested it as an analogue for the near future of Wd1-9.
In this Letter, the fifth in the EWOCS series, we demonstrate that the two key aspects of the qualitative morphology of the nebulosity around Wd1-72 as seen at 11 μm can be reproduced with a hydrodynamic model of intense non-conservative Roche-lobe overflow (hereafter RLOF) ML into a cluster wind. The ML properties are motivated by a bespoke binary stellar evolution track consistent with the known properties of Wd1-72. We briefly discuss implications for massive binary evolution and that follow-up observations are required to constrain the recent ML history, and we test the possible post-interaction nature of Wd1-72. Our Letter is organised as follows: In Sect. 2 we describe the evolutionary track. In Sect. 3 we present our simulation and compare it qualitatively with JWST observations. We discuss our findings and present our conclusions in Sect. 4. In the appendices, we describe our simulation setup (Appendix A), show how our evolutionary track compares to the measured properties of Wd1-72 (Appendix B), physical constraints on the eruption, and droplet properties disfavouring a giant LBV eruption (Appendix C), and estimates of dust emission from the simulation (Appendix D).
2. Methods
We used a newly computed MESA (version 10398, Paxton et al. 2011, 2013, 2015; Paxton et al. 2018, 2019) track with the same physics assumptions as in Jin et al. (2026), except for the wind mass-loss rate (Ṁ, see Jin et al. 2024 for details). In test hydrodynamic simulations, the RLOF material was found to disperse after ≲50 kyr, setting an upper limit for the timescale of depletion of surface H after an RLOF event. O stars are expected to retain some surface H after rapid RLOF in an intermediate slow RLOF phase for ≳100kyr (Clark et al. 2014), which would appear for instance as a WN9h spectral type, so this favours an evolutionary path with multiple RLOF episodes. One model with two RLOF events was identified in the grid of Jin et al. (2026) that was close to the known age, luminosity (Lbol), and P of Wd1-72, but was H free after ∼70 kyr. This model is at solar metallicity, has an initial P of 3.98 d, primary (initially more massive) Minit = 28.18 M⊙ and secondary Minit = 19.73 M⊙. We reran this evolutionary track with an increase of a factor of 4.7 in the Ṁ of the primary star starting immediately after the second RLOF event to approximately match the rate of 9 × 10⁻⁵ M⊙ yr−1 measured from spectra of Wd1-72 by Rosslowe (2015). This model reached a surface H abundance of ∼1% only ∼20 kyr post-RLOF (see left panel of Fig. 1) and was used in our hydrodynamic simulation described in Appendix A. We show the evolution of Ṁ, the stellar wind velocity (v∞), P, Lbol, and the H surface abundance in the left panel of Fig. 1 and compare this MESA track with Wd1-72 in Appendix B.
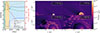 |
Fig. 1. Left: Evolution of Ṁ, v∞, P, Lbol, and the surface H abundance in our MESA track. The green, yellow, and blue panels correspond to pre-RLOF, RLOF, and WR wind phases. Right: Density slices for four key stages in the evolution of our simulation, with the cluster wind moving in the −z direction. |
3. Results
We show four key stages in the simulation evolution in the right panel of Fig. 1. The first panel shows RLOF material filling the pre-RLOF stellar bubble. The second panel shows the WR wind expanding into the RLOF material, with Rayleigh-Taylor (RT) fingers developing. The RLOF material asymmetry arises from the cluster wind. The third panel shows the RLOF material fragmented into RT clumps, with two distinct morphologies. The RT clumps manifest as small, quasi-spheroidal droplets in the +z (upstream) direction in the wake of the ejecta standoff bow shock (see Appendix C). In the −z direction, the structure is more filamentary. These differences arise due to the cluster wind, as the upstream RT clumps encounter a stagnation region where the flows collide, whereas the downstream RT clumps expand from one side only. In the final panel, the downstream RT clumps have separated into cometary-like droplets with tails. The upstream RT clumps disperse radially from the star on ballistic trajectories, whereas the downstream RT clumps are starting to be carried away in the cluster wind. This fragmentation is dependent on the spatial resolution of the simulation, with higher resolution leading to more efficient and rapid fragmentation. At this time, for the +z half of the domain, we find a total mass in clumps Mcl = 7.3 × 10⁻³ M⊙ and an average clump density ρcl = 8.8 × 10⁻²² g cm−3. For the −z half, we obtain  and ρcl = 2.9 × 10⁻²² g cm−3. Both halves have average Atwood numbers ∼0.99. We excluded any clumps in the region within 0.1 pc in r due to the z-axis boundary.
In Fig. 2 we compare the density field of our simulation with the JWST F1130W data towards Wd1-72. In the direction towards the cluster core, we observe quasi-spheroidal droplets in the data, which we also find in our simulation. In the opposite direction, the material around Wd1-72 is structured in droplets with cometary-like tails. These tails point away from the star as opposed to the cluster core (as seen elsewhere in Wd 1), which is also reproduced by our simulation. The main difference is the non-uniformity of the cometary tail distribution in the data, with the upper part of the figure being more sparsely populated than the lower part. We do not observe this type of spatial variability in our simulation. The material appears to be more filamentary towards the bottom, whereas more distinct droplets with tails are seen towards the top. We observe both of these morphologies in our simulation, but not at the same time. Finally, the material in the observations appears to be closer by a factor of ∼2 to Wd1-72 than in our simulations. This can be at least partially accounted for by the resolution dependence of the fragmentation and by the 2D nature of our simulation, as fragmentation would be more efficient in 3D. These results also depend on our assumptions of the density and velocity of the stellar and cluster wind and on our assumption of a spherically symmetric outflow.
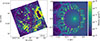 |
Fig. 2. Left: JWST/MIRI F1130W observations towards Wd1-72, which is marked with an orange star. Right: Density slice from our simulation mirrored around the z-axis at t = 6.795 Myr. We highlight the regions of spheroidal droplets in red and that of cometary-like droplets pointing towards Wd1-72 in pink, demonstrating the qualitative correspondence between the data and simulation. |
4. Discussion and conclusions
We demonstrated that the complex nebulosity surrounding Wd1-72 can be explained via intense ML characteristic of non-conservative RLOF being fragmented by a WR wind and carried away in a cluster wind. This scenario is not expected to strongly depend on the specific stellar evolution track, and we stress that the MESA track used here is only one possibility. The WN7 subtype favours this putative RLOF event being a second or subsequent one, as complete H removal in a single RLOF event is unlikely to occur before the droplets are dispersed. Our results are also similar to stellar wind bubble simulations of a WR wind fragmenting and sweeping up a shell of previously ejected red supergiant material (e.g., Garcia-Segura et al. 1996).
The most significant simplifying assumption we have made is a spherically symmetric outflow from Wd1-72. While an equatorial outflow would arguably be more realistic given the directional dependence of mass lost via L1 (e.g., Scherbak et al. 2025), our results would then be sensitive to the (currently unknown) system orientation with respect to the cluster wind. This difference in geometry might account for the non-uniform distribution of material around Wd1-72. We further assumed a fixed RLOF outflow velocity of 20 km s−1, consistent with values of a few tens of km s−1 expected for close massive binary systems (Scherbak et al. 2025). Given the high L/M and extended radii for the new WR immediately post-mass transfer, which both exceed values predicted for He main-sequence stars, we expect an enhanced wind Ṁ (e.g., Sander et al. 2020, 2023), which is in line with our adjusted MESA model. Finally, we did not consider radiation pressure accelerating the dusty RLOF material, which is expected to be negligible at scales ≳0.1 pc.
It has been suggested that rapidly rotating WR stars can be produced by LBV eruptions (Vink et al. 2011). However, ejecta nebulae around WR stars are rarely associated with binary central stars (Stock & Barlow 2010), and we demonstrate in Appendix C that a typical giant eruption Ṁ of about 0.1 M⊙ yr−1 is incompatible with the ejecta morphology, which requires eruptive Ṁ to be a few 10−4 M⊙ yr−1 at most. Given the WN7 subtype, this degree of H stripping from a minor eruption (≲0.5 M⊙) is disfavoured. Additional observations will greatly aid efforts to understand the outflows in Wd 1, especially around Wd1-72, as existing NIRCam JWST data here are highly saturated and affected by diffraction spikes. Integral-field spectroscopy would probe the physical conditions, line-of-sight velocities, compositions, and inclination angle of the droplets around Wd1-72, testing our proposed evolutionary scenario. An additional epoch of imaging for exampe with JWST/MIRI would provide proper motion measurements of the droplets that would constrain the currently unknown transition timescale from sgB[e] to newly emerged WR binary and the collective wind velocity of Wd 1. Finally, multi-epoch medium-resolution optical or near-IR spectra would probe which of the two X-ray periodicities is that of the binary system. This might also provide the rotational velocity of the secondary, which is expected to be spun up if mass transfer (MT) occurred recently.
If Wd1-72 is exiting a phase of recent MT, it suggests that unstable MT occurs in short-period WN binaries. When we consider that > 90% of the Wd 1 WR stars are in binaries, it would also add to the growing body of evidence that binary interactions are important for WR evolution at all metallicities. If our proposed scenario is true, then we have found the first short-period WN binary that was stripped recently enough to have RLOF material that can be quantitatively studied. Given the current lack of observed unstable MT systems (Marchant & Bodensteiner 2024), further study of Wd1-72 (and Wd1-9, if it is also post-MT) and its surroundings would then provide empirical benchmarks for multi-dimensional models of non-conservative MT outflows, and tests for MT efficiency assumptions used in current and future binary population synthesis codes. Both of these are poorly constrained at present, but are very relevant for understanding the evolutionary sequence from a massive binary to a gravitational wave merger event (regardless of whether Wd1-72 and/or Wd1-9 are merger progenitors themselves). A secondary effect here are the stellar wind properties of recent post-MT systems. The difference between the measured and MESA Ṁ of Wd1-72 suggests that stellar winds could remove more angular momentum over the thermal timescale (∼10 kyr, as the donor returns to equilibrium) than is accounted for in current wind prescriptions. This presents an additional uncertainty in massive binary evolution that ultimately affects which systems end up as gravitational wave mergers. We conclude that
-
the complex morphology of nebulosity around Wd1-72 can be reproduced by non-conservative RLOF ML followed by a Wolf-Rayet stellar wind expanding into a cluster wind,
-
follow-up observations of Wd1-72 and the nearby material are needed to test whether this material is from RLOF ML, if the system is a short-period binary, and if the companion has been spun up,
-
if Wd1-72 and Wd1-9 represent different evolutionary stages of recent post-interaction WN binaries, then further study of them and their RLOF material could help us to address how mass transfer shapes these systems, improving our understanding of gravitational-wave binary-progenitor systems.
Acknowledgments
We thank the referee for their feedback which has improved the Letter. We thank P.A. Crowther, A. Gilkis, M. Gronke, M. Mapelli, F.R.N. Schneider and J.S. Vink for discussions. CJKL gratefully acknowledges support from the International Max Planck Research School for Astronomy and Cosmic Physics at the University of Heidelberg in the form of an IMPRS PhD fellowship. AACS, RRL and CJKL are supported by the Deutsche Forschungsgemeinschaft (DFG, German Research Foundation) in the form of an Emmy Noether Research Group – Project-ID 445674056 (SA4064/1-1, PI Sander). This project was co-funded by the European Union (Project 101183150 – OCEANS). TJH acknowledges a Dorothy Hodgkin Fellowship, UKRI guaranteed funding for a Horizon Europe ERC consolidator grant (EP/Y024710/1) and UKRI/STFC grant ST/X000931/1. A.B acknowledges support from the Deutsche Forschungsgemeinschaft (DFG, German Research Foundation) under Germany’s Excellence Strategy – EXC 2094 – 390783311. FN gratefully acknowledges support by grant PID2022-137779OB-C41 funded by the Spanish Ministry of Science, Innovation and Universities/State Agency of Research MICIU/AEI/10.13039/501100011033 and by “ERDF A way of making Europe”. E.S. is supported by the international Gemini Observatory, a program of NSF NOIRLab, which is managed by the Association of Universities for Research in Astronomy (AURA) under a cooperative agreement with the U.S. National Science Foundation, on behalf of the Gemini partnership of Argentina, Brazil, Canada, Chile, the Republic of Korea, and the United States of America. The simulations presented here were performed on the HPC system Raven at the Max Planck Computing and Data Facility. This research has made use of the Astrophysics Data System, funded by NASA under Cooperative Agreement 80NSSC21M00561. This study used these software packages: PION (Mackey et al. 2021), pypion (Green & Mackey 2021), Numpy (Harris et al. 2020), matplotlib (Hunter 2007), yt (Turk et al. 2011), TORUS (Harries et al. 2019).
References
- Anastasopoulou, K., Guarcello, M. G., Flaccomio, E., et al. 2024, A&A, 690, A25 [NASA ADS] [CrossRef] [EDP Sciences] [Google Scholar]
- Anastasopoulou, K., Guarcello, M. G., Drake, J. J., et al. 2025, A&A, 701, A138 [NASA ADS] [CrossRef] [EDP Sciences] [Google Scholar]
- Andrews, H., Fenech, D., Prinja, R. K., Clark, J. S., & Hindson, L. 2018, MNRAS, 477, L55 [Google Scholar]
- Beasor, E. R., Davies, B., Smith, N., Gehrz, R. D., & Figer, D. F. 2021, ApJ, 912, 16 [NASA ADS] [CrossRef] [Google Scholar]
- Boffin, H. M. J., Rivinius, T., Mérand, A., et al. 2016, A&A, 593, A90 [NASA ADS] [CrossRef] [EDP Sciences] [Google Scholar]
- Bonanos, A. Z. 2007, AJ, 133, 2696 [NASA ADS] [CrossRef] [Google Scholar]
- Castellanos, R., Najarro, F., Garcia, M., et al. 2026, A&A, 708, A209 [NASA ADS] [CrossRef] [EDP Sciences] [Google Scholar]
- Clark, J. S., Muno, M. P., Negueruela, I., et al. 2008, A&A, 477, 147 [NASA ADS] [CrossRef] [EDP Sciences] [Google Scholar]
- Clark, J. S., Ritchie, B. W., Najarro, F., Langer, N., & Negueruela, I. 2014, A&A, 565, A90 [NASA ADS] [CrossRef] [EDP Sciences] [Google Scholar]
- Clark, J. S., Ritchie, B. W., & Negueruela, I. 2020, A&A, 635, A187 [EDP Sciences] [Google Scholar]
- Conti, P. S. 1975, Mem. Soc. Royale Sci. Liege, 9, 193 [Google Scholar]
- Conti, P. S., & Massey, P. 1989, ApJ, 337, 251 [NASA ADS] [CrossRef] [Google Scholar]
- Crowther, P. A., Hadfield, L. J., Clark, J. S., Negueruela, I., & Vacca, W. D. 2006, MNRAS, 372, 1407 [Google Scholar]
- de Mink, S. E., Sana, H., Langer, N., Izzard, R. G., & Schneider, F. R. N. 2014, ApJ, 782, 7 [Google Scholar]
- Draine, B. T. 2003, ARA&A, 41, 241 [NASA ADS] [CrossRef] [Google Scholar]
- Dsilva, K., Shenar, T., Sana, H., & Marchant, P. 2023, A&A, 674, A88 [NASA ADS] [CrossRef] [EDP Sciences] [Google Scholar]
- Ekström, S., Georgy, C., Eggenberger, P., et al. 2012, A&A, 537, A146 [Google Scholar]
- Eldridge, J. J., Genet, F., Daigne, F., & Mochkovitch, R. 2006, MNRAS, 367, 186 [CrossRef] [Google Scholar]
- Garcia-Segura, G., Langer, N., & Mac Low, M. M. 1996, A&A, 316, 133 [NASA ADS] [Google Scholar]
- Green, S., & Mackey, J. 2021, Astrophysics Source Code Library [record ascl:2103.026] [Google Scholar]
- Green, S., Mackey, J., Haworth, T. J., Gvaramadze, V. V., & Duffy, P. 2019, A&A, 625, A4 [NASA ADS] [CrossRef] [EDP Sciences] [Google Scholar]
- Groh, J. H., Meynet, G., Ekström, S., & Georgy, C. 2014, A&A, 564, A30 [NASA ADS] [CrossRef] [EDP Sciences] [Google Scholar]
- Guarcello, M. G., Almendros-Abad, V., Lovell, J. B., et al. 2025, A&A, 693, A120 [NASA ADS] [CrossRef] [EDP Sciences] [Google Scholar]
- Harries, T. J., Haworth, T. J., Acreman, D., Ali, A., & Douglas, T. 2019, Astron. Comput., 27, 63 [NASA ADS] [CrossRef] [Google Scholar]
- Harris, C. R., Millman, K. J., van der Walt, S. J., et al. 2020, Nature, 585, 357 [NASA ADS] [CrossRef] [Google Scholar]
- Higgins, E. R., Sander, A. A. C., Vink, J. S., & Hirschi, R. 2021, MNRAS, 505, 4874 [NASA ADS] [CrossRef] [Google Scholar]
- Hirai, R., Podsiadlowski, P., Owocki, S. P., Schneider, F. R. N., & Smith, N. 2021, MNRAS, 503, 4276 [NASA ADS] [CrossRef] [Google Scholar]
- Hunter, J. D. 2007, Comput. Sci. Eng., 9, 90 [NASA ADS] [CrossRef] [Google Scholar]
- Jin, H., Langer, N., Lennon, D. J., & Proffitt, C. R. 2024, A&A, 690, A135 [NASA ADS] [CrossRef] [EDP Sciences] [Google Scholar]
- Jin, H., Langer, N., Ercolino, A., & de Mink, S. E. 2026, A&A, 707, A56 [NASA ADS] [CrossRef] [EDP Sciences] [Google Scholar]
- Langer, N., Hamann, W. R., Lennon, M., et al. 1994, A&A, 290, 819 [NASA ADS] [Google Scholar]
- Larkin, C. J. K., Hawcroft, C., Mackey, J., et al. 2025a, A&A, 703, L14 [NASA ADS] [CrossRef] [EDP Sciences] [Google Scholar]
- Larkin, C. J. K., Mackey, J., Haworth, T. J., & Sander, A. A. C. 2025b, A&A, 700, A60 [NASA ADS] [CrossRef] [EDP Sciences] [Google Scholar]
- Mackey, J., Green, S., Moutzouri, M., et al. 2021, MNRAS, 504, 983 [NASA ADS] [CrossRef] [Google Scholar]
- Marchant, P., & Bodensteiner, J. 2024, ARA&A, 62, 21 [NASA ADS] [CrossRef] [Google Scholar]
- Paczyński, B. 1967, Acta Astron., 17, 355 [NASA ADS] [Google Scholar]
- Paxton, B., Bildsten, L., Dotter, A., et al. 2011, ApJS, 192, 3 [Google Scholar]
- Paxton, B., Cantiello, M., Arras, P., et al. 2013, ApJS, 208, 4 [Google Scholar]
- Paxton, B., Marchant, P., Schwab, J., et al. 2015, ApJS, 220, 15 [Google Scholar]
- Paxton, B., Schwab, J., Bauer, E. B., et al. 2018, ApJS, 234, 34 [NASA ADS] [CrossRef] [Google Scholar]
- Paxton, B., Smolec, R., Schwab, J., et al. 2019, ApJS, 243, 10 [Google Scholar]
- Portegies Zwart, S. F., McMillan, S. L. W., & Gieles, M. 2010, ARA&A, 48, 431 [NASA ADS] [CrossRef] [Google Scholar]
- Rosslowe, C. 2015, Ph.D. Thesis, University of Sheffield, UK [Google Scholar]
- Sabhahit, G. N., Vink, J. S., Higgins, E. R., & Sander, A. A. C. 2022, MNRAS, 514, 3736 [NASA ADS] [CrossRef] [Google Scholar]
- Sana, H., de Mink, S. E., de Koter, A., et al. 2012, Science, 337, 444 [Google Scholar]
- Sander, A. A. C., Vink, J. S., & Hamann, W. R. 2020, MNRAS, 491, 4406 [Google Scholar]
- Sander, A. A. C., Lefever, R. R., Poniatowski, L. G., et al. 2023, A&A, 670, A83 [NASA ADS] [CrossRef] [EDP Sciences] [Google Scholar]
- Sander, A. A. C., Lefever, R. R., Josiek, J., et al. 2026, Nat. Astron., 10, 290 [Google Scholar]
- Scherbak, P., Lu, W., & Fuller, J. 2025, ApJ, 990, 172 [Google Scholar]
- Stock, D. J., & Barlow, M. J. 2010, MNRAS, 409, 1429 [Google Scholar]
- Turk, M. J., Smith, B. D., Oishi, J. S., et al. 2011, ApJS, 192, 9 [NASA ADS] [CrossRef] [Google Scholar]
- Vink, J. S., Gräfener, G., & Harries, T. J. 2011, A&A, 536, L10 [NASA ADS] [CrossRef] [EDP Sciences] [Google Scholar]
Appendix A: Hydrodynamic model
We performed our simulations using the (magneto-)hydrodynamic code PION (Mackey et al. 2021). Unless otherwise noted, the simulation setup and parameters used are as for the simulation presented in Larkin et al. (2025b). In particular, we assume full photoionization due to the intense extreme-ultraviolet (EUV) radiation field ionising cool circumstellar material near the cluster core (Andrews et al. 2018), include radiative heating and cooling with model 8 of PION as described in Green et al. (2019), and do not include a magnetic field. We use six levels of static mesh refinement for the simulation, using a 2D cylindrical domain D(r, z) of r ∈ [0, 10.0 × 10¹⁸] cm, z ∈ [ − 10.0 × 10¹⁸, 10.0 × 10¹⁸] cm. D is fully covered at level n = 0 and each subsequent level of refinement covers a sub-domain of diameter D/2n. We use 256 × 512 grid cells per level of refinement, such that the finest grid resolution is Δx = 1.22 × 1015 cm.
We assume a constant cluster wind of vz = −1500 km s−1, density 1 × 10⁻²⁴ g cm−3 and pressure 5 × 10⁻⁹ dyn cm−2 (Larkin et al. 2025a,b). We use the MESA evolutionary track described above as input for the source term in our hydrodynamic model, with a wind injection radius of 5 × 1016 cm (∼20 cells). We begin the simulation at 6.779 Myr to establish a pre-RLOF stellar bubble, and run it until 6.82 Myr, by which time the RLOF material has left the domain. We use the Ṁ value of the primary star throughout the simulation, assuming fully non-conservative mass transfer. We calculate v∞ from the MESA track by scaling the primary star’s escape velocity by the Teff-dependent prescription of Eldridge et al. (2006) except for during RLOF where we use a fixed value of 20km s−1 (Scherbak et al. 2025).
Appendix B: MESA track
Here we address the compatibility of our assumed MESA track with the known age, luminosity, period and surface H abundance of Wd1-72. Our track is 6.8 Myr post-ZAMS which is comparable to the cluster age of ∼4.5 − 6.5 Myr found by Castellanos et al. (2026). Rosslowe (2015) derive a luminosity of logL = 5.45 for the WR star. Our MESA track has a value of logL = 5.0 for t = 6.80 Myr, but this difference can be accounted for by the choice of extinction law in Rosslowe (2015) and the poorly constrained contribution of the secondary star. Our MESA track has P = 6.6d at t = 6.80 Myr, and reaches 6.9d at t = 6.81 Myr. At t = 6.80 Myr in the MESA track, surface H abundance is less than 10%, with depletion to 1% being reached at t ∼ 6.805 Myr.
There is a mild discrepancy between the time when the droplet morphology corresponds well with the observations (t ∼ 6.80 Myr) and when the MESA track orbital period and surface H abundance best match the measured properties of Wd1-72 (t ∼ 6.81 Myr). At this later time we observe the droplets are blown out of the simulation domain by the cluster wind.
We also show two other simulations for comparison. In Fig. B.1 we show the result of using the default MESA track without enhanced Ṁ. The RLOF material fragmentation is slower, and we see the material is partially sheared by the cluster wind. To test the sensitivity to Mach number in Fig. B.2 we show the result of using the enhanced MESA track, but with a cluster wind velocity of 1000km s−1. Qualitatively the morphology is similar, with the clumps dispersing slightly faster in this simulation. In both cases the key morphological properties are reproduced.
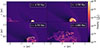 |
Fig. B.1. Density slice similar to the right panel of Fig. 1 but employing the default MESA track in the simulation. |
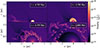 |
Fig. B.2. Density slice similar to the right panel of Fig. 1 but using a cluster wind velocity of 1000km s−1 in the simulation. |
Appendix C: Physical constraints on the eruption and droplet properties
Here we demonstrate analytically that a giant LBV eruption cannot account for the observations around Wd1-72. Assuming an eruption instead of RLOF ML, the fragmentation can only occur when the ram-pressures of the eruption and cluster wind are approximately balanced, creating a standoff bow shock. RT fingers would then develop in the wake of this bow shock. From the data we see the standoff distance would be at d ∼ 0.5 pc from the star. We can balance the ram-pressures to obtain the ejection wind density ρE at d:
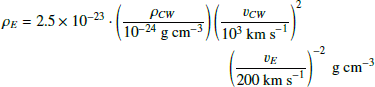
Where ρCW, vCW and vE are the cluster wind density, cluster wind velocity and eruption velocity respectively. Applying the continuity equation, the equivalent eruption Ṁ for this density can be expressed as:
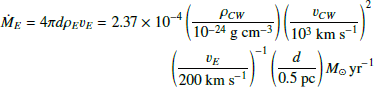
For reasonable choices of these parameters, it is clear Ṁ must be of order a few 10−4 M⊙ yr−1 at most for the ejecta to fragment in the cluster wind at this distance, assuming vE ∼ 200 km s−1. Higher Ṁ is only possible if vE is around an order of magnitude less, such as for RLOF. In this case, a dense shell of CSM develops during the RLOF phase, which is then fragmented from within via RT instabilities driven by the WR wind. We see this mechanism operating in Fig. C.1, where we show a slice of z−axis velocity (vz) from our simulation.
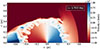 |
Fig. C.1. Simulation slice of z−axis velocity at 6.7925 Myr. |
The droplets towards the cluster wind have expansion velocities 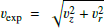 of order ≲50 km s−1 as they are at the stagnation point of the flow and so are decelerated. The downstream droplets are accelerated by the WR wind and/or cluster wind, whichever impacts them. We show a slice of vexp in Fig. C.2.
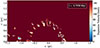 |
Fig. C.2. Simulation slice of expansion velocity at 6.795 Myr. |
Fig. C.3 shows again the z component of velocity, vz, but here at the later time of 6.800 Myr. Panels (b) and (c) show vz along almost-vertical lines passing through the head of the dense clumps in the downstream and upstream regions, respectively. Apart from the velocity offset, we can see that the velocity shear in the downstream region is about 800 km s−1 between the heads of the dense clumps and the hot gas streams past them. In contrast, the upstream region has much less uniform shear that varies from 150 − 500 km s−1. The stagnation of the flow in the upstream region due to external ram pressure explains why the ‘droplets’ do not have coherent cometary tails when compared with the downstream region. In 2D simulations the flow is artificially constrained by the rotational symmetry, and it is likely that 3D simulations would have even more random flow patterns in the upstream direction. The lack of external pressure in the downstream direction allows a more ordered flow to develop, producing cometary globules with coherent tails pointing away from Wd1-72.
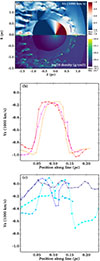 |
Fig. C.3. Velocity shear across dense clumps at t = 6.800 Myr: (a) horizontal component of the gas velocity, vz, is shown in the upper half-plane and gas density (log10 ρ/g cm−3) in the lower half-plane. Dense clumps with ρ > 10−22 g cm−3 are indicated by the black contours, and the seven almost-vertical lines show the slices where the vz is plotted in panels (b) and (c). Panel (b) shows vz in the colour-coded lines across the three downstream dense clumps, with distance measured from the large-z end of the line, to show the velocity shear at the edge of the clumps. Panel (c) shows the same but for the upstream dense clumps. |
Appendix D: Dust emission from dense clumps
We used the TORUS Monte Carlo radiative transfer code (Harries et al. 2019) to calculate thermal dust emissivity and dust temperature in the droplets produced by our simulation. We assume a constant 1% dust mass fraction for the RLOF material, and that the fast stellar winds and the cluster wind are dust free. We use the same TORUS settings as Larkin et al. (2025b), specifically assuming silicate grains (Draine 2003) and a grain-size distribution with power-law index of -3.3 from 0.005 to 0.2 μm.
We added six radiation sources, all of which are at R = 0 along the z-axis, imposed because of symmetry constraints of the 2D simulations. Wd1-72 is treated as a source with log10L/L⊙ = 5.45 and 65 kK at z = 0 pc, the core of Wd 1 with log10L/L⊙ = 5.9, T = 40 kK at z = 1 pc, WR U with log10L/L⊙ = 5.5, T = 38 kK at z = 0.5 pc, two sources representing nearby (in projection) WR stars with log10L/L⊙ = 5.2, T = 50 kK at z = 0.48 and 0.52 pc, and a source in the downstream region with log10L/L⊙ = 5.5, T = 7.5 kK at z = −0.25 pc.
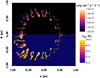 |
Fig. D.1. Upper half plane: thermal dust emissivity (ϵ) at at t = 6.795 Myr calculated with the TORUS radiative transfer code, calculated at λ = 11 μm in units of erg cm−3 s−1 Å−1. Lower half-plane: dust temperature (Tdust) assuming radiative equilibrium, where blue regions are dust-free and so the temperature is not defined. |
Results of the TORUS modelling are shown in Fig. D.1, where we plot dust emissivity ϵ (the TORUS variable etacont with units erg cm−3 s−1 Å−1) in the upper half-plane and dust temperature in the lower half-plane. We did not calculate emission maps because the rotational symmetry imposed by the 2D simulation converts all features into rings.
Looking at Tdust, the droplets towards the core of Wd 1 are warmer than those in the downstream direction, as expected due to the intense cluster radiation field. The tails of the globules (at z < −0.5 pc) are even cooler and their emission at 11 μm is faint in comparison to the rest of the dusty material. Comparing with Fig. 2 the same morphology is seen in the JWST image. We cannot quantitatively compare the brightness of simulated dust emission with observations without a 3D simulation, which is currently too computationally expensive to justify given the large uncertainties in the mass and expansion velocity of the droplets and globules.
All Figures
|
Fig. 1. Left: Evolution of Ṁ, v∞, P, Lbol, and the surface H abundance in our MESA track. The green, yellow, and blue panels correspond to pre-RLOF, RLOF, and WR wind phases. Right: Density slices for four key stages in the evolution of our simulation, with the cluster wind moving in the −z direction. |
| In the text | |
|
Fig. 2. Left: JWST/MIRI F1130W observations towards Wd1-72, which is marked with an orange star. Right: Density slice from our simulation mirrored around the z-axis at t = 6.795 Myr. We highlight the regions of spheroidal droplets in red and that of cometary-like droplets pointing towards Wd1-72 in pink, demonstrating the qualitative correspondence between the data and simulation. |
| In the text | |
|
Fig. B.1. Density slice similar to the right panel of Fig. 1 but employing the default MESA track in the simulation. |
| In the text | |
|
Fig. B.2. Density slice similar to the right panel of Fig. 1 but using a cluster wind velocity of 1000km s−1 in the simulation. |
| In the text | |
|
Fig. C.1. Simulation slice of z−axis velocity at 6.7925 Myr. |
| In the text | |
|
Fig. C.2. Simulation slice of expansion velocity at 6.795 Myr. |
| In the text | |
|
Fig. C.3. Velocity shear across dense clumps at t = 6.800 Myr: (a) horizontal component of the gas velocity, vz, is shown in the upper half-plane and gas density (log10 ρ/g cm−3) in the lower half-plane. Dense clumps with ρ > 10−22 g cm−3 are indicated by the black contours, and the seven almost-vertical lines show the slices where the vz is plotted in panels (b) and (c). Panel (b) shows vz in the colour-coded lines across the three downstream dense clumps, with distance measured from the large-z end of the line, to show the velocity shear at the edge of the clumps. Panel (c) shows the same but for the upstream dense clumps. |
| In the text | |
|
Fig. D.1. Upper half plane: thermal dust emissivity (ϵ) at at t = 6.795 Myr calculated with the TORUS radiative transfer code, calculated at λ = 11 μm in units of erg cm−3 s−1 Å−1. Lower half-plane: dust temperature (Tdust) assuming radiative equilibrium, where blue regions are dust-free and so the temperature is not defined. |
| In the text | |
Current usage metrics show cumulative count of Article Views (full-text article views including HTML views, PDF and ePub downloads, according to the available data) and Abstracts Views on Vision4Press platform.
Data correspond to usage on the plateform after 2015. The current usage metrics is available 48-96 hours after online publication and is updated daily on week days.
Initial download of the metrics may take a while.