


| Issue |
A&A
Volume 710, June 2026
|
|
|---|---|---|
| Article Number | A276 | |
| Number of page(s) | 14 | |
| Section | Planets, planetary systems, and small bodies | |
| DOI | https://doi.org/10.1051/0004-6361/202557890 | |
| Published online | 24 June 2026 | |
Bayesian inversion of the Hapke model on (4) Vesta’s avalanches and ejecta: Photometric constraints on regolith evolution
Université Paris Cité, Institut de physique du globe de Paris, CNRS,
75005
Paris,
France
★ Corresponding author: This email address is being protected from spambots. You need JavaScript enabled to view it.
Received:
29
October
2025
Accepted:
11
May
2026
Abstract
Context. The Dawn mission revealed significant photometric variability on (4) Vesta, particularly in areas with craters, avalanches, cliffs, and ejecta. Understanding how surface processes control these variations is essential to understanding regolith evolution on airless bodies.
Aims. We test the hypothesis that the photometric behavior of bright units can be explained by granular segregation during mass wasting and impact emplacement rather than by subsequent optical maturation.
Methods. Using a Bayesian approach, we inverted a four-parameter Hapke model at two sites: bright avalanches in the Cornelia crater and a fresh ejecta deposit on the Matronalia Rupes scarp. For each geomorphological unit, we adjusted median reflectance factors for phase angles ranging from 10° to 70°. Because the available data do not identify the opposition effect robustly, the main inversion was complemented by sensitivity tests that use literature-based fixed shadow-hiding opposition effect (SHOE) prescriptions, which are reported explicitly for Cornelia. We retrieved the Hapke parameters {ω, θ-, b, c} with full posteriors.
Results. Fresh, bright deposits at both sites exhibit higher single-scattering albedo (ω) than adjacent older or fine-depleted surfaces. The photometric roughness (θ-) is likely higher for the Cornelia avalanches than the crater floor and opposite wall. At Cornelia, sensitivity tests show that ω, θ-, and the relative ordering of terrains remain stable, whereas the absolute values of the phase-function parameters (b, c) depend more strongly on how SHOE is represented.
Conclusions. Granular segregation during emplacement explains the brightest units, while optical maturation and surface stabilization explain the darker ones. Even without direct opposition coverage, the baseline inversion and Cornelia SHOE sensitivity tests yield a consistent relative “freshness ranking” that complements morphological superposition. This ranking provides a transferable framework for interpreting regolith processes on airless bodies.
Key words: radiative transfer / scattering / methods: data analysis / techniques: photometric / minor planets, asteroids: general / planets and satellites: surfaces
© The Authors 2026
 Open Access article, published by EDP Sciences, under the terms of the Creative Commons Attribution License (https://creativecommons.org/licenses/by/4.0), which permits unrestricted use, distribution, and reproduction in any medium, provided the original work is properly cited.
This article is published in open access under the Subscribe to Open model. This email address is being protected from spambots. You need JavaScript enabled to view it. to support open access publication.
1 Introduction
Photometric observations of (4) Vesta, from early ground-based light curves to spacecraft imaging, have progressively revealed a surface shaped by composition, texture, impact gardening, and regolith reworking. Early ultraviolet–blue–visual (UBV) photometric observations indicated rotational color variations and surface heterogeneity (Blanco & Catalano 1979), while laboratory experiments with eucritic powders showed that mixtures of coarse grains coated by fine dust can reproduce important albedo and polarization trends (Le Bertre & Zellner 1980). Disk-resolved studies of other small bodies, such as 433 Eros (Helfenstein & Veverka 1987; Domingue et al. 2002), further demonstrated that photometric behavior is sensitive not only to composition, but also to regolith texture and surface transport processes. These earlier results provide the context in which Vesta can be used as a natural laboratory for linking photometric parameters to the physical state of an airless regolith.
The Dawn mission refined this view by providing global and regional photometric constraints with the Framing Camera (FC). Global analyses measured a high geometric albedo for Vesta and showed that the wavelength dependence of the photometric parameters is generally weak, except for albedo (Reddy et al. 2012; Li et al. 2013). Regional mapping then revealed that photometric variations are associated with albedo units, mineralogical contrasts, surface roughness, and the maturity of the regolith (Jaumann et al. 2012; Schröder et al. 2013). In particular, young ejecta and fresh mass-wasting deposits tend to be brighter and to display shallower phase slopes than older or smoother surfaces. Such contrasts may arise from the excavation of less mature material, the redistribution of fine regolith particles, the exposure of blocky or rough surfaces, granular segregation during flows, and subsequent optical maturation by space weathering. Large-scale mass wasting, including landslides and deposits along Matronalia Rupes, has also been documented from Dawn imaging (Krohn et al. 2014; Parekh et al. 2021), making Vesta a useful target for studying how slope processes modify regolith photometric properties.
A key difficulty is that these physical processes can affect different parts of the photometric model in coupled ways. The single-scattering albedo mainly tracks optical brightness, photometric roughness captures unresolved shadowing by surface structure, and phase-function parameters describe the effective single-particle scattering behavior. Interpreting these parameters therefore requires a formulation that separates robust relative contrasts from quantities that are model-dependent. This issue is particularly important for the opposition effect. Observations closer to opposition show that Vesta has a non-negligible opposition contribution (Hasegawa et al. 2014), and similar concerns have been discussed for other airless bodies, such as Ceres (Schröder et al. 2018). However, the local datasets considered here mostly sample moderate phase angles and do not allow the shadow-hiding opposition effect (SHOE) to be uniquely identified. The Hapke formalism remains attractive because it preserves physically interpretable parameters, but the partition between SHOE and the single-particle phase function becomes non-unique when low-phase-angle coverage is limited.
We therefore used the Hapke parameters as comparative diagnostics of geomorphological units rather than as absolute, uniquely determined measurements of grain size, packing state, or composition. This cautious use of the model is well suited to the scientific question addressed here: whether local bright deposits on Vesta can be understood as recently mobilized or excavated material, and which parts of that interpretation remain stable when the treatment of SHOE is varied. We used clear-filter Dawn/FC images acquired during the Survey and High Altitude Mapping Orbit (HAMO) phases, together with local geometry based on the digital terrain model (DTM), to analyze two bright-feature sites: (i) avalanches in the Cornelia crater and (ii) a small-crater ejecta deposit on the Matronalia Rupes scarp (Fig. 1). We inferred relative ages from superposition relationships and tested whether the observed photometric contrasts are more consistent with granular segregation during emplacement, optical maturation, or a combination of the two. Our goals are to quantify reflectance contrasts among subunits, retrieve the corresponding Hapke parameters with full posterior distributions, and identify which inferences remain stable when SHOE is represented in different ways. This approach places the local avalanche and ejecta deposits within a broader framework for regolith evolution on Vesta while explicitly tracking the limits imposed by the available phase-angle range.
The manuscript is organized as follows: Section 2 describes the FC datasets, geometry, and reflectance factor extractions for each subunit. Section 3 introduces the Bayesian inversion strategy of the Hapke photometric model combined with a DTM. Section 4 presents the retrieved parameters, their uncertainties, and their spatial patterns. Section 5 examines the implications for Vesta’s slope processes and space weathering. Section 6 summarizes the main results and offers perspectives.
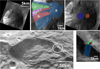 |
Fig. 1 Targets and photometric subregions in Dawn/FC panchromatic imagery for the Cornelia crater (top row) and the Matronalia Rupes (bottom row). Top left: context image with a mean GSD of ~20 m. Top center: delimitation of the four avalanches. Top right: Crater floor (dark blue), including the protuberance below avalanche a, and the opposite wall unit (in orange). Bottom left: context image with a mean GSD of ~250 m. Bottom right: small crater (red), ejecta (green), and scarp slope (blue). The panels use clear-filter FC mosaics re-projected onto the stereo DTM of Preusker et al. (2014); these products provide the geomorphological framework used to define the ROIs. |
2 Observations
2.1 Targets and observation geometry
Cornelia is a 17-km-wide impact crater located at 9°S, 226°E in the Numisia region (AV-9 in the Dawn/FC quadrangle system of Williams et al. 2014). Mass wasting features in this region are discussed in Krohn et al. (2014). The FC context shown in Fig. 1a has a mean ground sampling distance (GSD) of ~20 m and reveals a series of bright avalanches along the crater wall. The superposition of these avalanches allowed us to establish a relative chronology, labeled a through d, where a is older and d younger. We treated the crater floor opposite the avalanche complex as an older unit. We excluded the zone between avalanches b and d due to its uncertain origin.
A second site lies along the largest arc of Matronalia Rupes, a 208-km-long scarp centered at 49.5°S, 82.7°E, within the AV-11 Pinaria and AV-12 Sextilia quadrangles of the Dawn/FC map system defined by Williams et al. (2014). We defined three photometric subregions there: (i) the small crater, (ii) its bright ejecta, and (iii) the scarp slope (Fig. 1b). The FC context shown in Fig. 1b has a mean GSD of ~250 m. For the photometric analysis, we selected clear-filter, panchromatic images acquired during the SURVEY and HAMO phases to maximize phase-angle coverage while retaining the finest local sampling available at each site. The FC clear filter spans 0.4–1.0 μm, and the images were radiometrically calibrated using the U.S. Geological Survey (USGS) Integrated Software for Imagers and Spectrometers (ISIS) FC pipeline. We did not reprocess the images using the calibration refinements described in Kovács et al. (2024). Since our analysis relies on region of interest (ROI) medians and relative trends in clear-filter I/F, we do not expect this choice to affect the comparative results, though the absolute I/F may shift slightly.
Initially, we used the stereo-derived DTM from Preusker et al. (2014) for co-registration, but the residuals exceeded two pixels (up to ~550 m for SURVEY images). Therefore, we performed a bundle adjustment to refine the camera poses and 3D tie points jointly and re-projected all images onto the DTM. After co-registration (19 images for Cornelia and 25 images for Matronalia Rupes), we digitized the ROIs, as shown in Fig. 1. The FC data from these sites do not include opposition surge or very large phase angles, consistent with the observing geometries discussed by Schröder et al. (2013). In all ROIs, the phase angles vary between approximately 10° and 70° (Fig. 2).
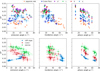 |
Fig. 2 Reflectance factor (I/F) for the Cornelia (top) and Matronalia Rupes (bottom) subregions as a function of incidence, emission, and phase geometry. The error bars represent the standard deviation within each ROI. Angles are computed relative to the local surface derived from the DTM. |
2.2 Image calibration and raw observations
Following Schröder & Gutiérrez-Marqués (2013), we converted the pixel radiance (L, in W m−2 sr−1) to the reflectance factor (I/F):
![Mathematical equation: $\[\frac{I}{F}=\frac{\pi d^2 L}{\Phi},\]$](/articles/aa/full_html/2026/06/aa57890-25/aa57890-25-eq4.png) (1)
(1)
where d [AU] is the heliocentric distance at the observation epoch (i.e., the distance from Vesta to the Sun), and Φ [Wm−2] is the effective solar flux at 1 AU in the panchromatic band. For each ROI and image, we computed the median I/F across ROI pixels to minimize the impact of outliers and reduce computational cost. Incidence (i), emission (e), and phase (g) angles are derived from DTM-based local geometry. We used their median values for each ROI-observation combination because the within-ROI angular spread is generally smaller than the between-image variation that drives the inversion, while medians remain robust to local outliers near ROI edges. Figure 2 summarizes both the photometric trend and the within-ROI angular dispersion.
As expected, I/F decreases with increasing phase angle for all subregions (Fig. 2). Morphologically younger units exhibit higher reflectance. For example, the Cornelia ‘d’ avalanche and the Matronalia ejecta are consistently brighter than older avalanches, the crater floor, and the slope units.
3 Photometric modeling and Bayesian inversion
Several reflectance models have been explored in global photometric analysis of Vesta. Li et al. (2013) found that both the Akimov and Hapke formulas were effective on Dawn/FC data. However, Schröder et al. (2013) favored a simpler two-parameter model because the opposition effect and photometric roughness parameters in the Hapke model were difficult to constrain using the available data. The Kaasalainen-Shkuratov model, in particular, can be robust with sparse coverage at small phase angles, as discussed by Kaasalainen et al. (2001); Shkuratov et al. (2011). Because the Kaasalainen-Shkuratov formulation is mainly semi-empirical, whereas the Hapke formulation retains parameters linked to albedo, photometric roughness, and single-particle scattering, we adopted the Hapke model for the comparative physical interpretation pursued here, while disabling non-identifiable terms and treating the most degenerate quantities through sensitivity tests.
3.1 Hapke reflectance model
We adopted a Hapke formulation in which only parameters supported by the available angular coverage are adjusted in the baseline inversion. Following Li et al. (2013), the porosity correction is fixed to unity rather than treated as an independent parameter; this avoids adding a poorly identifiable degree of freedom to local datasets that do not sample the opposition surge adequately and is appropriate for the comparative use of the parameters adopted here. As noted by Hapke (2012b), the SHOE can contribute over phase angles of about 3° to 20°, while the coherent backscatter opposition effect (CBOE) is significant mainly below ~3°. Our data do not sample the CBOE-dominated range, so CBOE is ignored. They do include some observations in the SHOE-sensitive range, but not enough low-phase-angle coverage to identify the SHOE amplitude (B0) and angular width (h) robustly if both are fitted freely. We therefore retained the four-parameter inversion as the common baseline across all ROIs and use Appendix A to quantify how the results change when SHOE is either fitted freely in a six-parameter free-SHOE model, {ω, ![Mathematical equation: $\[\bar{\theta}\]$](/articles/aa/full_html/2026/06/aa57890-25/aa57890-25-eq5.png) , b, c, B0, h}, or fixed to literature-based values in fixed-SHOE models. The fixed-SHOE tests are used as a physically motivated regularization and as a robustness check, not as a claim that one unique opposition prescription is identified by the data. This choice should not be interpreted as implying that SHOE is absent; rather, it reflects the fact that its contribution is not uniquely determined by the present observations. Under the baseline formulation, the bidirectional reflectance factor I/F can be expressed as
, b, c, B0, h}, or fixed to literature-based values in fixed-SHOE models. The fixed-SHOE tests are used as a physically motivated regularization and as a robustness check, not as a claim that one unique opposition prescription is identified by the data. This choice should not be interpreted as implying that SHOE is absent; rather, it reflects the fact that its contribution is not uniquely determined by the present observations. Under the baseline formulation, the bidirectional reflectance factor I/F can be expressed as
![Mathematical equation: $\[\begin{aligned}\frac{I}{F}(i, e, g)= & \frac{\omega}{4 \mu_0} \frac{\mu_{0 e}}{\mu_{0 e}+\mu_e} \\& \times\left[p(g, b, c)+H\left(\mu_{0 e}\right) H\left(\mu_e\right)-1\right] S(i, e, g, \bar{\theta}),\end{aligned}\]$](/articles/aa/full_html/2026/06/aa57890-25/aa57890-25-eq6.png) (2)
(2)
where μ0 = cos i and μ = cos e are the cosines of the incidence and emission angles, μ0e and μe are their roughness-corrected counterparts (Hapke 1984). The four free parameters are the single-scattering albedo (ω), the photometric roughness (![Mathematical equation: $\[\bar{\theta}\]$](/articles/aa/full_html/2026/06/aa57890-25/aa57890-25-eq7.png) ), and the two-term Henyey-Greenstein (HG2) phase-function parameters (b and c) expressed as
), and the two-term Henyey-Greenstein (HG2) phase-function parameters (b and c) expressed as
![Mathematical equation: $\[\begin{aligned}p(g, b, c)= & (1-c) \frac{1-b^2}{\left(1+2 b ~\cos~ g+b^2\right)^{3 / 2}} \\& +c \frac{1-b^2}{\left(1-2 b ~\cos~ g+b^2\right)^{3 / 2}}.\end{aligned}\]$](/articles/aa/full_html/2026/06/aa57890-25/aa57890-25-eq8.png) (3)
(3)
The b is the Hapke asymmetry parameter and c is the backscattering parameter. In the adopted HG2 formulation, b primarily controls the width of the scattering lobes, whereas c controls the relative weight of the backward- and forward-scattering components. Multiple scattering is handled using the isotropic multiple scattering approximation of Hapke (2012b), via the Chandrasekhat H-function. The function S(i, e, g, ![Mathematical equation: $\[\bar{\theta}\]$](/articles/aa/full_html/2026/06/aa57890-25/aa57890-25-eq9.png) ) captures the surface self-shadowing from photometric roughness, as in Hapke (1984).
) captures the surface self-shadowing from photometric roughness, as in Hapke (1984).
3.2 Bayesian inversion of the Hapke model
We inferred the baseline Hapke model parameters of each ROI, denoted by m = {ω, ![Mathematical equation: $\[\bar{\theta}\]$](/articles/aa/full_html/2026/06/aa57890-25/aa57890-25-eq10.png) , b, c}, using a Metropolis-Hastings sampler (Nguyen et al. 2025; Kugler et al. 2022). For this baseline HG2 parameterization, we adopted uniform exploratory bounds:
, b, c}, using a Metropolis-Hastings sampler (Nguyen et al. 2025; Kugler et al. 2022). For this baseline HG2 parameterization, we adopted uniform exploratory bounds:
![Mathematical equation: $\[\omega \in[0,1], \quad \bar{\theta} \in\left[0^{\circ}, 60^{\circ}\right], \quad b \in[0,1], \quad c \in[0,1].\]$](/articles/aa/full_html/2026/06/aa57890-25/aa57890-25-eq11.png)
The interval retained for c should be read as a conventional subset of the HG2 parameter space used to regularize sampling and to facilitate comparison with previous Vesta studies; more generally, the admissible domain depends on the requirement that the phase function remain non-negative. In the Metropolis-Hastings sampler, candidate models are drawn from Gaussian proposal distributions in parameter space, and the proposal step sizes are adapted during the early sampling stage to keep the acceptance rate in a useful range. The burn-in is the initial transient part of the chain, before it samples the stationary posterior, and thinning means retaining every nth accepted sample to reduce serial correlation in the stored draws. We assessed convergence using the effective sample size together with the absence of long-range trends in trace plots. We found that ≳106 samples per ROI yielded smooth, stable posteriors. Appendix A shows that the absolute values of b and c remain more model-dependent than those of ω and ![Mathematical equation: $\[\bar{\theta}\]$](/articles/aa/full_html/2026/06/aa57890-25/aa57890-25-eq12.png) once the treatment of SHOE is varied; we therefore discuss them primarily in relative rather than absolute terms.
once the treatment of SHOE is varied; we therefore discuss them primarily in relative rather than absolute terms.
Given the median geometry (ik, ek, gk) and the median reflectance factor I/F per ROI-observation combination (Sect. 2), the likelihood assumes independent Gaussian residuals with uncertainty σk, which is taken as the within-ROI standard deviation of I/F for that image.
![Mathematical equation: $\[\chi_\nu^2=\frac{1}{\nu} \sum_{k=1}^N \frac{\left[(I / F)_k^{\mathrm{obs}}-(I / F)_k^{\bmod }(\mathbf{m})\right]^2}{\sigma_k^2}, \quad \nu=N-n_{\mathrm{par}}.\]$](/articles/aa/full_html/2026/06/aa57890-25/aa57890-25-eq13.png) (4)
(4)
We also report the root-mean-square error (RMSE) and its relative counterpart, the relative root-mean-square error (RRMSE):
![Mathematical equation: $\[\mathrm{RMSE}=\sqrt{\frac{1}{N} \sum_{k=1}^N\left[(I / F)_k^{\mathrm{obs}}-(I / F)_k^{\mathrm{mod}}(\mathbf{m})\right]^2},\]$](/articles/aa/full_html/2026/06/aa57890-25/aa57890-25-eq14.png) (5)
(5)
and
![Mathematical equation: $\[\mathrm{RRMSE}=\sqrt{\frac{1}{N} \sum_{k=1}^N\left[\frac{(I / F)_k^{\mathrm{obs}}-(I / F)_k^{\mathrm{mod}}(\mathbf{m})}{(I / F)_k^{\mathrm{obs}}}\right]^2}.\]$](/articles/aa/full_html/2026/06/aa57890-25/aa57890-25-eq15.png) (6)
(6)
Performance is considered very good if the RRMSE is less than 10%, good if it is between 10% and 20%, fair if it is between 20% and 30%, and poor if it is greater than 30%. With limited opposition coverage, trade-offs persist among ω, (b, c), ![Mathematical equation: $\[\bar{\theta}\]$](/articles/aa/full_html/2026/06/aa57890-25/aa57890-25-eq16.png) , and any explicit SHOE term. Reporting full posterior distributions (including parameter covariances) therefore mitigates the over-interpretation of single best-fit values. In the next section, we emphasize median estimates, compact posterior widths, and robust terrain ordering; Appendix A then evaluates the sensitivity of these inferences to the treatment of SHOE.
, and any explicit SHOE term. Reporting full posterior distributions (including parameter covariances) therefore mitigates the over-interpretation of single best-fit values. In the next section, we emphasize median estimates, compact posterior widths, and robust terrain ordering; Appendix A then evaluates the sensitivity of these inferences to the treatment of SHOE.
The same four-parameter Hapke formulation and Bayesian philosophy were previously tested on terrestrial multi-angle Pléiades data over the Asal–Ghoubbet rift, where the retrieved parameters could be compared with field measurements, laboratory spectra, and multi-scale topographic roughness constraints (Nguyen et al. 2025).
Goodness-of-fit metrics for our reference four-parameter Hapke model by subregion.
4 Results
Rather than considering each parameter independently, we emphasize systematic shifts between geomorphological units. Changes in ω primarily reflect albedo contrasts linked to surface maturity or fine-fraction abundance, while shifts in (b, c) describe the effective single-particle scattering behavior within the adopted baseline model, and variations in ![Mathematical equation: $\[\bar{\theta}\]$](/articles/aa/full_html/2026/06/aa57890-25/aa57890-25-eq19.png) reflect differences in unresolved surface structure. The results below are therefore organized to highlight the contrasts that remain robust across model configurations. There is generally good agreement between the model and the data at both sites (Fig. 3; Table 1). The main exception remains the “opposite side” unit in Cornelia, where the fit is degraded by poorer image quality and by a geometry dominated by comparatively large incidence angles.
reflect differences in unresolved surface structure. The results below are therefore organized to highlight the contrasts that remain robust across model configurations. There is generally good agreement between the model and the data at both sites (Fig. 3; Table 1). The main exception remains the “opposite side” unit in Cornelia, where the fit is degraded by poorer image quality and by a geometry dominated by comparatively large incidence angles.
At Cornelia, the single-scattering albedo (ω), photometric roughness (![Mathematical equation: $\[\bar{\theta}\]$](/articles/aa/full_html/2026/06/aa57890-25/aa57890-25-eq20.png) ), and Hapke asymmetry parameter (b) exhibit well-peaked posterior distributions (Fig. 4). In the baseline inversion, the backscattering parameter (c) often accumulates near the upper sampling boundary (c → 1), showing that the model prefers strong backscattering within the adopted HG2 parameterization but does not determine its absolute magnitude tightly. Appendix A shows that this behavior is sensitive to the SHOE prescription, whereas the relative albedo ordering is much more stable. At Matronalia Rupes (Fig. 4), most parameters exhibit well-defined peaks. An exception is the photometric roughness parameter in the cliff slope, which remains weakly constrained because the angular range is narrow.
), and Hapke asymmetry parameter (b) exhibit well-peaked posterior distributions (Fig. 4). In the baseline inversion, the backscattering parameter (c) often accumulates near the upper sampling boundary (c → 1), showing that the model prefers strong backscattering within the adopted HG2 parameterization but does not determine its absolute magnitude tightly. Appendix A shows that this behavior is sensitive to the SHOE prescription, whereas the relative albedo ordering is much more stable. At Matronalia Rupes (Fig. 4), most parameters exhibit well-defined peaks. An exception is the photometric roughness parameter in the cliff slope, which remains weakly constrained because the angular range is narrow.
The medians of the posterior point estimates are listed in Table 2. In Cornelia, the clearest and most robust separation is carried by ω: the avalanches are brighter than the crater floor, which is in turn brighter than the opposite wall. The four avalanches partly overlap within their posterior widths, so we do not emphasize a strict ranking among all of them. Avalanche a nevertheless trends toward lower ω and broader posteriors than avalanches b-d, which is consistent with partial mixing with darker floor material. Differences in ![Mathematical equation: $\[\bar{\theta}\]$](/articles/aa/full_html/2026/06/aa57890-25/aa57890-25-eq21.png) among the avalanches are weaker and should not be over-interpreted individually. At Matronalia, ω is highest for the ejecta, intermediate for the crater, and lowest for the cliff slope, which is consistent with a fresher ejecta blanket and a darker, more fine-depleted steep slope. The angular sampling of the cliff is limited, so the photometric roughness remains weakly constrained. The cliff also trends toward higher b and lower c than the crater and ejecta in the baseline inversion, but these phase-function contrasts are more model-dependent than the albedo contrasts.
among the avalanches are weaker and should not be over-interpreted individually. At Matronalia, ω is highest for the ejecta, intermediate for the crater, and lowest for the cliff slope, which is consistent with a fresher ejecta blanket and a darker, more fine-depleted steep slope. The angular sampling of the cliff is limited, so the photometric roughness remains weakly constrained. The cliff also trends toward higher b and lower c than the crater and ejecta in the baseline inversion, but these phase-function contrasts are more model-dependent than the albedo contrasts.
Regarding the HG2 parameters, the Cornelia avalanches and the Matronalia ejecta generally occupy lower-b, higher-c regions than the Matronalia cliff within the baseline inversion. However, Appendix A shows that the absolute positions in (b, c) space shift when the SHOE prescription is changed. We therefore used the HG2 parameters mainly as a relative clustering tool and refrained from making detailed compositional inferences based solely on their absolute values.
In summary, the parameter space is not randomly populated but structured: fresh, mobilized deposits consistently occupy the high-ω portion of parameter space, whereas older or fine-depleted slopes occupy lower-ω solutions. The finer details of the HG2 clustering depend more strongly on the opposition prescription, but the overall separation between bright fresh deposits and darker background terrains remains coherent across the tested configurations.
5 Discussion
We organize the discussion around three questions: which parameters are robust, what can be inferred from the (b, c) clustering, and how the local deposits compare with previous global photometric studies of Vesta. This structure separates the parts of the inversion that are stable across SHOE prescriptions from those that should be interpreted only in a relative and model-dependent sense.
5.1 Robust and model-dependent parts of the inversion
The most robust result is the ordering in single-scattering albedo, ω. At Cornelia, the avalanche deposits are systematically brighter than the crater floor and opposite wall, with avalanche a occupying an intermediate and broader posterior range consistent with partial mixing with darker floor material. At Matronalia, the ejecta has the highest ω, the small crater is intermediate, and the cliff slope is darkest. This ordering is visible directly in the I/F phase curves (Fig. 2) and is recovered by the Bayesian inversion (Fig. 4; Table 2). It is also preserved in the fixed-SHOE sensitivity tests reported in Appendix A. We therefore interpreted ω as the primary carrier of the relative freshness contrast.
This hierarchy of robustness is consistent with the field-constrained terrestrial benchmark of Nguyen et al. (2025), which showed that single-scattering albedo is generally the most robust Hapke parameter, while photometric roughness and phase-function parameters require scale-aware and surface-dependent interpretation.
The photometric roughness, ![Mathematical equation: $\[\bar{\theta}\]$](/articles/aa/full_html/2026/06/aa57890-25/aa57890-25-eq23.png) , is also informative, but it must be read as a local structural parameter rather than as a direct maturity indicator. In the Hapke model,
, is also informative, but it must be read as a local structural parameter rather than as a direct maturity indicator. In the Hapke model, ![Mathematical equation: $\[\bar{\theta}\]$](/articles/aa/full_html/2026/06/aa57890-25/aa57890-25-eq24.png) represents unresolved self-shadowing by slopes and facets at scales smaller than the pixel. It may therefore include contributions from blocky rubble, hummocky deposits, crater-wall relief, and imperfectly averaged sub-pixel topography. The Cornelia avalanches tend to have larger
represents unresolved self-shadowing by slopes and facets at scales smaller than the pixel. It may therefore include contributions from blocky rubble, hummocky deposits, crater-wall relief, and imperfectly averaged sub-pixel topography. The Cornelia avalanches tend to have larger ![Mathematical equation: $\[\bar{\theta}\]$](/articles/aa/full_html/2026/06/aa57890-25/aa57890-25-eq25.png) than the crater floor and opposite wall, which is consistent with rough mobilized deposits. At Matronalia, however, the cliff-slope
than the crater floor and opposite wall, which is consistent with rough mobilized deposits. At Matronalia, however, the cliff-slope ![Mathematical equation: $\[\bar{\theta}\]$](/articles/aa/full_html/2026/06/aa57890-25/aa57890-25-eq26.png) posterior is broad and weakly constrained because the angular coverage is limited. We therefore avoided interpreting all
posterior is broad and weakly constrained because the angular coverage is limited. We therefore avoided interpreting all ![Mathematical equation: $\[\bar{\theta}\]$](/articles/aa/full_html/2026/06/aa57890-25/aa57890-25-eq27.png) differences as a monotonic maturity sequence.
differences as a monotonic maturity sequence.
The HG2 phase-function parameters, b and c, are less robust in absolute value. The parameter b is commonly referred to as the Hapke asymmetry parameter; in the adopted HG2 formulation it primarily controls the width of the scattering lobes, whereas c controls the relative balance between backward and forward scattering. Because the baseline inversion does not explicitly fit SHOE, part of the low-phase-angle behavior can be absorbed by the HG2 term. Appendix A shows that the absolute (b, c) coordinates shift when SHOE is fixed to plausible literature-based prescriptions. We therefore interpreted b and c in a comparative sense: their clustering indicates differences in effective scattering regime among terrains, but their absolute values should not be converted directly into unique grain sizes, packing states, or lithologies.
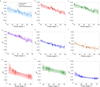 |
Fig. 3 Fit of our reference four-parameter Hapke model to the reflectance factor (I/F) as a function of the phase angle for the Cornelia subregions. Panels (a)–(f) depict Cornelia: the labeled avalanches (a–d), the crater floor (e), and the opposite wall (f). Panels (g)–(i) depict Matronalia: the small crater (g), the ejecta (h), and the cliff slope (i). |
Posterior medians and median absolute deviations for our reference four-parameter Hapke model, organized by subregion.
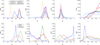 |
Fig. 4 Marginal posterior distributions for the Cornelia crater (top row) and Matronalia Rupes (bottom row). Each column corresponds to a different Hapke parameter: the single-scattering albedo (ω), the photometric roughness ( |
![Mathematical equation: $\[\bar{\theta}\]$](/articles/aa/full_html/2026/06/aa57890-25/aa57890-25-eq28.png)
5.2 Physical reading of the hockey-stick clustering
The hockey-stick relation between b and c (Fig. 5) is useful because it provides a laboratory-calibrated reference frame for single-particle scattering behavior (McGuire & Hapke 1995; Souchon et al. 2011; Hapke 2012a). Samples located along different parts of this diagram can be associated, albeit non-uniquely, with different particle-scale properties, such as grain-surface roughness, density of internal scatterers, agglomeration state, or more transparent and smoother particles. In this paper, however, the hockey-stick diagram is not used as a direct measurement of those properties. It is used to ask whether geomorphological units occupy coherent and physically interpretable regions of phase-function space.
Within the baseline inversion, the Cornelia avalanches cluster at low-to-moderate b and medium-to-high c. The crater floor and opposite wall overlap part of this domain, but they are clearly separated from the avalanches by their lower ω. This indicates that the distinction between the avalanches and the crater floor is driven primarily by brightness and maturity rather than by a uniquely resolved difference in particle scattering anisotropy. Avalanche a has broader posteriors and lower ω than avalanches b–d, which is consistent with ROI mixing and a more evolved or contaminated surface state.
At Matronalia, the ejecta is bright and lies closer to the low-b part of the diagram, whereas the cliff slope trends toward higher b and lower c in the baseline solution. This contrast is compatible with a fresh, optically bright ejecta blanket adjacent to a darker steep slope that may be more fine-depleted or more optically mature. Because this specific (b, c) separation shifts under fixed-SHOE assumptions, we do not claim a unique grain-scale interpretation. The key point is comparative: the bright mobilized or excavated deposits and the darker background terrains do not populate parameter space randomly; they separate first in ω, and secondarily in their effective HG2 clustering.
This interpretation also explains why Fig. 5 is retained despite the model dependence of b and c. The figure does not provide an independent proof of grain size or packing state. Instead, it shows that the Bayesian solutions fall within physically meaningful scattering regimes and that fresh deposits, older floor units, and cliff material can be compared within the same empirical framework. The figure therefore complements the posterior probability density functions (PDFs) by translating the phase-function parameters into a cautious physical language.
Space weathering on Vesta generally darkens and optically matures the regolith, lowering ω and likely modifying the phase function more subtly (e.g., Pieters et al. 2000; Noble et al. 2007; Hicks et al. 2014). In contrast, avalanches and impact-driven mass wasting expose fresher material and can modify unresolved structural roughness and effective phase-function parameters through mechanical sorting and surface roughening. Experimental and field observations suggest that, in granular flows, the largest clasts can preferentially travel farther downslope than finer material (Gray et al. 2015), producing a spatial organization of surface texture along the transport path.
Figure 6 shows a terrestrial field example of such downslope organization. In this framework, the photometric contrasts discussed below are interpreted as plausible signatures of emplacement-related segregation superimposed on progressive optical maturation, rather than as unique inversions of grain size or packing state.
5.3 Comparison with previous Hapke modeling of Vesta
Previous Hapke analyses of Vesta provide an essential reference, but they are not directly equivalent to the local inversions performed here. Li et al. (2013) reported global Dawn/FC photometric parameters using a Hapke formulation adapted to disk-resolved Vesta observations, while Hasegawa et al. (2014) used ground-based observations and emphasized the opposition effect. These studies constrain Vesta’s average photometric behavior over much larger spatial scales than the individual avalanche, crater-floor, ejecta, and cliff units considered here.
To facilitate comparison, Appendix B reports an equivalent three-parameter Hapke formulation using a one-term Henyey–Greenstein phase function, with the single-scattering albedo (ω), the photometric roughness (![Mathematical equation: $\[\bar{\theta}\]$](/articles/aa/full_html/2026/06/aa57890-25/aa57890-25-eq29.png) ), and the one-term Henyey–Greenstein asymmetry parameter (ξ). In that formulation, our local ROIs generally have higher ω and higher
), and the one-term Henyey–Greenstein asymmetry parameter (ξ). In that formulation, our local ROIs generally have higher ω and higher ![Mathematical equation: $\[\bar{\theta}\]$](/articles/aa/full_html/2026/06/aa57890-25/aa57890-25-eq30.png) than the published global values. The higher ω of the avalanches and ejecta is consistent with their interpretation as fresh or recently mobilized deposits. However, the larger
than the published global values. The higher ω of the avalanches and ejecta is consistent with their interpretation as fresh or recently mobilized deposits. However, the larger ![Mathematical equation: $\[\bar{\theta}\]$](/articles/aa/full_html/2026/06/aa57890-25/aa57890-25-eq31.png) values should not be attributed solely to youth. Our ROIs were deliberately selected on steep, morphologically structured terrains, including crater walls, avalanche deposits, ejecta, and scarps. They are therefore expected to contain more unresolved topographic roughness than a global-average surface, regardless of their exact exposure age.
values should not be attributed solely to youth. Our ROIs were deliberately selected on steep, morphologically structured terrains, including crater walls, avalanche deposits, ejecta, and scarps. They are therefore expected to contain more unresolved topographic roughness than a global-average surface, regardless of their exact exposure age.
This distinction is important for darker units. The Cornelia crater floor, the opposite wall, and the Matronalia cliff are not all young bright deposits, yet some of them still show local roughness values above the global Vesta averages. Their elevated ![Mathematical equation: $\[\bar{\theta}\]$](/articles/aa/full_html/2026/06/aa57890-25/aa57890-25-eq32.png) probably reflects the local geomorphic context and the spatial scale of the analysis, rather than a simple freshness effect. Conversely, their lower ω is more naturally interpreted as greater optical maturity, mixing with darker material, or a reduced fine fraction. The comparison with previous work therefore supports a two-level interpretation: albedo contrasts mainly record freshness, fine-fraction abundance, and maturation, whereas roughness contrasts also record local topographic and structural complexity.
probably reflects the local geomorphic context and the spatial scale of the analysis, rather than a simple freshness effect. Conversely, their lower ω is more naturally interpreted as greater optical maturity, mixing with darker material, or a reduced fine fraction. The comparison with previous work therefore supports a two-level interpretation: albedo contrasts mainly record freshness, fine-fraction abundance, and maturation, whereas roughness contrasts also record local topographic and structural complexity.
The asymmetry parameters obtained in the one-term HG comparison are broadly comparable to the global values of Li et al. (2013) and Hasegawa et al. (2014), except for the Matronalia cliff slope, which remains poorly constrained and more sensitive to geometry. This overlap suggests that the investigated units do not require a fundamentally different lithology from the average basaltic regolith of Vesta. The observed contrasts are more parsimoniously explained by local regolith reworking, granular segregation, exposure state, and structural roughness.
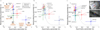 |
Fig. 5 “Hockey-stick” relation adapted from McGuire & Hapke (1995), Fernando et al. (2016), and Souchon et al. (2011) for all ROIs and for three inversion configurations: (a) the reference four-parameter inversion, (b) the six-parameter free-SHOE inversion, and (c) the fixed-SHOE inversion with (B0, h) = (1.59, 0.097), following the literature-based prescription of Li et al. (2013). Data points represent posterior medians, and error bars show median absolute deviations. The colors follow the ROI definitions in Fig. 1. |
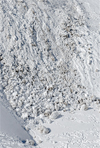 |
Fig. 6 Field photograph of a terrestrial avalanche deposit in the Vanoise massif, French Alps, acquired in March 2026. The image shows the surface texture and spatial organization of the deposit along the downslope transport direction. |
5.4 Cornelia and Matronalia as regolith-evolution sequences
At Cornelia, the most robust interpretation is a relative sequence between bright mobilized avalanches and darker background units. Avalanches b–d have high ω and relatively compact posteriors, consistent with fresh mobilized material. Avalanche a is less straightforward: its lower and broader ω posterior is consistent with mixing between bright slope deposits and darker floor material, as suggested by the ROI geometry. We therefore did not rank the four avalanches strictly by age from the photometry alone. Instead, we interpreted the avalanche group as fresher than the floor and opposite wall, while treating avalanche a as a mixed or more evolved case.
At Matronalia, the ejecta is the clearest fresh unit. Its high ω relative to the small crater and cliff slope is consistent with recently excavated or emplaced bright material. The cliff slope is darker and, in the baseline solution, occupies a distinct HG2 region with higher b and lower c. This could reflect a more fine-depleted steep surface, a smoother or more optically transparent grain population, or a more mature surface state. Because the angular coverage of the cliff is restricted and the HG2 coordinates are SHOE-dependent, this interpretation remains a plausible scenario rather than a unique diagnosis.
Taken together, the two sites support a mechanistic picture in which granular processes and optical maturation act together. Mass wasting and impact emplacement expose or concentrate bright material and can generate rough, heterogeneous surfaces through sorting of coarse clasts and fine matrix. Subsequent exposure, impact gardening, and surface stabilization darken the material and may smooth or infill unresolved roughness. This picture is consistent with granular-flow experiments and field observations showing downslope organization of particle sizes during emplacement (Gray et al. 2015), and with the expectation that space weathering on Vesta darkens and optically matures the regolith (e.g., Pieters et al. 2000; Noble et al. 2007; Hicks et al. 2014).
5.5 Limits of the interpretation
The main limitation is the available phase-angle range. Because most observations lie between approximately 10° and 70°, the opposition contribution cannot be identified uniquely. A free six-parameter SHOE inversion yields broad B0 and h posteriors, whereas fixed-SHOE inversions show that plausible opposition prescriptions shift the absolute HG2 coordinates. As a result, the paper’s conclusions deliberately rely on relative and robust quantities: the ordering in ω, the broad separation between fresh deposits and darker background units, and the persistence of that ordering under SHOE sensitivity tests.
Other limitations include ROI mixing, especially for Cornelia avalanche a; restricted incidence and viewing geometry for the Matronalia cliff; and the fact that a single photometric model cannot by itself separate grain size, packing, composition, and exposure age. Future work should therefore combine the present Bayesian photometric approach with pixel-scale parameter maps, boulder counts, spectral indicators such as pyroxene band depth and visible/near-IR slopes, and thermophysical constraints on roughness and thermal inertia (e.g., Ferrari & Lucas 2016; Ferrari et al. 2021).
In summary, the photometry supports a relative freshness ranking that complements morphological superposition. The Cornelia avalanches b–d and the Matronalia ejecta are the freshest deposits in the dataset; avalanche a and the Cornelia floor show evidence of mixing or greater exposure; and the Matronalia cliff is consistent with a darker, probably more fine-depleted or mature steep slope. The hockey-stick diagram provides a useful comparative framework for this interpretation, but the strongest evidence comes from the stability of the albedo ordering across the baseline and SHOE sensitivity tests.
6 Conclusion
We used a Bayesian inversion method to analyze bright units on Vesta using the Hapke photometric model. We focused on avalanches in the Cornelia crater and on a fresh ejecta blanket at Matronalia Rupes. Despite the lack of strong opposition coverage, our approach retrieved robust relative contrasts in single-scattering albedo (ω) and, where geometry allowed, photometric roughness (![Mathematical equation: $\[\bar{\theta}\]$](/articles/aa/full_html/2026/06/aa57890-25/aa57890-25-eq33.png) ). The brightest units at both sites are the freshest deposits identified morphologically, whereas the crater floor, opposite wall, and cliff slope are systematically darker. For Cornelia, fixed-SHOE sensitivity tests show that these relative contrasts remain stable, even though the absolute values of the HG2 phase-function parameters (b and c) depend more strongly on the adopted opposition prescription. Taken together, these patterns suggest that granular segregation during emplacement controls the brightest units, while optical maturation and surface stabilization best explain the darker counterparts.
). The brightest units at both sites are the freshest deposits identified morphologically, whereas the crater floor, opposite wall, and cliff slope are systematically darker. For Cornelia, fixed-SHOE sensitivity tests show that these relative contrasts remain stable, even though the absolute values of the HG2 phase-function parameters (b and c) depend more strongly on the adopted opposition prescription. Taken together, these patterns suggest that granular segregation during emplacement controls the brightest units, while optical maturation and surface stabilization best explain the darker counterparts.
Inference is constrained by the following: (i) the available phase-angle range is approximately 10° to 70°, which does not identify SHOE uniquely; (ii) trade-offs among ω, ![Mathematical equation: $\[\bar{\theta}\]$](/articles/aa/full_html/2026/06/aa57890-25/aa57890-25-eq34.png) , and the phase-function parameters; (iii) ROI mixing (e.g., avalanche a includes floor material); and (iv) restricted illumination and viewing geometry on the cliff, which yields broad posteriors for
, and the phase-function parameters; (iii) ROI mixing (e.g., avalanche a includes floor material); and (iv) restricted illumination and viewing geometry on the cliff, which yields broad posteriors for ![Mathematical equation: $\[\bar{\theta}\]$](/articles/aa/full_html/2026/06/aa57890-25/aa57890-25-eq35.png) . Therefore, we emphasize medians and credible intervals rather than single best-fit values. Several straightforward extensions could improve these inferences: (i) pixel-scale or sliding-window maps of ω and
. Therefore, we emphasize medians and credible intervals rather than single best-fit values. Several straightforward extensions could improve these inferences: (i) pixel-scale or sliding-window maps of ω and ![Mathematical equation: $\[\bar{\theta}\]$](/articles/aa/full_html/2026/06/aa57890-25/aa57890-25-eq36.png) to localize the low-roughness shoulder within avalanche a; (ii) a Bayesian hierarchical analysis across ROIs to quantify covariances among ω,
to localize the low-roughness shoulder within avalanche a; (ii) a Bayesian hierarchical analysis across ROIs to quantify covariances among ω, ![Mathematical equation: $\[\bar{\theta}\]$](/articles/aa/full_html/2026/06/aa57890-25/aa57890-25-eq37.png) , b, and c and relate them to predictors such as slope, run-out distance, or boulder density; (iii) joint photometry–thermophysics to break degeneracies, for example through thermal inertia–roughness coupling, and to extend constraints across wavelengths (e.g., Ferrari & Lucas 2016; Ferrari et al. 2021); (iv) colocated spectral diagnostics, such as visible/near-IR slopes and pyroxene band depths, to distinguish between segregation and weathering signatures; and (v) independent boulder counts from high-resolution FC images to test the geomorphic meaning of
, b, and c and relate them to predictors such as slope, run-out distance, or boulder density; (iii) joint photometry–thermophysics to break degeneracies, for example through thermal inertia–roughness coupling, and to extend constraints across wavelengths (e.g., Ferrari & Lucas 2016; Ferrari et al. 2021); (iv) colocated spectral diagnostics, such as visible/near-IR slopes and pyroxene band depths, to distinguish between segregation and weathering signatures; and (v) independent boulder counts from high-resolution FC images to test the geomorphic meaning of ![Mathematical equation: $\[\bar{\theta}\]$](/articles/aa/full_html/2026/06/aa57890-25/aa57890-25-eq38.png) .
.
This cautious interpretation is also grounded in the field-constrained terrestrial application of the same Hapke-inversion framework by Nguyen et al. (2025) to multi-angle Pléiades images of the Asal–Ghoubbet rift. Using independent field measurements, laboratory spectra, drone- and ground-based digital elevation models, and wavelet-based multi-scale roughness analyses, they showed that single-scattering albedo is the most robustly retrieved parameter, whereas photometric roughness and phase-function parameters require contextual and scale-aware interpretation. The Vesta results follow the same logic: Hapke parameters are most powerful when used as comparative diagnostics among geomorphological units, rather than as unique grain-scale measurements.
In summary, Bayesian inversion of the Hapke model provides a consistent “freshness ranking” that complements morphological superposition, even in the absence of direct opposition coverage. Cornelia avalanches b–d and the Matronalia ejecta are the freshest deposits in our dataset, whereas the Cornelia floor, opposite wall, and Matronalia cliff present darker and more evolved surface states. These results offer a transferable framework for interpreting regolith evolution on airless bodies while keeping explicit track of the model dependence introduced by opposition effects.
Acknowledgements
The authors would like to thank S. Labarre and F. Romand for their initial contributions to this work. They are also grateful to S. Rodriguez for his helpful discussions. We thank the anonymous referee for constructive comments that helped improve the manuscript. This research was supported by CNES and LabEx UnivEarthS of Université Paris Cité (ANR-10-LABX-0023 and ANR-18-IDEX-0001).
References
- Blanco, C., & Catalano, S. 1979, Icarus, 40, 359 [Google Scholar]
- Domingue, D., Robinson, M., Carcich, B., et al. 2002, Icarus, 155, 205 [Google Scholar]
- Fernando, J., Schmidt, F., & Douté, S. 2016, Planet. Space Sci., 128, 30 [Google Scholar]
- Ferrari, C., & Lucas, A. 2016, A&A, 588, A133 [NASA ADS] [CrossRef] [EDP Sciences] [Google Scholar]
- Ferrari, C., Lucas, A., & Jacquemoud, S. 2021, A&A, 655, A8 [NASA ADS] [CrossRef] [EDP Sciences] [Google Scholar]
- Gray, J. M. N. T., Gajjar, P., & Kokelaar, P. 2015, Comptes Rendus. Physique, 16, 73 [Google Scholar]
- Hapke, B. 1984, Icarus, 59, 41 [Google Scholar]
- Hapke, B. 2012a, Icarus, 221, 1079 [NASA ADS] [CrossRef] [Google Scholar]
- Hapke, B. 2012b, Theory of Reflectance and Emittance Spectroscopy (Cambridge University Press) [Google Scholar]
- Hasegawa, S., et al. 2014, PASJ, 66, 89 [Google Scholar]
- Helfenstein, P., & Veverka, J. 1987, Icarus, 72, 342 [NASA ADS] [CrossRef] [Google Scholar]
- Hicks, M. D., Buratti, B. J., Lawrence, K. J., et al. 2014, Icarus, 235, 60 [NASA ADS] [CrossRef] [Google Scholar]
- Jaumann, R., Williams, D. A., Buczkowski, D. L., et al. 2012, Science, 336, 687 [Google Scholar]
- Kaasalainen, M., Torppa, J., & Muinonen, K. 2001, Icarus, 153, 37 [NASA ADS] [CrossRef] [Google Scholar]
- Kovács, G., Nathues, A., Sierks, H., et al. 2024, Space Sci. Rev., 220 [Google Scholar]
- Krohn, K., Jaumann, R., Otto, K., et al. 2014, Icarus, 244, 120 [Google Scholar]
- Kugler, B., Forbes, F., & Douté, S. 2022, Statist. Comput., 32, 31 [Google Scholar]
- Le Bertre, T., & Zellner, B. 1980, Icarus, 41, 406 [Google Scholar]
- Li, J.-Y., Le Corre, L., Schröder, S., et al. 2013, Icarus, 226, 1252 [CrossRef] [Google Scholar]
- McGuire, A. F., & Hapke, B. W. 1995, Icarus, 113, 134 [NASA ADS] [CrossRef] [Google Scholar]
- Nguyen, D., Jacquemoud, S., Lucas, A., et al. 2025, Remote Sens. Environ., 322, 114691 [Google Scholar]
- Noble, S. K., Pieters, C. M., & Keller, L. P. 2007, Icarus, 192, 629 [CrossRef] [Google Scholar]
- Parekh, R., Otto, K. A., Jaumann, R., et al. 2021, J. Geophys. Res. Planets, 126, e2020JE006573 [Google Scholar]
- Pieters, C. M., Taylor, L. A., Noble, S. K., et al. 2000, Meteor. Planet. Sci., 35, 1101 [NASA ADS] [CrossRef] [Google Scholar]
- Preusker, F., Scholten, F., Matz, K.-D., et al. 2014, Vesta in the light of Dawn: First exploration of a protoplanet in the asteroid belt, LPI Contribution No. 1773, 56 [Google Scholar]
- Reddy, V., Nathues, A., Le Corre, L., et al. 2012, Icarus, 217, 153 [NASA ADS] [CrossRef] [Google Scholar]
- Schröder, S., & Gutiérrez-Marqués, P. 2013, MPS report, DA-FC-MPAE-RP-272, 17 [Google Scholar]
- Schröder, S., Mottola, S., Keller, H., Raymond, C., & Russell, C. 2013, Planet. Space Sci., 85, 198 [Google Scholar]
- Schröder, S. E., Li, J.-Y., Rayman, M. D., et al. 2018, A&A, 620, A201 [NASA ADS] [CrossRef] [EDP Sciences] [Google Scholar]
- Shkuratov, Y., Kaydash, V., Korokhin, V., et al. 2011, Planet. Space Sci., 59, 1326 [Google Scholar]
- Souchon, A., Pinet, P., Chevrel, S., et al. 2011, Icarus, 215, 313 [NASA ADS] [CrossRef] [Google Scholar]
- Williams, D. A., Yingst, R. A., & Garry, W. B. 2014, Icarus, 244, 1 [Google Scholar]
Appendix A SHOE sensitivity analysis
To assess identifiability, we first repeated the inversions while keeping CBOE inactive and including the SHOE amplitude and width as free parameters, i.e., {ω, ![Mathematical equation: $\[\bar{\theta}\]$](/articles/aa/full_html/2026/06/aa57890-25/aa57890-25-eq39.png) , b, c, B0, h}. Due to the limited phase-angle range (~10°-70°), the posterior distributions for B0 and h are broad and often dominated by the prior distribution. This free-SHOE experiment is therefore useful mainly as a demonstration of non-identifiability rather than as a preferred physical solution.
, b, c, B0, h}. Due to the limited phase-angle range (~10°-70°), the posterior distributions for B0 and h are broad and often dominated by the prior distribution. This free-SHOE experiment is therefore useful mainly as a demonstration of non-identifiability rather than as a preferred physical solution.
The free-SHOE posteriors remain compatible with the baseline interpretation but confirm that the opposition parameters themselves are not identified. In particular, the broad B0 and h distributions show that a free six-parameter inversion cannot determine whether the low-phase-angle behavior should be assigned to SHOE or partly absorbed by the HG2 term. When SHOE is included explicitly, irrespective of whether B0 and h are sampled or fixed, Eq. (2) becomes
![Mathematical equation: $\[\begin{aligned}\frac{I}{F}(i, e, g)= & \frac{\omega}{4 \mu_0} \frac{\mu_{0 e}}{\mu_{0 e}+\mu_e} \\& \times\left[\left(1+B_{\mathrm{SH}}(g)\right) p(g, b, c)+H\left(\mu_{0 e}\right) H\left(\mu_e\right)-1\right] \\& \times S(i, e, g, \bar{\theta}),\end{aligned}\]$](/articles/aa/full_html/2026/06/aa57890-25/aa57890-25-eq40.png) (A.1)
(A.1)
with
![Mathematical equation: $\[B_{\mathrm{SH}}(g)=\frac{B_0}{1+\frac{1}{h} ~\tan (g / 2)},\]$](/articles/aa/full_html/2026/06/aa57890-25/aa57890-25-eq41.png) (A.2)
(A.2)
while CBOE remains inactive. We then performed complementary sensitivity tests in which SHOE was not fitted freely but fixed to three literature-based prescriptions spanning the range explored in previous Vesta studies, including Li et al. (2013) and Hasegawa et al. (2014): (B0, h) = (1.03, 0.04), (1.59, 0.097), and (2.6, 0.12). These fixed-SHOE inversions are not treated as uniquely preferred solutions.
Instead, they provide physically motivated regularizations that test whether the main geomorphological conclusions depend on the opposition prescription. The numerical summaries for the three inversion configurations are reported in Table A.1. The marginal posteriors for the free-SHOE and representative fixed-SHOE cases are shown in Figs. A.1 and A.2, respectively, and the corresponding fits are shown in Figs. A.3 and A.4. The fixed-SHOE figures and table report the representative (B0, h) = (1.59, 0.097) case, while the two other fixed-SHOE prescriptions were checked qualitatively.
For Cornelia, all three fixed-SHOE prescriptions leave the fit quality nearly unchanged and preserve the same terrain ordering in ω and ![Mathematical equation: $\[\bar{\theta}\]$](/articles/aa/full_html/2026/06/aa57890-25/aa57890-25-eq42.png) . The avalanches remain brighter than the crater floor and opposite wall, and avalanche a remains broader and slightly less bright than avalanches b–d. By contrast, the absolute values of b and c shift from one SHOE prescription to another. This behavior is expected because, over the available phase-angle range, part of the low-phase-angle curvature can be partitioned either into SHOE or into the HG2 phase function. The practical implication is that the relative albedo contrasts and the freshness ranking are robust, whereas the exact HG2 coordinates remain prescription-dependent.
. The avalanches remain brighter than the crater floor and opposite wall, and avalanche a remains broader and slightly less bright than avalanches b–d. By contrast, the absolute values of b and c shift from one SHOE prescription to another. This behavior is expected because, over the available phase-angle range, part of the low-phase-angle curvature can be partitioned either into SHOE or into the HG2 phase function. The practical implication is that the relative albedo contrasts and the freshness ranking are robust, whereas the exact HG2 coordinates remain prescription-dependent.
Figure 2 shows that the Cornelia dataset includes a few observations at small phase angles (3° < g < 20°), for which SHOE may still contribute. Taken together, the free- and fixed-SHOE tests therefore support the same conclusion: the present data do not justify neglecting SHOE as a physical process, but they do show that the principal geomorphological contrasts discussed in the paper do not depend strongly on which reasonable SHOE prescription is adopted.
Posterior medians and median absolute deviations for the three Hapke inversion configurations.
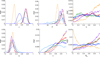 |
Fig. A.1 Marginal posteriors for the six-parameter free-SHOE Hapke model (Cornelia avalanches and slopes). The legend is the same as in Fig. 4. The opposition parameters (B0, h) are weakly constrained, while the other four parameters remain stable relative to the baseline inversion. |
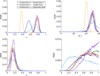 |
Fig. A.2 Marginal posteriors for the fixed-SHOE Hapke model with (B0, h) = (1.59, 0.097) for the Cornelia avalanches, crater floor, and opposite side. The legend is the same as in Fig. 4. |
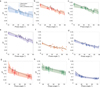 |
Fig. A.3 Fit of our free-SHOE Hapke model to the reflectance factor (I/F) as a function of the phase angle for the Cornelia (panels a–f) and Matronalia (g–i) subregions. Panels (a)-(d): Labeled avalanches. Panel (e): Crater floor. Panel (f): Opposite wall. Panel (g): Small crater. Panel (h): Ejecta. Panel (i): Cliff slope. |
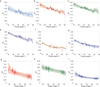 |
Fig. A.4 Fit of our fixed-SHOE Hapke model to the reflectance factor (I/F) as a function of the phase angle for the Cornelia (panels a–f) and Matronalia (g–i) subregions. Panels (a)-(d): Labeled avalanches. Panel (e): Crater floor. Panel (f): Opposite wall. Panel (g): Small crater. Panel (h): Ejecta. Panel (i): Cliff slope. |
Appendix B Comparison with the literature
Previous Hapke studies of Vesta used model formulations, wavelengths, and spatial averaging scales that differ from those adopted in our four-parameter inversion. We therefore provide here an auxiliary comparison using a three-parameter formulation that contains the single-scattering albedo (ω), the photometric roughness (![Mathematical equation: $\[\bar{\theta}\]$](/articles/aa/full_html/2026/06/aa57890-25/aa57890-25-eq44.png) ), and the asymmetry parameter of the one-parameter Henyey-Greenstein phase function (ξ). This comparison is not used as the primary inversion result, but it helps relate the local ROIs analyzed in this work to published global values for Vesta. The three-parameter inversion is not used as an additional SHOE-sensitivity test. Its purpose is to provide a direct comparison with previous global Hapke studies of Vesta that reported a one-term Henyey-Greenstein asymmetry parameter. The resulting three-parameter values are reported in Table B.1.
), and the asymmetry parameter of the one-parameter Henyey-Greenstein phase function (ξ). This comparison is not used as the primary inversion result, but it helps relate the local ROIs analyzed in this work to published global values for Vesta. The three-parameter inversion is not used as an additional SHOE-sensitivity test. Its purpose is to provide a direct comparison with previous global Hapke studies of Vesta that reported a one-term Henyey-Greenstein asymmetry parameter. The resulting three-parameter values are reported in Table B.1.
Three-parameter one-term Henyey–Greenstein Hapke inversion used for comparison with previous global Vesta studies.
Most of the local ROIs have higher ω than the global values, especially the Cornelia avalanches and the Matronalia ejecta. This is consistent with the interpretation that these units expose or concentrate fresher, optically brighter material. The comparison is less direct for ![Mathematical equation: $\[\bar{\theta}\]$](/articles/aa/full_html/2026/06/aa57890-25/aa57890-25-eq46.png) . The local roughness values are generally larger than the global values, but this difference should not be attributed only to younger surface age. The ROIs in this work were selected on steep, morphologically structured terrains, whereas the literature values represent global or disk-averaged behavior. Elevated
. The local roughness values are generally larger than the global values, but this difference should not be attributed only to younger surface age. The ROIs in this work were selected on steep, morphologically structured terrains, whereas the literature values represent global or disk-averaged behavior. Elevated ![Mathematical equation: $\[\bar{\theta}\]$](/articles/aa/full_html/2026/06/aa57890-25/aa57890-25-eq47.png) in darker units such as the Cornelia floor or opposite wall can therefore reflect local structural roughness and unresolved topography, not only freshness.
in darker units such as the Cornelia floor or opposite wall can therefore reflect local structural roughness and unresolved topography, not only freshness.
The one-term HG asymmetry parameter ξ is broadly similar to the published global values for most units. This supports the view that the investigated terrains are not compositionally exotic relative to Vesta’s basaltic regolith. The main contrasts discussed in the paper are therefore more naturally explained by regolith reworking, granular segregation, exposure state, and local structural roughness than by a change in fundamental lithology. The Matronalia cliff remains an exception with a more extreme ξ, but this unit also has restricted angular coverage and a weakly constrained roughness posterior in the main inversion.
All Tables
Goodness-of-fit metrics for our reference four-parameter Hapke model by subregion.
Posterior medians and median absolute deviations for our reference four-parameter Hapke model, organized by subregion.
Posterior medians and median absolute deviations for the three Hapke inversion configurations.
Three-parameter one-term Henyey–Greenstein Hapke inversion used for comparison with previous global Vesta studies.
All Figures
|
Fig. 1 Targets and photometric subregions in Dawn/FC panchromatic imagery for the Cornelia crater (top row) and the Matronalia Rupes (bottom row). Top left: context image with a mean GSD of ~20 m. Top center: delimitation of the four avalanches. Top right: Crater floor (dark blue), including the protuberance below avalanche a, and the opposite wall unit (in orange). Bottom left: context image with a mean GSD of ~250 m. Bottom right: small crater (red), ejecta (green), and scarp slope (blue). The panels use clear-filter FC mosaics re-projected onto the stereo DTM of Preusker et al. (2014); these products provide the geomorphological framework used to define the ROIs. |
| In the text | |
|
Fig. 2 Reflectance factor (I/F) for the Cornelia (top) and Matronalia Rupes (bottom) subregions as a function of incidence, emission, and phase geometry. The error bars represent the standard deviation within each ROI. Angles are computed relative to the local surface derived from the DTM. |
| In the text | |
|
Fig. 3 Fit of our reference four-parameter Hapke model to the reflectance factor (I/F) as a function of the phase angle for the Cornelia subregions. Panels (a)–(f) depict Cornelia: the labeled avalanches (a–d), the crater floor (e), and the opposite wall (f). Panels (g)–(i) depict Matronalia: the small crater (g), the ejecta (h), and the cliff slope (i). |
| In the text | |
|
Fig. 4 Marginal posterior distributions for the Cornelia crater (top row) and Matronalia Rupes (bottom row). Each column corresponds to a different Hapke parameter: the single-scattering albedo (ω), the photometric roughness ( |
| In the text | |
|
Fig. 5 “Hockey-stick” relation adapted from McGuire & Hapke (1995), Fernando et al. (2016), and Souchon et al. (2011) for all ROIs and for three inversion configurations: (a) the reference four-parameter inversion, (b) the six-parameter free-SHOE inversion, and (c) the fixed-SHOE inversion with (B0, h) = (1.59, 0.097), following the literature-based prescription of Li et al. (2013). Data points represent posterior medians, and error bars show median absolute deviations. The colors follow the ROI definitions in Fig. 1. |
| In the text | |
|
Fig. 6 Field photograph of a terrestrial avalanche deposit in the Vanoise massif, French Alps, acquired in March 2026. The image shows the surface texture and spatial organization of the deposit along the downslope transport direction. |
| In the text | |
|
Fig. A.1 Marginal posteriors for the six-parameter free-SHOE Hapke model (Cornelia avalanches and slopes). The legend is the same as in Fig. 4. The opposition parameters (B0, h) are weakly constrained, while the other four parameters remain stable relative to the baseline inversion. |
| In the text | |
|
Fig. A.2 Marginal posteriors for the fixed-SHOE Hapke model with (B0, h) = (1.59, 0.097) for the Cornelia avalanches, crater floor, and opposite side. The legend is the same as in Fig. 4. |
| In the text | |
|
Fig. A.3 Fit of our free-SHOE Hapke model to the reflectance factor (I/F) as a function of the phase angle for the Cornelia (panels a–f) and Matronalia (g–i) subregions. Panels (a)-(d): Labeled avalanches. Panel (e): Crater floor. Panel (f): Opposite wall. Panel (g): Small crater. Panel (h): Ejecta. Panel (i): Cliff slope. |
| In the text | |
|
Fig. A.4 Fit of our fixed-SHOE Hapke model to the reflectance factor (I/F) as a function of the phase angle for the Cornelia (panels a–f) and Matronalia (g–i) subregions. Panels (a)-(d): Labeled avalanches. Panel (e): Crater floor. Panel (f): Opposite wall. Panel (g): Small crater. Panel (h): Ejecta. Panel (i): Cliff slope. |
| In the text | |
Current usage metrics show cumulative count of Article Views (full-text article views including HTML views, PDF and ePub downloads, according to the available data) and Abstracts Views on Vision4Press platform.
Data correspond to usage on the plateform after 2015. The current usage metrics is available 48-96 hours after online publication and is updated daily on week days.
Initial download of the metrics may take a while.