| Issue |
A&A
Volume 692, December 2024
|
|
|---|---|---|
| Article Number | A134 | |
| Number of page(s) | 10 | |
| Section | Astrophysical processes | |
| DOI | https://doi.org/10.1051/0004-6361/202451450 | |
| Published online | 05 December 2024 | |
Helium features are inconsistent with the spectral evolution of the kilonova AT2017gfo
1
Cosmic Dawn Center (DAWN), Copenhagen, Denmark
2
Niels Bohr Institute, University of Copenhagen, Jagtvej 128, DK-2200 Copenhagen N, Denmark
3
School of Physics, Trinity College Dublin, College Green, Dublin 2, Ireland
4
GSI Helmholtzzentrum für Schwerionenforschung, Planckstraße 1, 64291 Darmstadt, Germany
5
School of Mathematics and Physics, Astrophysics Research Centre, Queen’s University Belfast, Belfast, United Kingdom
⋆ Corresponding author; This email address is being protected from spambots. You need JavaScript enabled to view it.
Received:
10
July
2024
Accepted:
10
October
2024
Abstract
The spectral features observed in kilonovae have revealed the elemental composition and the velocity structures of matter ejected from neutron star mergers. In the spectra of the kilonova AT2017gfo, a P Cygni line at about 1 μm has been linked to Sr II, providing the first direct evidence of freshly synthesised r-process material. An alternative interpretation of this feature has been proposed – He Iλ1083.3 nm under certain non-local thermodynamic equilibrium conditions. A key way to robustly discriminate between these identifications, and indeed other proposed identifications, is to analyse the temporal emergence and evolution of the feature. In this analysis, we trace the earliest appearance of the observed feature and detail its spectro-temporal evolution, which we compare with a collisional-radiative model of helium. We show that the 1 μm P Cygni line is inconsistent with a He I interpretation both in emergence time and in subsequent spectral evolution. Self-consistent helium masses cannot reproduce the observed feature due to the diminishing strength of radiative pathways out of triplet helium.
Key words: line: formation / line: identification / line: profiles / nuclear reactions / nucleosynthesis / abundances / radiation mechanisms: non-thermal / radiation mechanisms: thermal
© The Authors 2024
 Open Access article, published by EDP Sciences, under the terms of the Creative Commons Attribution License (https://creativecommons.org/licenses/by/4.0), which permits unrestricted use, distribution, and reproduction in any medium, provided the original work is properly cited.
This article is published in open access under the Subscribe to Open model. This email address is being protected from spambots. You need JavaScript enabled to view it. to support open access publication.
1. Introduction
Observations of the gravitational-wave detected kilonova (KN) GW 170817/AT2017gfo (Abbott et al. 2017; Coulter et al. 2017) revealed the first spectroscopic identification of freshly synthesised r-process material in binary neutron star (BNS) mergers (Watson et al. 2019). Notably, studying r-process features not only constrains the KN elemental abundances (e.g. Gillanders et al. 2022; Vieira et al. 2024) but also places detailed constraints on the geometry and velocity structures of the ejecta (Sneppen et al. 2023a).
Specifically, the r-process species with the strongest known individual transitions (e.g. elements from the left side of the periodic table with low-lying energy levels and small partition functions, see Watson et al. 2019; Domoto et al. 2022) produce the most prominent absorption, emission, or P Cygni features on the KN continuum in the photospheric epochs. The first of such features to be robustly established, a P Cygni feature at 700–1200 nm (Pian et al. 2017; Smartt et al. 2017), was interpreted as being due to Sr II – which was first identified by Watson et al. (2019) and later corroborated with additional radiative transfer modelling (Domoto et al. 2022; Gillanders et al. 2022; Vieira et al. 2023; Shingles et al. 2023) and in non-local thermodynamic equilibrium (NLTE) models (Pognan et al. 2023). The strontium mass required to produce the feature is compatible with that produced in the dynamical ejecta from merger simulations (Perego et al. 2022). Independent evidence for the Sr II identification is that strong UV absorption is observed at λ ≤ 400 nm around 1.4 days after merger, which could be explained by lines from co-produced elements, including Y II (Gillanders et al. 2022) and Y II and Zr II (Vieira et al. 2023). Further corroboration of the Sr II interpretation comes from the existence of a 760 nm P Cygni feature, interpreted as being due to multiple lines from Y II (Sneppen & Watson 2023) and the timing of reverberation recombination-waves moving across the ejecta (Sneppen et al. 2024a). For completeness, we also note that second r-process peak elements have been suggested (viz. La III and Ce III) in order to explain near-infrared (NIR) features at intermediate times (Domoto et al. 2022). It is worth noting that the observed spectral features are from r-process species and can be well explained by assuming LTE conditions at the observed black-body temperature (Sneppen et al. 2024a). However, non-thermal particles produced in the radioactive decay of the r-process nucleosynthesis could allow for ionisation states and energy levels outside the LTE limit.
Indeed, an alternative interpretation for the 1.0 μm P Cygni feature has been proposed, namely that it could originate from the neutral He Iλ1083.3 nm line (1s2s 3S–1s2p 3P transition), which in certain NLTE conditions can produce a feature at a similar wavelength (see discussions in Perego et al. 2022; Tarumi et al. 2023), while Sr II may potentially be ionised away by a population of non-thermal electrons from radioactive heating. As the spectrum becomes nebular towards later epochs, after t ≳ 5 days post merger, NLTE ionisation modelling should become important (Pognan et al. 2022), and several features (which would be negligible in LTE conditions) have been suggested for these epochs, including Rb I (Pognan et al. 2023) and Te III (Gillanders et al. 2023; Hotokezaka et al. 2023). Nevertheless, the validity of LTE, alongside the transition point to when NLTE modelling is required, has so far been difficult to determine. In this context, helium is a particularly interesting species to consider, as it requires NLTE conditions and the required atomic data is largely known and has been applied in many supernova studies (e.g. Lucy 1991).
In this paper, we therefore revisit NLTE helium proposition to determine if the observed feature can be self-consistently modelled by He I under NLTE in the early epochs of AT2017gfo (from 0.92–4.4 days post merger). In Sect. 2, we briefly summarise the observed evolution of the observed 1 μm feature in the early epochs. In Sect. 3, we discuss the assumptions required to produce an observable He Iλ1083.3 nm feature. In Sect. 4, we enumerate the various relevant transitions between states and implement a collisional-radiative model for helium. In Sect. 5, we summarise the predicted evolution of a helium feature and show that the modelled evolution is inconsistent with AT2017gfo’s spectral series. Lastly, in Sect. 6, we discuss the broader implications this reveals on the radioactive ionisation and the validity of LTE ionisation in the ejecta.
2. The observed evolution of the 1 μm feature
To provide the strongest constraints for modelling the 1 μm feature, we examine the first appearance and subsequent evolution of the feature. In Sneppen et al. (2024a), we have compiled the early spectra of AT2017gfo from Magellan, ANU, SALT, VLT/X-shooter, and Gemini in order to provide a higher cadence analysis at early times than any individual data series provides (see Fig. 1). This revealed that the first detected appearance of the 1 μm P Cygni feature is from SALT (1.17 days post merger, Buckley et al. 2018), with an absorption component at around 800 nm. The spectrum taken six hours earlier from ANU (0.92 days post merger, Andreoni et al. 2017) displays no clear deviation from an underlying black-body continuum. Notably, the flux calibration of the ANU spectral energy distribution (SED) is somewhat uncertain, so the exact black-body temperature is not strongly constrained from the spectral slope (Sneppen et al. 2024a). However, this does not strongly affect the non-detection of a 1 μm feature in absorption, as this would generate a distinct spectral break in the middle of the spectrograph (similar to the SALT spectrum). Thus, the feature emerges rapidly over a relatively short timescale of a few hours. From 1.4 days post merger, AT2017gfo was monitored at a nightly cadence with the X-shooter spectrograph mounted on the European Southern Observatory’s Very Large Telescope (Pian et al. 2017; Smartt et al. 2017). The spectral range (330–2250 nm) has provided the first broad spectral coverage encompassing the near-infrared (NIR) emission peak of the 1 μm P Cygni feature. At 1.43 days, this feature had not yet formed in emission, but over the subsequent hour the feature formed in emission as well as absorption producing a full P Cygni profile (Sneppen et al. 2024a). If the feature was due to strontium, this would be due to light travel time delay and reverberation effects, where the more distant ejecta (where less time has passed post merger) has not yet cooled sufficiently to recombine with Sr II (Sneppen et al. 2024b). In contrast, as we show in this analysis, a helium feature will not produce such a rapid emergence and therefore not be sensitive to reverberation effects to the same extent. Towards the later spectra, the characteristic velocities decrease as the photosphere recedes deeper into the ejecta, and the optical depth of the absorption decreases. Post five days, the feature becomes more emission dominated – a result that would be produced by reverberation effects (see Sneppen et al. 2024b) but that may also have a contribution from the decreasing densities reducing the optical depth in the line(s) and allowing radiative de-excitation to form pure emission features (see Gillanders et al. 2023). In summary, the observed 1 μm feature is not detected at 0.92 days, indicating it is optically thin. It is marginally optically thick from 1.17-day to 3.4-day spectra and then becomes (increasingly) optically thin from the 4.4-day spectrum and onwards.
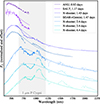 |
Fig. 1. Evolution of the 1 μm P Cygni feature over the first five days post merger from the unified spectral compilation (Sneppen et al. 2024a). The spectra were taken post merger plus 0.92 day (ANU, Andreoni et al. 2017), 1.17 day (SALT, Buckley et al. 2018), 1.47 day (SOAR and Gemini-south, Nicholl et al. 2017; Chornock et al. 2017) 1.43, 2.4, 3.4, and 4.4 day (X-shooter, Pian et al. 2017; Smartt et al. 2017). The spectra prior to one day contain no strong deviation from the black-body continuum (see also Shappee et al. 2017). However, between 0.92 and 1.17 days, strong absorption appears, while an emission feature begins to emerge with a delay of around ten hours after this (1.43–1.47 days). We note that these are the predicted emergence time framess for both absorption and emission for a feature produced by LTE Sr II due to a recombination wave passing through the ejecta (Sneppen et al. 2024b). We show in this analysis that this emergence is inconsistent with a He Iλ1083.0 nm interpretation of the feature. |
The underlying continuum is well described as a Planck function, B(λ, T), with the temperature, T, at wavelength λ emitting from a sharply defined photosphere. At early times, a black body provides excellent fits to the data with percent-level consistency in the required temperature from the UV through the NIR (Sneppen 2023). Towards the later photospheric epochs (see Fig. 1), NIR emission features emerge at 1.6 and 2.0 μm, which if not modelled will bias a simple best-fit black body towards lower temperatures than inferred from the UV side. As the object is dramatically cooling in early epochs, the observed feature persists over a broad range of temperatures from 4900–2900 K (1.17–3.4 days), which over the subsequent days then fades away, while the temperature cools a relatively minor few hundred Kelvin.
3. He I λ1083.3 nm line
The critical aspect in whether He Iλ1083.3 nm (1s2s 3S–1s2p 3P) can explain the observed feature relies on the population of the lower energy level of the transition, which is the lowest-lying level (pseudo ground state) of the triplet states of neutral helium (see Fig. 2). There are three key conditions required to produce a He I feature:
-
Naturally, one needs an appropriate abundance of helium, which in contrast to most r-process elements varies by as much as four orders of magnitude between different nucleosynthesis simulations. Minor helium abundances can be produced when modelling dynamical ejecta (such as Perego et al. 2022, where XHe ≈ 0.01%), while high helium abundances can be produced for ejecta with high Ye (such as Kullmann et al. 2022; Kawaguchi et al. 2022; Just et al. 2023, where XHe ≈ 1 − 50%).
-
As the triplet ground state is 19.8 eV above the He I ground state (compared with kBT ≈ 0.25–0.4 eV for early epochs in AT2017gfo), the triplet population is not efficiently populated by excitation due to thermal particles. The triplet states are instead populated by recombination from He II, which is itself populated by ionisation of He I by radioactive decay particles. This means that most effective populating of the He I triplet ground state occurs when the majority of helium is singly ionised.
-
The triplet levels are also highly sensitive to photoionisation from near-UV photons due to their proximity to the ionisation energy (≲5 eV). The most detailed NLTE helium modelling in the KN context up to this point (Tarumi et al. 2023) only includes ionisation from the triplet ground state, 1s2s 3S (e.g. photons with energies > 4.8 eV, λ < 260 nm). However, in our analysis, we find that ionisation from the 1s2p 3P-state (λ ≈ 340 nm) must be included because the photoionisation and natural decay pathway leaving the triplet states in all early epochs is not dominated by the 1s2s 3S state but by the 1s2p 3P state, as we discuss in Sect. 4.3.
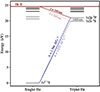 |
Fig. 2. Grotrian diagram showing the He I energy levels. The 1s2s 3S–1s2p 3P 1083 nm transition could produce a 1 μm P Cygni feature in NLTE models (e.g. Tarumi et al. 2023) because 1s2s 3S can be difficult to ionise (e.g. requiring UV photons < 260 nm) and the natural transition to the ground state is very slow (e.g. characteristic timescale of hours). However, as shown here, the other well-populated triplet state, 1s2p 3P, is several orders of magnitude more susceptible to ionisation and naturally decays to the ground state 106 times faster, on a timescale of 0.01 second. |
We focus in this modelling on the last issue because this allows for quantitative predictions to be made for the temporal evolution of the He I feature. The expected evolution can be compared and contrasted with the expected evolution of features due to strontium and with the 1 μm feature as it is observed. In particular, this aspect is most strongly constrained observationally in the earliest appearance of the feature when comparing with the UV flux constraints from Swift-UVOT, which we turn to next.
The relevant energy levels (1s2s3S at 19.8 eV and 1s2p3P at 21.0 eV above the ground state) are sensitive to photoionisation to He II (at 24.6 eV above the ground state) because UV photons (with λ < 260 nm for 1s2s 3S and λ < 340 nm for 1s2p 3P) would quickly depopulate these triplet states of helium through photoionisation. Tarumi et al. (2023) note that 0.3% of the flux inferred from the Wien tail of a 4400 K black body (e.g. approximately the Doppler-corrected 1.4-day black body) is sufficient to depopulate the triplet states in their models, but given the lack of UV observations, it was tentatively suggested that line blanketing could suppress the UV flux to this level (and thus permit an NLTE population in the 1s2s 3S state).
However, nearly contemporaneous with the SALT spectrum (and the first chronological observation of the 1 μm feature), there are observational constraints on the UV flux taken with Swift-UVOT (Evans et al. 2017; Nicholl et al. 2017). We show these constraints in Fig. 3, which suggest (i) the Swift data naturally extends the optical black body into the UV (showing no wholesale UV blanketing) and (ii) the photometric observations are far in excess of the model-allowed UV flux upper limit, which would thus photoionise and hence depopulate the triplet states. Given the observed decrease of the UV flux from 0.6 to 1.1 days (and that we are three orders of magnitude above the Tarumi et al. 2023 UV upper limit), the UV flux is likely to have been too large to permit a sufficient He I triplet population to form a strong feature – thus excluding the He I interpretation – in the first days post merger. In the subsequent days, a lower UV flux was tentatively detected – with the last detection (at 2σ significance) at 3.0 days post merger in the Swift UVW2 band. While extrapolating the Swift data beyond three days would be quite uncertain, the consistency of the UVOT photometry with a single temperature black body inferred from the X-shooter data in the first few days with no significant evidence for line blanketing gives some confidence that extrapolating the UV flux in wavelength from black-body fits to the X-shooter UVB arm at four to five days may be reasonable. Such spectral extrapolation strongly suggests the UV flux still exceeds the upper limit until at least four to five days post merger. An HST STIS UV spectrum provides a 3σ upper limit of FUV ⪅ 1.5 × 10⁻¹⁸ erg s−1 cm−2 Å−1 at 250 nm at 5.5 days (Nicholl et al. 2017), which ultimately is not below the limits of the UV flux expected from extrapolations of the X-shooter SED.
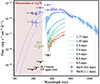 |
Fig. 3. SALT and VLT/X-shooter spectra with Swift-UVOT photometric constraints on the early UV flux. Photons with energies sufficient to ionise the population at 1s2s 3P (λ < 340 nm rest frame or equivalently λ < 280 nm corrected for ejecta expanding at 0.28c) is shown by the red region. The UV flux detected by Swift-UVOT in Evans et al. (2017) decreases with time, falling below the 3σ (2σ) detection threshold after 1.1 days (3.0 days). For comparison with the Swift observations, the maximum UV flux that allows He I to still produce the 1 μm feature (within the Tarumi et al. 2023 NLTE helium model) is shown in black. The Swift flux is around three orders of magnitude larger than what is permitted for the helium interpretation. |
4. Collisional-radiative NLTE model
To accurately model helium under NLTE at various epochs, we have implemented a collisional-radiative model. In Fig. 4, we show an energy-level diagram and highlight the various pathways and rates connecting the He I levels. To produce a strong He Iλ1083.3 nm (1s2s 3S–1s2p 3P transition) feature requires the triplet (orthohelium) population (i) to be decoupled from the singlet (parahelium) states, as these rapidly radiatively de-excite to the (isolated) ground state, and (ii) to have only weak pathways for photoionisation to He II. Crucially, accurately modelling the 1s2s 3S level population must include higher energy levels and their transitions, as these contribute significantly to the pathways depopulating triplet helium. We have collisional data between all levels with n ≤ 4, so this constitutes the fiducial model in this work. We find that including further energy levels is of lesser importance given their small NLTE populations, with less than a 10% decrease in the triplet population when including all levels up to n ≤ 8 for all epochs.
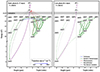 |
Fig. 4. Network Grotrian diagram indicating the dominant pathways entering and leaving any level. The arrow-width shows the transition rate on a logarithmic scale, with the colour indicating the dominant mechanism. At early times, the dominant pathways leaving triplet He I is photoionisation. At later times (as the upper triplet levels are less populated), natural decay to the He I ground state and collisional pathways out of the triplet become increasingly important. |
4.1. The transition channels
In the following, we enumerate the transition channels between levels. The Tarumi et al. (2023) model includes collisional de-excitation, bound-bound radiative excitation, and photoionisation directly leaving the 1s2s 3S state. The difference between the work of Tarumi et al. (2023) and the model presented here is that we include all the direct and indirect pathways that connect triplet and singlet states, that is, the inclusion of collisional, radiative, and photoionisation pathways from the triplet states above 1s2s 3S. As 1s2s 3S is strongly coupled to these higher triplet levels, the pathways from higher energy levels are important (see Fig. 4).
In our model, for ease of comparison, we assume an identical ejecta structure to Tarumi et al. (2023), namely, a spherically symmetric and homogeneous ejecta with a mass of 0.04 M⊙, distributed as ρ = ρ0v−5t−3 between v = 0.1c and v = 0.5c, with the value of ρ0 set by the total helium mass in the ejecta. The electron density has the same spatial distribution as ρ, as the free electrons trace the lowly ionised r-process elements – for the electron distribution we follow Tarumi et al. (2023) and assume ne = 1.5 × 108 cm−3 (at v = 0.3c, t = 1 day) as our default model. We have also explored using other ejecta structures with the ultimate conclusions on the self-consistency of the model remaining unchanged (see Sect. 5).
The line-forming region is illuminated by a black-body photon background from the underlying photosphere. Specifically, we assumed a geometrically diluted black-body radiation field inferred from the Doppler-corrected continuum. In practice, this means the best-fit black body to the continuum is assumed to set the local radiation field (needed for modelling radiative transitions) and the electron temperature (needed for modelling recombination and collisional transitions). Notably, this uses a photospheric approximation over the various wavelengths of scattering, which requires the assumption that the radiation field inferred (e.g. the Doppler-corrected black body) is representative of the local radiation field. Specifically, the outer line-forming region ∼0.45c (∼0.30c) scatters 10–20% lower wavelength than that expected from the inner line-forming region at ∼0.3c (∼0.2c) at 1.17 days (4.4 days). The continuum from such different wavelengths could originate from different velocity layers (characterised by different Doppler-corrections, temperatures, and radiation fields). Observationally, the continuum remains well modelled as a black body emanating from a single photosphere in the first days post merger, but employing a photospheric approximation from UV through NIR is tenuous. Regardless, the assumption employed here is only over a relatively limited range in wavelength of a few hundred nanometers. Lastly, the geometric dilution  is included to represent that the radiation field decreases for velocity shells that are increasingly distant from the photosphere (e.g. Mihalas 1978).
4.1.1. Radiative transitions: Bound-bound
At all times investigated, radiative transitions within triplet levels dominate over all other processes and thus set the relative level population. We modelled the three different types of radiative transitions, namely, absorption and spontaneous and stimulated emission.
We used A values for all transitions extracted from NIST (Kramida et al. 2023). For multiple lines between different fine-structure levels, we summed the transition’s lower levels and averaged over all upper states involved (Axner et al. 2004). Notably, the transition strengths between triplet and singlet states systematically increase for higher energy levels. In particular, the 1s4d3D–1s4f1F and 1s4f3F–1s4d1D transitions are very strong, A ∼ 108 s−1 (Drake 2006). We used the Sobolov escape probability, Pesc(τ) = (1 − e−τ)/τ, and the blue-wing intensity from the black-body model to describe the mean intensity in each line (e.g. following the procedure for homologous fast velocity fields in Lucy 2002).
We have not included any additional radiative decay mechanisms, such as two-photon emission, since these occur on much longer timescales. In the limit of detailed balance between two levels, the level population ratios are Boltzmann-distributed with a geometric dilution factor of 0.5 (as exemplified in Eq. (2), below). Due to the strong transitions between triplet states, this provides a good approximation of the relative triplet helium populations at all times investigated.
4.1.2. Collisional transitions
In the low-temperature limit, transitions from triplet to singlet states are driven by collisions with thermal electrons. We used the thermally averaged transition rates from Ralchenko et al. (2008). We are not particularly sensitive to the exact transition rates employed with the collisional transition rates from Berrington & Kingston (1987) yielding similar conclusions. The rate of ionisation by thermal electrons is negligible compared to the collisional de-excitation rate, which is similar to the findings in previous works (e.g. Tarumi et al. 2023).
4.1.3. Photoionisation
The wavelength-dependent photoionisation cross-section, σPI, for different levels is taken from Nahar (2010). In the first days post merger, photoionisation is a significant source of depopulation. For higher levels, the photoionisation cross-section increases, and more of the spectral flux can ionise as the threshold photon energy decreases. The 1s2s 3S level has the smallest photoionisation cross-section of any triplet species and only extends up to 260 nm. 1s2p 3P level has a photoionisation cross-section that is approximately five times greater and extends up to 340 nm. The levels from n = 3 and above can be photoionised from photons near the black-body peak, where the photon density is at its highest. This means that photoionisation of n = 3 levels is unaffected by UV flux modelling. While 1s2s 3S will have a larger population than higher energy levels, this level is never a dominant photoionisation pathway for any observed KN temperature. Photoionisation does not affect He II around or above the photosphere (given the black-body radiation field observed) due to its high ionisation potential of 53 eV.
4.1.4. Recombination
For recombination, we used the temperature-dependent state-specific recombination coefficients, α, provided in Nahar (2010). The recombination flux was thus modelled on a level-by-level basis, but due to the natural transition cascades from excited levels, the excited electron quickly decays to the triplet and singlet ground states. For all relevant temperatures, this implies that approximately half of the recombinations effectively end up populating 1s21S and 1s2s 1S, while the remaining half populates 1s2s 3S.
4.1.5. Non-thermal electron ionisation
Nuclear decay creates non-thermal electrons that can ionise helium, thus producing the He II required for recombination to populate triplet helium. We modelled this process in a manner identical to Tarumi et al. (2023) and did not revisited their approximations for evaluating the Spencer-Fano calculations. Specifically for ionisation, we assumed a non-thermal electron flux from β-decay of r-process elements from Hotokezaka & Nakar (2020) of 1 eV s−1t−1.3 per ion, with t in days and a work per ion of 593 eV for He I and 3076 eV for He II (from Tarumi et al. 2023, who refer to Hotokezaka et al., in prep.).
Non-thermal electrons can ionise any level of He I, but this process is only the limiting rate step for the ground state. For all energy levels above the ground state, the radiative and thermal collisional pathways dominate. While we model this process identically for every He I level, it is only important from the ground state. For helium, the main uncertainty in non-thermal ionisation lies in the deposition rate, as (to the first order) the ionisation rate coefficients scale linearly with the deposition rate. The deposition rates are similar across models within a factor of a few, which implies the dominant uncertainty of the helium ionisation state comes from the recombination rate (i.e. the exact electron density).
It is worth noting that the non-thermal modelling leads to the most generous conditions for the triplet helium population. At all times considered, He II is a dominant species near the photosphere, which maximises the recombination rate and thus the possible triplet density. If one were to significantly increase or decrease the radioactive ionisation, He II could become sub-dominant to either He I or He III.
4.2. Inferred He mass
Using this NLTE population modelling, we were able to estimate and compare the helium mass needed to produce the observed feature. Specifically, the NLTE model determines what fraction of helium is in the 1s2s 3S level for any given epoch, where we infer the radiation field (needed for radiative transition) and the particle temperature (needed for collision rates and recombination rates) from the Doppler-corrected observed black-body continuum in each epoch. Given a total helium density and the time post merger, the NLTE model thus sets the 1s2s 3S density across the line-forming region. To produce a Sobolev optical depth, τ, given the oscillator strength of the He Iλ1083.3 nm feature requires a density n(1s2s 3S) ≈ 7.4τtd−1 cm−3 where td is the time in days (Tarumi et al. 2023).
The Sobolev optical depth (at the photosphere) is inferred from a best-fit P Cygni to the absorption feature, where we have used the P Cygni implementation in the Elementary Supernova model (see Jeffery & Branch 1990)1. Here the profile is expressed in terms of the rest wavelength λ0 and the line optical depth τ(v) = τ(vph)⋅e−(v − vph)/ve, with a scaling velocity ve, a photospheric velocity vph, and a maximum ejecta velocity vmax. Nearly all of these parameters can be optimised to fit the data, with the exception of the known rest wavelength of the transition, ie. 1083.0 nm. We note this central wavelength is slightly redward (0.02 − 0.06c) of the observed emission peak in all photospheric epochs. The parameters related to velocity can be chosen to mimic the observed feature velocity scale as the ejecta-structure is a priori (largely) unknown. The optical depth of a line sets the 1s2s 3S density or, by extension (given the collisional-radiative NLTE model), the total helium density. From this, we could deduce the total mass above the photosphere by integrating over each velocity shell
 (1)
(1)
from the inner photospheric shell and outwards. For the baseline model, we assumed XHe is independent of velocity, but for completeness we did examine the potential impact of composition gradients in Sect. 5. Given the rapid decline of density with velocity, ρ ∝ v−5, our mass is dominated by the ejecta near the photosphere. The resulting masses are detailed in Fig. 5. Within this framework, the dominant uncertainty in the required helium mass comes from the exact 1s2s 3S level-population relative to the total helium population, which is dominated by the uncertainty in the ejecta temperature. We emphasise this ‘helium mass’ is tightly coupled to solely the He II mass, as this is a dominant ion.
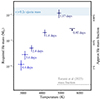 |
Fig. 5. Estimated helium mass required to produce the absorption of the 1 μm feature in early spectra. These estimates are derived using the NLTE helium model described in Sect. 4. The left y-axis indicates the approximate He mass fraction (given the high velocity ejecta component is around ∼0.01 M⊙, which is likely most representative around three to five days post merger), while the exact helium mass fraction for each epoch can be found in Table 1. The required helium mass changes drastically between epochs, and for any epoch, it is largely inconsistent with all remaining epochs (primarily due to the decreasing strength of radiative pathways leaving triplet helium). At early times, the helium mass required for a feature is comparable to the total mass of the early higher-velocity (v ≈ 0.2–0.3c) ‘blue’ ejecta. The absence of a helium feature at 0.92 days provides a 5σ upper limit on the helium mass (reported as solely the statistical uncertainty from the observed spectra). The grey dashed line indicates the mass fraction considered in Tarumi et al. (2023). |
In Fig. 6, we show how the He Iλ1083.3 nm feature would evolve across epochs given various helium mass fractions. The continuum is modelled by the best-fit black-body overlayed with the P Cygni parameterised from the elementary supernova model (deliberated in Sect. 2), which has an optical depth set by the 1s2s 3S density. The reference total ejecta mass of the high-velocity ejecta (v ⪆ 0.2c) is around 0.01–0.02 M⊙ (e.g. Cowperthwaite et al. 2017; Villar et al. 2017; Siegel 2019). It is likely that there is even less mass in the line-forming region from 0.92 to 2.4 days because the velocity v ⪆ 0.25 − 0.3c (inferred from the 1 μm line or the black-body continuum, see detailed velocity-constraints in Sneppen et al. 2023a), but as the photosphere recedes towards 0.2c, this estimate likely becomes representative of the total ejecta mass around three to five days post merger.
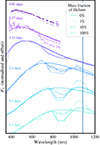 |
Fig. 6. Evolution of a He Iλ1083.3 nm feature. The vertical line indicates the transition’s rest wavelength. In NLTE, a He I feature would become increasingly strong with time, as the dominant pathways depleting the triplet states are from excited triplet levels that are less populated at lower temperatures. This highlights the differences in the temporal trends, which show a very weak initial but then increasingly strong He line, in contrast to the observed feature that emerges suddenly and then reduces over time. |
4.3. NLTE helium modelling: Sensitivity to 1s2p 3P
Tarumi et al. (2023) concluded that a He I feature could be relatively stable when examining the pathways leaving 1s2s 3S in the limit of no UV flux. When including all the relevant energy levels, as we show below, a He I feature’s strength is however temperature sensitive and would evolve by orders of magnitude between epochs. As we present in Sect. 5, this implies that a He I feature cannot match the evolution observed in AT2017gfo over the photospheric epochs.
The presented NLTE modelling of helium, assuming a geometrically diluted black-body radiation field, indicates that the relative level populations are well described as Boltzmann distributed with a dilution factor of W ≈ 0.5 for 1s2p 3P (see Bhatia & Underhill 1986; Tarumi et al. 2023),
![Mathematical equation: $$ \begin{aligned} \frac{n(\mathrm{1s2p\,^3P}) }{n(\mathrm{1s2s\,^3S})} = \frac{3}{1} \mathrm{exp} \left[ \frac{E(\mathrm{1s2p\,^3P})-E(\mathrm{1s2s\,^3S})}{k_BT} \right] W. \end{aligned} $$](/articles/aa/full_html/2024/12/aa51450-24/aa51450-24-eq3.gif) (2)
(2)
For the de-reddened black-body temperatures T for the early 1 μm feature (i.e. 5000 K and 4200 K at 1.17 and 1.43 days), this would imply 10% and 6%, respectively, of the triplet helium is in the 1s2p 3P level. We again note that in this model we equate the temperature of the local black-body radiation field with the observed Doppler-corrected black-body temperature. However, even perturbing this assumption, we are almost certainly in the regime where a few percent of the population is in higher triplet levels.
This subtle minority of the triplet population is important in two respects. Firstly, the photoionisation cross-section for 1s2p 3P is approximately five times larger than for 1s2s 3S (Nahar 2010), and it can photoionise with redder photons (i.e. λ ≈ 340 nm), where the flux level is at least two to 20 times larger, as it is closer to the spectral peak. For the relevant temperatures of AT2017gfo where the 1 μm feature is present, the photoionisation rate from 1s2p 3P is around one to two orders of magnitude larger than from 1s2s 3S. 1s2s 3S and 1s2p 3P are photoionised respectively within ∼0.01 s and ∼0.0005 s by 1.17 days and ∼300 s and ∼1 s by 4.4 days. Secondly, the natural decay to the ground level from 1s2p 3P (having a lifetime of ∼0.01 s) is a million times faster than 1s2s 3S (which has a lifetime of roughly two hours). It is thus only at late times that natural decay becomes important for estimating the triplet population.
Including even higher triplet energy levels (with quantum numbers n = 3, n = 4, etc.) adds to the depopulation channels but only significantly at early times. This is because these higher energy levels are very weakly populated in both LTE and NLTE (≈10−4 less populated than 1s2s 3S at one to two days post merger and rapidly dropping with time). However, the depopulation rate from these higher states due to photoionisation is also O(104) times larger, as optical photons near the spectral peak can ionise, and the cross-section for photoionisation is larger. Additionally, some of their radiative decays to the singlet states are very large, with A values on the order of 106 s−1. Thus, these higher levels are actually comparable in importance to 1s2p 3P at early times.
5. Evolution of a NLTE He I feature
Ultimately, a He I interpretation in early spectra is observationally contradicted in four respects. First, the time of the feature’s first appearance is not consistent with He I. Forming a feature at these epochs requires a helium mass comparable to the entire mass of the KN higher-velocity ejecta (i.e. the line-forming region). The required helium mass is lower towards the end of the photospheric epochs and begins to enter the range of nucleosynthesis calculations (see Figs. 5 and 6). Second, the feature forms too suddenly for He I. When modelling the 1 μm feature as He I at 1.17 days, such a helium-rich model would also create a feature in the earlier spectra at 0.92 days, which is not observed. Specifically, a helium mass MHe > 0.004 M⊙ is ruled out at 5σ by the non-existence of a feature in the ANU spectrum from 0.92 days, while a helium mass of MHe = 0.017 ± 0.006 M⊙ is required to fit the observed feature at 1.17 days (see Fig. 6). This inconsistency fundamentally follows from the large observed change in the feature, which contrasts with the relative minor evolution in radiation conditions between 0.92 days and 1.17 days. It is worth noting in this context that the recombination timescale itself can become comparable with the timescale between early spectra when given sufficiently low electron densities. For ne = 108 − 109 cm−3 the recombination timescale to 1s2s 3S would range from 8–0.8 hours. This implies that (i) given low enough electron-densities the steady-state approximation (i.e. using the contemporaneous radiation field) for evaluating level population may be overly simplistic and that (ii) for a helium interpretation, the 1.43- to 1.47-day post-merger timescale over which the feature forms in emission requires a large electron density with ne ≳ 109 cm−3.
Third, the higher-triplet level (1s2p 3P) being significantly populated at early times implies the other triplet He I lines at 587.7 and 706.7 nm, seen in type-Ib supernovae, should also produce weaker features if a He I 1083.3 nm line was present. Especially, the He Iλ587.7 nm should be pronounced in the early epochs. As evaluated from the level population and A values, it should have around a tenth of the strength of the 1083.3 nm line at 1.17 and 1.43 days. This would fade away to a few percentage points by the later epochs. This is around the typical range of line ratios seen for type Ib supernovae (Dessart et al. 2020). A larger continuum opacity in the optical could suppress the lines, but as other features are not obscured around these wavelengths (e.g. the absorption below 400 nm at 1.4 days Gillanders et al. 2022; Vieira et al. 2023 and the 760 nm P Cygni Sneppen & Watson 2023), such a suppression is unlikely to kill the corroborating features. Lastly, we note in passing that the 2.06 μm line from singlet helium (1s2s 1S–1s2p 1P) would not be observable due to the rapid radiative transition to the ground state level from 1s2p 1P, which keeps these levels depopulated (Tarumi et al. 2023; Gillanders et al. 2023).
Fourth, the observed feature strength evolves in the opposite direction expected in a helium interpretation (see Fig. 6). The 1s2s 3S level is increasingly easier to populate at lower temperatures (as the other triplet states become less populated and are more sensitive to photoionisation and radiative decay), so a He I feature should grow in optical depth with time. In contrast, the observed feature decreases in optical depth. This also means the He I mass required to produce a feature in any early epoch is inconsistent with the 1 μm feature for any other epoch. The helium mass required in any early epoch over-predicts the strength in all the subsequent epochs by one to two orders of magnitude, and the lower helium mass required in later epochs cannot explain the prominence of the feature observed at earlier times. We note that sizeable radial composition gradients can be produced in hydrodynamical simulations, but crucially the observed line-forming region overlaps between epochs, making the helium abundance inconsistent within the same ejecta regions. In Table 1, we show the total ejecta mass above the photosphere (using Eq. (1)), the needed helium mass, and the corresponding helium mass fraction for each epoch. The three earliest epochs (0.92, 1.17, and 1.43 days post merger) largely constrain the same velocity range, but they provide an order-of-magnitude inconsistency (and a 2.5σ discrepancy) in the needed helium abundance. The subsequent daily recession of the photosphere – at the level of 0.03–0.04c per day – represents a subtle shift in the velocity-region probed when compared with the width of the line-forming region of 0.15–0.2c. While it is difficult to directly compare 1.4-day and 4.4-day constraints (given the sizeable difference in velocity range probed over longer intervals in time), day-to-day constraints are more transparently comparable, as they probe similar ejecta regions. At later times (e.g. 3.4–4.4 days post merger), the required helium mass fraction displays only a subtly internal tension – being consistent within 2σ in derived XHe. In Sect. 5, we show that the inconsistencies in the required helium mass is not sensitive to the particular assumed radial elemental distribution but persists over a broad range of density distributions ρ(v), or equivalently ρHe(v).
Photospheric velocity, vph; total mass above photosphere; and the helium mass required above the photosphere. Lastly, given the ratio of MHe(> vph) to Mej(> vph) one can compute the implied helium mass fraction, XHe.
To describe the observed feature, we instead required a line that suddenly appears, remains optically thick, and then subsequently gradually becomes weaker in absorption with time. As showed by Sneppen et al. (2024a,b), all of these aspects are predictions of an LTE Sr II interpretation of the feature. Specifically, Sr II in LTE conditions has to (i) become rapidly optically thick at 1.0 ± 0.1 days in absorption, (ii) remain optically thick for several days, and (iii) transition to being optically thin at around three to four days post merger. Afterwards the feature should decay away. One could potentially argue, as mentioned in Tarumi et al. (2023), that a blend of Sr II and He I combine to produce the observed feature, with the latter only contributing at the later epochs. However, such a blend is not observationally required by the data; the decreasing Sobolev optical depth due to the increasingly diluted Sr II self-consistently captures the decreasing strength of the observed absorption. As such, the results of this temporal analysis naturally favours the conclusion found in the models of Perego et al. (2022), where strontium rather than helium produces the observed 1 μm feature.
5.1. Generalisations of the ejecta structure
The tension between the absorption of the observed 1 μm feature’s evolution (i.e. fading after the first few days) and that predicted for a He I interpretation (i.e. generically growing stronger in time) is not strongly sensitive to the specific ejecta structure modelled here. We have explored density structures ρ ∝ v−α with various power law slopes α ∈ [0; 10]. Furthermore, the baseline model assumes a higher ionisation state than predicted for LTE, so we have also investigated a broader range with ne = (0.6 − 1.2)⋅108 cm−3 (again at v = 0.3c, t = 1 day), as would be suggested from single-ionised nuclei with A ∼ 100 and an ejecta mass of 0.04 − 0.08 M⊙ (e.g. Smartt et al. 2017; Cowperthwaite et al. 2017; Villar et al. 2017; Siegel 2019). Varying the electron density or helium density structure ultimately does not alleviate the inconsistency between the first days post merger and the observed feature, as this is a consequence of the diminishing strength of radiative pathways leaving triplet helium.
A fundamental limitation in the current modelling remains the assumption of spherical symmetry in the ejecta distribution. A quasi-spherical geometry is suggested by the observed spectral features in AT2017gfo (see the P Cygni features and discussions in Sneppen et al. 2023a, 2024a), but we note the modelling in Collins et al. (2024) shows that symmetric ejecta is not necessarily required to produce near-spherical line-forming regions from certain sight lines. It is worth noting that the near-polar viewing angle of the merger means the absorption feature in effect only constrains the helium near the polar regions. However, fortunately for observability, it is also the polar ejecta, with its high Ye-ejecta component, which is commonly interpreted as allowing the highest helium abundance (e.g. Kawaguchi et al. 2022; Just et al. 2023). Constraints on the equatorial ejecta could be obtained from studying the emission component, but such examinations require modelling of reverberation effects (e.g. Sneppen et al. 2024b) and assumptions on the underlying radiative field (which for these distant ejecta parts are not directly observed or known), thus making any conclusions more difficult to assess. Full 3D radiative transfer modelling on numerical relativity simulated KNe (such as work in Shingles et al. 2023; Collins et al. 2024) are a natural next step in exploring the robustness of the constraints presented here, but we emphasise even large geometric perturbations are unlikely to alleviate the fundamental inconsistency in the helium model’s evolution, namely that the observed declining strength of the radiative field results in an order-of-magnitude less suppression of a He I triplet population.
6. Assessing the importance of NLTE modelling for kilonovae at early times?
Perhaps the most striking aspect of the early spectra taken of AT2017gfo is their apparent simplicity. A simple black body empirically describes the continuum very well at early times (e.g. the first X-shooter spectrum at 1.4 days has percent-level consistency in the inferred temperature from the UV through the NIR, see Sneppen 2023). The spectral perturbations away from the black body are produced in the KN atmosphere by the r-process species with the strongest individual transitions, with LTE appearing to be a good assumption for the relevant ionisation state of those species (Watson et al. 2019; Domoto et al. 2022). Indeed, the emergence time and early spectral shape of features in AT2017gfo follow the predictions of a recombination wave between ionisation states in LTE, which constrains the black-body temperature of the radiation field to be within 5% of the electron temperature (Sneppen et al. 2024a). While both the continuum and the spectral features are thus well-described by LTE conditions and LTE populations at early times, it remains unclear as to what extent NLTE effects are required and, indeed, permitted by the early data.
We note further complexities could be explored in future models, such as the variety of ejecta structures, including more refined radioactive ionisation modelling, and allowing different excitation temperatures beyond the observed colour temperature. However, as noted above, the NLTE model developed by Tarumi et al. (2023) and extended here already assumes optimistic conditions for forming a He feature. That it still cannot describe the observed feature is because one would need to produce an NLTE model that populates the 1s2s 3S level significantly without populating any other excited levels of He I. This seems difficult since one would have to decouple 1s2s 3S from 1s2p 3P, and these are respectively the relevant lower and upper levels of the 1083 nm transition.
One cannot alleviate the non-physical helium mass required at early times by introducing stronger (or weaker) radioactive ionisation because the models presented already assume the majority of helium is singly ionised and thus already assume the maximum recombination rate possible. Indeed, any significant change to the radioactive ionisation modelling would only decrease He II, thus decreasing the recombination rate to He I and increasing the helium mass tension. Tarumi et al. (2023) note that non-thermal electrons should deplete Sr II within their framework in favour of more highly ionised species with time. Conversely, the NLTE modelling in Pognan et al. (2023) still finds substantial contribution from Sr II, even for late-time spectra. Ultimately, current ionisation state modelling is highly uncertain for r-process elements. Due to the lack of photoionisation cross-sections for r-process elements, the recombination rates are simply scaled hydrogenic approximations in Tarumi et al. (2023), and non-thermal collisions are commonly approximated with generic formulae for ionisation cross-sections (see Pognan et al. 2022). Improvements to the atomic data through detailed theoretical calculations and experiments will be instrumental to permitting stronger statements based on the observed data.
Nevertheless, it is worth considering what the observed consistency of the 1 μm feature (and its continued relation to Sr II) suggests for modelling radioactive ionisation because models that predict that the Sr II population should substantially diminish in time (due to radioactive ionisation) do not describe the observed feature’s evolution well. For context, we note that detonation models of type Ia supernovae predict that non-thermal ionisation leads to the presence of multiply ionised species and the depletion of low-ionisation species, which again is in contrast to the observed emission lines from Type Ia supernova, which are dominated by singly and doubly ionised Fe-group nuclei (Wilk et al. 2018; Shingles et al. 2022). Such discrepancies may potentially be alleviated by introducing clumping (Wilk et al. 2020), while it may also hint at broader tensions between current non-thermal ionisation modelling and the observed spectra.
7. Conclusion
In this analysis, we have revisited whether He Iλ1083.3 nm in NLTE can explain the observed 1 μm P Cygni feature in the KN AT2017gfo. Employing a collisional-radiative model, we found that the density of triplet helium (and thus any He Iλ1083.3 nm feature) is highly temperature sensitive. Due to the decreasing importance of radiative transitions, a helium feature will generically become stronger in time, which is in contrast to the decreasing Sobolev optical depth of the observed feature. Thus, the helium mass required to produce the 1 μm feature is inconsistent between each observed epoch.
The earliest appearance of the feature is in the SALT spectrum at 1.17 days, where the helium mass required in the line-forming region,  , is comparable to (or in excess of) the entire high-velocity ejecta component (i.e. XHe ∼ 1), which effectively excludes a He I interpretation from a nucleosynthesis perspective at early times on mass grounds alone. This interpretation is further disfavoured by the non-detection of corroborating features (particularly He Iλ587.7 nm), the emergence time being more rapid than suggested by the feature’s formation, and the subsequent fading in the line. While the Sr II model, under the assumption of LTE, can reproduce the data at all times, the increased strength of a He I line with time implies a potential contribution is possible at later epochs for nucleosynthesis models where sufficient helium is produced. Indeed, observations in these epochs may be used to constrain the maximum helium abundance allowed in the kilonova AT2017gfo (as detailed in Sneppen et al. 2024a). Aggregated atomic data for the r-process elements is needed to help understand the constraints the formation, existence, and evolution of the observed spectral features place on the ejecta.
Data availability
The spectral series used in this paper is composed from a series of different observing programmes at various telescopes. The 0.92 day spectra were obtained with the Australian National University (ANU) the 2.3 meter telescope located at Siding Spring Observatory. The 1.17 day data obtained with the Southern African Large Telescope (SALT) under the Director’s Discretionary Time programme 2017-1-DDT-009, are available at https://ssda.saao.ac.za with the newly reduced spectra (e.g. with improved flux calibration, see Sneppen et al. 2024a) now publicly available at https://github.com/Sneppen/Kilonova-analysis. X-shooter data from European Space Observatory (ESO) telescopes at the Paranal Observatory under programmes 099.D-0382 (principal investigator [PI]: E. Pian), 099.D-0622 (PI: P. D’Avanzo), 099.D-0376 (PI: S. J. Smartt), which are available at http://archive.eso.org and WISeREP (https://wiserep.weizmann.ac.il/). The compiled data-sets (and re-processed when necessary, see Sneppen et al. 2024a) can be found at https://github.com/Sneppen/Kilonova-analysis.
For P Cygni profiles, we use the implementation in the Elementary Supernova (Jeffery & Branch 1990) from https://github.com/unoebauer/public-astro-tools with generalisations for computational speed-up and to account for special relativistic corrections as outlined in Sneppen et al. (2023b) see https://github.com/Sneppen/Kilonova-analysis. The code to estimate the NLTE level populations for helium is provided in https://github.com/rasmus98/NLTE-Helium.
We adapted Ulrich Noebauer’s pcygni_profile.py in https://github.com/unoebauer/public-astro-tools
Acknowledgments
The authors would like to thank Kenta Hotekezaka for clarifying and discussing the NLTE helium modelling in previous literature. Additionally, the authors would like to thank Oliver Just, Gabriel Martínez-Pinedo, Andreas Bauswein, Albino Perego, Leonardo Chiesa, Nick Vieira and Zewei Xiong for discussing the yields and variations within helium nucleosynthesis modelling. The Cosmic Dawn Center (DAWN) is funded by the Danish National Research Foundation under grant DNRF140. AS, RD, DW and SAS are funded/co-funded by the European Union (ERC, HEAVYMETAL, 101071865). Views and opinions expressed are, however, those of the authors only and do not necessarily reflect those of the European Union or the European Research Council. Neither the European Union nor the granting authority can be held responsible for them. LJS acknowledges support by the European Research Council (ERC) under the European Union’s Horizon 2020 research and innovation program (ERC Advanced Grant KILONOVA No. 885281). LJS acknowledges support by Deutsche Forschungsgemeinschaft (DFG, German Research Foundation) - Project-ID 279384907 - SFB 1245 and MA 4248/3-1. CEC is funded by the European Union’s Horizon Europe research and innovation programme under the Marie Skłodowska-Curie grant agreement No. 101152610.
References
- Abbott, B. P., Abbott, R., Abbott, T. D., et al. 2017, ApJ, 848, L13 [CrossRef] [Google Scholar]
- Andreoni, I., Ackley, K., Cooke, J., et al. 2017, PASA, 34, e069 [NASA ADS] [CrossRef] [Google Scholar]
- Axner, O., Gustafsson, J., Omenetto, N., & Winefordner, J. D. 2004, Spectrochim. Acta, 59, 1 [NASA ADS] [CrossRef] [Google Scholar]
- Berrington, K. A., & Kingston, A. E. 1987, J. Phys. B At. Mol. Phys., 20, 6631 [NASA ADS] [CrossRef] [Google Scholar]
- Bhatia, A. K., & Underhill, A. B. 1986, ApJS, 60, 323 [NASA ADS] [CrossRef] [Google Scholar]
- Buckley, D. A. H., Andreoni, I., Barway, S., et al. 2018, MNRAS, 474, L71 [NASA ADS] [CrossRef] [Google Scholar]
- Chornock, R., Berger, E., Kasen, D., et al. 2017, ApJ, 848, L19 [NASA ADS] [CrossRef] [Google Scholar]
- Collins, C. E., Shingles, L. J., Bauswein, A., et al. 2024, MNRAS, 529, 1333 [NASA ADS] [CrossRef] [Google Scholar]
- Coulter, D. A., Foley, R. J., Kilpatrick, C. D., et al. 2017, Science, 358, 1556 [NASA ADS] [CrossRef] [Google Scholar]
- Cowperthwaite, P. S., Berger, E., Villar, V. A., et al. 2017, ApJ, 848, L17 [CrossRef] [Google Scholar]
- Dessart, L., Yoon, S.-C., Aguilera-Dena, D. R., & Langer, N. 2020, A&A, 642, A106 [NASA ADS] [CrossRef] [EDP Sciences] [Google Scholar]
- Domoto, N., Tanaka, M., Kato, D., et al. 2022, ApJ, 939, 8 [NASA ADS] [CrossRef] [Google Scholar]
- Drake, G. W. F. 2006, Springer Handbook of Atomic, Molecular, and Optical Physics (Berlin: Springer) [CrossRef] [Google Scholar]
- Evans, P. A., Cenko, S. B., Cenko, S. B., et al. 2017, Science, 358, 1565 [NASA ADS] [CrossRef] [Google Scholar]
- Gillanders, J. H., Smartt, S. J., Sim, S. A., Bauswein, A., & Goriely, S. 2022, MNRAS, 515, 631 [NASA ADS] [CrossRef] [Google Scholar]
- Gillanders, J. H., Sim, S. A., Smartt, S. J., Goriely, S., & Bauswein, A. 2023, MNRAS, 529, 2918 [Google Scholar]
- Hotokezaka, K., & Nakar, E. 2020, ApJ, 891, 152 [CrossRef] [Google Scholar]
- Hotokezaka, K., Tanaka, M., Kato, D., & Gaigalas, G. 2023, MNRAS, 526, L155 [NASA ADS] [CrossRef] [Google Scholar]
- Jeffery, D. J., & Branch, D. 1990, in Analysis of Supernova Spectra, eds. J. C. Wheeler, T. Piran, & S. Weinberg, Supernovae, Jerusalem Winter School for Theoretical Physics, 6, 149 [NASA ADS] [Google Scholar]
- Just, O., Vijayan, V., Xiong, Z., et al. 2023, ApJ, 951, L12 [NASA ADS] [CrossRef] [Google Scholar]
- Kawaguchi, K., Fujibayashi, S., Hotokezaka, K., Shibata, M., & Wanajo, S. 2022, ApJ, 933, 22 [NASA ADS] [CrossRef] [Google Scholar]
- Kramida, A., Ralchenko, Y., Reader, J., & Team, N. A. 2023, NIST Atomic Spectra Database, https://physics.nist.gov/asd [Google Scholar]
- Kullmann, I., Goriely, S., Just, O., et al. 2022, MNRAS, 510, 2804 [NASA ADS] [CrossRef] [Google Scholar]
- Lucy, L. B. 1991, ApJ, 383, 308 [NASA ADS] [CrossRef] [Google Scholar]
- Lucy, L. B. 2002, A&A, 384, 725 [NASA ADS] [CrossRef] [EDP Sciences] [Google Scholar]
- Mihalas, D. 1978, Stellar Atmospheres (San Francisco: W.H. Freeman) [Google Scholar]
- Nahar, S. N. 2010, New Astron., 15, 417 [CrossRef] [Google Scholar]
- Nicholl, M., Berger, E., Kasen, D., et al. 2017, ApJ, 848, L18 [NASA ADS] [CrossRef] [Google Scholar]
- Perego, A., Vescovi, D., Fiore, A., et al. 2022, ApJ, 925, 22 [CrossRef] [Google Scholar]
- Pian, E., D’Avanzo, P., Benetti, S., et al. 2017, Nature, 551, 67 [Google Scholar]
- Pognan, Q., Jerkstrand, A., & Grumer, J. 2022, MNRAS, 513, 5174 [NASA ADS] [CrossRef] [Google Scholar]
- Pognan, Q., Grumer, J., Jerkstrand, A., & Wanajo, S. 2023, MNRAS, 526, 5220 [NASA ADS] [CrossRef] [Google Scholar]
- Ralchenko, Y., Janev, R. K., Kato, T., et al. 2008, At. Data Nucl. Data Tables, 94, 603 [NASA ADS] [CrossRef] [Google Scholar]
- Shappee, B. J., Simon, J. D., Drout, M. R., et al. 2017, Science, 358, 1574 [NASA ADS] [CrossRef] [Google Scholar]
- Shingles, L. J., Flörs, A., Sim, S. A., et al. 2022, MNRAS, 512, 6150 [NASA ADS] [CrossRef] [Google Scholar]
- Shingles, L. J., Collins, C. E., Vijayan, V., et al. 2023, ApJ, 954, L41 [NASA ADS] [CrossRef] [Google Scholar]
- Siegel, D. M. 2019, Eur. Phys. J. A, 55, 203 [NASA ADS] [CrossRef] [Google Scholar]
- Smartt, S. J., Chen, T.-W., Jerkstrand, A., et al. 2017, Nature, 551, 75 [Google Scholar]
- Sneppen, A. 2023, ApJ, 955, 44 [NASA ADS] [CrossRef] [Google Scholar]
- Sneppen, A., & Watson, D. 2023, A&A, 675, A194 [NASA ADS] [CrossRef] [EDP Sciences] [Google Scholar]
- Sneppen, A., Watson, D., Bauswein, A., et al. 2023a, Nature, 614, 436 [NASA ADS] [CrossRef] [Google Scholar]
- Sneppen, A., Watson, D., Poznanski, D., et al. 2023b, A&A, 678, A14 [NASA ADS] [CrossRef] [EDP Sciences] [Google Scholar]
- Sneppen, A., Just, O., Bauswein, A., et al. 2024a, arXiv e-prints [arXiv:2411.03427] [Google Scholar]
- Sneppen, A., Watson, D., Gillanders, J. H., & Heintz, K. E. 2024b, A&A, 688, A95 [NASA ADS] [CrossRef] [EDP Sciences] [Google Scholar]
- Tarumi, Y., Hotokezaka, K., Domoto, N., & Tanaka, M. 2023, arXiv e-prints [arXiv:2302.13061] [Google Scholar]
- Vieira, N., Ruan, J. J., Haggard, D., et al. 2023, ApJ, 944, 123 [NASA ADS] [CrossRef] [Google Scholar]
- Vieira, N., Ruan, J. J., Haggard, D., et al. 2024, ApJ, 962, 33 [NASA ADS] [CrossRef] [Google Scholar]
- Villar, V. A., Guillochon, J., Berger, E., et al. 2017, ApJ, 851, L21 [Google Scholar]
- Watson, D., Hansen, C. J., Selsing, J., et al. 2019, Nature, 574, 497 [NASA ADS] [CrossRef] [Google Scholar]
- Wilk, K. D., Hillier, D. J., & Dessart, L. 2018, MNRAS, 474, 3187 [NASA ADS] [CrossRef] [Google Scholar]
- Wilk, K. D., Hillier, D. J., & Dessart, L. 2020, MNRAS, 494, 2221 [NASA ADS] [CrossRef] [Google Scholar]
All Tables
Photospheric velocity, vph; total mass above photosphere; and the helium mass required above the photosphere. Lastly, given the ratio of MHe(> vph) to Mej(> vph) one can compute the implied helium mass fraction, XHe.
All Figures
|
Fig. 1. Evolution of the 1 μm P Cygni feature over the first five days post merger from the unified spectral compilation (Sneppen et al. 2024a). The spectra were taken post merger plus 0.92 day (ANU, Andreoni et al. 2017), 1.17 day (SALT, Buckley et al. 2018), 1.47 day (SOAR and Gemini-south, Nicholl et al. 2017; Chornock et al. 2017) 1.43, 2.4, 3.4, and 4.4 day (X-shooter, Pian et al. 2017; Smartt et al. 2017). The spectra prior to one day contain no strong deviation from the black-body continuum (see also Shappee et al. 2017). However, between 0.92 and 1.17 days, strong absorption appears, while an emission feature begins to emerge with a delay of around ten hours after this (1.43–1.47 days). We note that these are the predicted emergence time framess for both absorption and emission for a feature produced by LTE Sr II due to a recombination wave passing through the ejecta (Sneppen et al. 2024b). We show in this analysis that this emergence is inconsistent with a He Iλ1083.0 nm interpretation of the feature. |
| In the text | |
|
Fig. 2. Grotrian diagram showing the He I energy levels. The 1s2s 3S–1s2p 3P 1083 nm transition could produce a 1 μm P Cygni feature in NLTE models (e.g. Tarumi et al. 2023) because 1s2s 3S can be difficult to ionise (e.g. requiring UV photons < 260 nm) and the natural transition to the ground state is very slow (e.g. characteristic timescale of hours). However, as shown here, the other well-populated triplet state, 1s2p 3P, is several orders of magnitude more susceptible to ionisation and naturally decays to the ground state 106 times faster, on a timescale of 0.01 second. |
| In the text | |
|
Fig. 3. SALT and VLT/X-shooter spectra with Swift-UVOT photometric constraints on the early UV flux. Photons with energies sufficient to ionise the population at 1s2s 3P (λ < 340 nm rest frame or equivalently λ < 280 nm corrected for ejecta expanding at 0.28c) is shown by the red region. The UV flux detected by Swift-UVOT in Evans et al. (2017) decreases with time, falling below the 3σ (2σ) detection threshold after 1.1 days (3.0 days). For comparison with the Swift observations, the maximum UV flux that allows He I to still produce the 1 μm feature (within the Tarumi et al. 2023 NLTE helium model) is shown in black. The Swift flux is around three orders of magnitude larger than what is permitted for the helium interpretation. |
| In the text | |
|
Fig. 4. Network Grotrian diagram indicating the dominant pathways entering and leaving any level. The arrow-width shows the transition rate on a logarithmic scale, with the colour indicating the dominant mechanism. At early times, the dominant pathways leaving triplet He I is photoionisation. At later times (as the upper triplet levels are less populated), natural decay to the He I ground state and collisional pathways out of the triplet become increasingly important. |
| In the text | |
|
Fig. 5. Estimated helium mass required to produce the absorption of the 1 μm feature in early spectra. These estimates are derived using the NLTE helium model described in Sect. 4. The left y-axis indicates the approximate He mass fraction (given the high velocity ejecta component is around ∼0.01 M⊙, which is likely most representative around three to five days post merger), while the exact helium mass fraction for each epoch can be found in Table 1. The required helium mass changes drastically between epochs, and for any epoch, it is largely inconsistent with all remaining epochs (primarily due to the decreasing strength of radiative pathways leaving triplet helium). At early times, the helium mass required for a feature is comparable to the total mass of the early higher-velocity (v ≈ 0.2–0.3c) ‘blue’ ejecta. The absence of a helium feature at 0.92 days provides a 5σ upper limit on the helium mass (reported as solely the statistical uncertainty from the observed spectra). The grey dashed line indicates the mass fraction considered in Tarumi et al. (2023). |
| In the text | |
|
Fig. 6. Evolution of a He Iλ1083.3 nm feature. The vertical line indicates the transition’s rest wavelength. In NLTE, a He I feature would become increasingly strong with time, as the dominant pathways depleting the triplet states are from excited triplet levels that are less populated at lower temperatures. This highlights the differences in the temporal trends, which show a very weak initial but then increasingly strong He line, in contrast to the observed feature that emerges suddenly and then reduces over time. |
| In the text | |
Current usage metrics show cumulative count of Article Views (full-text article views including HTML views, PDF and ePub downloads, according to the available data) and Abstracts Views on Vision4Press platform.
Data correspond to usage on the plateform after 2015. The current usage metrics is available 48-96 hours after online publication and is updated daily on week days.
Initial download of the metrics may take a while.