| Issue |
A&A
Volume 684, April 2024
|
|
|---|---|---|
| Article Number | L24 | |
| Number of page(s) | 9 | |
| Section | Letters to the Editor | |
| DOI | https://doi.org/10.1051/0004-6361/202449672 | |
| Published online | 25 April 2024 | |
Letter to the Editor
Addition of the Local Volume sample of galaxies from the FAST HI survey
1
Special Astrophysical Observatory of the Russian Academy of Sciences, N.Arkhyz, KChR, 369167
Russia
e-mail: This email address is being protected from spambots. You need JavaScript enabled to view it.
2
Main Astronomical Observatory, National Academy of Sciences of Ukraine, Kiev, 03143
Ukraine
e-mail: This email address is being protected from spambots. You need JavaScript enabled to view it.
3
National Astronomical Observatories, Chinese Academy of Sciences, Beijing, 1000101
PR China
4
Guizhou Radio Astronomical observatory, Guizhou University, Guyang, 550000
PR China
e-mail: This email address is being protected from spambots. You need JavaScript enabled to view it.
Received:
20
February
2024
Accepted:
3
April
2024
Abstract
We report the discovery of 20 new dwarf galaxies in the Local Volume identified as optical counterparts to the Five-hundred-meter Aperture Spherical radio Telescope (FAST) All Sky HI Survey (FASHI) sources. The galaxies have a median stellar mass of 7.8 × 10⁶ M⊙ and a median HI mass of 1.0 × 10⁷ M⊙. Most of them are field galaxies, while three are probable members of the M 101 and M 106 groups. We also found seven FASHI radio sources to be probable dark HI clouds in nearby groups. Together with four other known HI clouds in the local groups, their mean-square radial velocity difference of 49 km s−1 with respect to the host galaxies yields an average total mass of (2.7 ± 1.0)×1011 M⊙ for these groups on the projected scale of 90 kpc.
Key words: surveys / galaxies: dwarf
© The Authors 2024
 Open Access article, published by EDP Sciences, under the terms of the Creative Commons Attribution License (https://creativecommons.org/licenses/by/4.0), which permits unrestricted use, distribution, and reproduction in any medium, provided the original work is properly cited.
This article is published in open access under the Subscribe to Open model. This email address is being protected from spambots. You need JavaScript enabled to view it. to support open access publication.
1. Introduction
A Local Volume (LV) of the Universe with a radius of 11 Mpc around the Milky Way is the most optimal sample for testing the results of N-body simulations performed within the framework of the standard cosmological paradigm, Λ cold dark matter. A unique feature of this sample is that it contains many faint dwarf galaxies that are essentially not observable at far distances. With distance and radial velocity measurements, the LV dwarf galaxies can be used as ‘test particles’ to trace a local field of peculiar velocities and to recover a distribution of dark matter in the LV. The radius of the LV sphere, 11 Mpc, is used because high-precision distances to galaxies can be measured by the Hubble Space Telescope from the tip of the red giant branch (TRGB) in one orbital turnover of the telescope.
The first sample of nearby galaxies within 10 Mpc was compiled by Kraan-Korteweg & Tammann (1979) and included 179. Systematic all-sky searches for nearby low surface brightness galaxies on images of the Palomar Observatory Sky Survey (Karachentseva & Karachentsev 1998, 2000; Karachentseva et al. 1999) and subsequent measurements of their radial velocities (Huchtmeier et al. 2000, 2001, 2003) increased the LV population to approximately 500 objects. Surveys of large sky regions in optical bands – from the Sloan Digital Sky Survey (SDSS; Abazajian et al. 2009) and the Dark Energy Spectroscopic Instrument (DESI) Legacy Imaging Surveys (Dey et al. 2019) – and in radio bands – from the HI Parkes All Sky Survey (HIPASS; Koribalski et al. 2004) and the Arecibo Legacy Fast ALFA (ALFALFA) survey (Haynes et al. 2011) – approximately doubled the number of known galaxies in the LV. Another significant addition to the LV sample resulted from special deep searches for low surface brightness objects in the virial zones of nearby groups (Chiboucas et al. 2009; Müller et al. 2019; Carlsten et al. 2022). Summary data of the LV galaxies are presented in the Updated Nearby Galaxy Catalog (UNGC; Karachentsev et al. 2013), a regularly updated version of which is available online1. To date, the LV sample comprises about 1400 objects with expected distances D < 11 Mpc.
We note that ‘blind’ sky surveys that use the HI 21 cm line have contributed significantly to the population of known late-type dwarf galaxies with star formation. However, the most extensive HI surveys (HIPASS and ALFALFA) cover predominantly the southern sky with declination Dec < + 38°. For the northern polar cap region, only one blind survey, of the Canes Venatici constellation, has been performed with the Westerbork radio telescope (Kovač et al. 2009). The new capabilities of the Five-hundred-meter Aperture Spherical radio Telescope (FAST; Jiang et al. 2020) promise to significantly reduce the existing asymmetry of the sky HI view.
According to Zhang et al. (2024), the FAST All Sky HI Survey (FASHI) will survey half the total sky (22 000 square degrees) in the declination interval between −14° and +66°. With a median sensitivity of 0.76 mJy⋅beam−1, a velocity resolution of 6.4 km s−1, and a beam size of FWHM = 2.9′, the FAST telescope is capable of detecting significantly more radio sources than the 300 m Arecibo Telescope. The first release of the FAST survey covers close to 7600 square degrees. A list of 41 741 sources with redshifts z < 0.09 detected in this survey has recently been published by Zhang et al. (2024).
2. New Local Volume candidates
Among the radio sources from the Zhang et al. (2024) catalogue, there are 580 objects with heliocentric radial velocities Vh < 1000 km s−1. Many of them are identified with well-known LV galaxies. Inspecting this sample, we discovered 27 sources absent from the LV database. Seven of these radio sources are completely invisible in the DESI Legacy Imaging Surveys. They may be dark galaxies without any stellar counterpart or be equivalents to the high velocity clouds of the Milky Way.
Images of 20 galaxies, identified with the FAST sources, are presented in Fig. 1. The basic parameters of these galaxies are listed in Table 1: (1) the galaxy names, (2) their equatorial coordinates (in degrees; epoch J2000.0), (3) the heliocentric radial velocity (in km s−1), (4) the width of the HI line at half intensity from the maximum (km s−1), (5) the integrated HI line flux (in Jy⋅km s−1), (6) the distance to the galaxy (in Mpc) determined by its radial velocity and taking the local velocity field calculated according to the numerical action method (NAM) into account (Shaya et al. 2017; Kourkchi et al. 2020), (7) the apparent UV magnitude in the far-UV band from the Galaxy Evolution Explorer (GALEX; Martin et al. 2005; Gil de Paz et al. 2007), (8–9) the apparent g and r magnitudes from the DESI Legacy Imaging Surveys (Dey et al. 2019), (10) the integral apparent B magnitude determined by the relation B = g + 0.313(g − r)+0.227 as recommended by Lupton2, or taken from NASA Extragalactic Database (NED)3 when a galaxy is outside the DESI Legacy Imaging zone, (11) the galaxy hydrogen mass expressed as log(MHI/M⊙) = 5.37 + 2log(DMpc)+log(SHI), (12) the galaxy stellar mass determined as log(M*/M⊙) = 12.23 + 2log(DMpc)−0.4B with the apparent B magnitude corrected for Galactic extinction (to estimate the galaxy stellar mass via its V-band luminosity, we used the relation M*/M⊙ = 1.4(LV/L⊙), as justified by McGaugh & Schombert 2014, and the average color (B − V) = + 0.37 for late-type dwarf galaxies; Makarova et al. 1998), and (13) the galaxy distance determined by the Tully-Fisher (TF) relation between the HI line width and the absolute B magnitude, MB = −19.99 − 7.27(log W50 − 2.5) (Tully et al. 2008). For some of the gas-dominated galaxies, we used the magnitude m21 = 17.4 − 2.5log(SHI) instead of the B magnitude. We also include notes about surrounding galaxies (14). As can be seen from Fig. 1, the optical diameters of the galaxies, being less than the beam size of FWHM = 2.9′, do not exceed 1′.
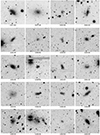 |
Fig. 1. Images of the 20 new dwarf galaxies identified with the FASHI radio sources. Most of the images are taken from the DESI Legacy Imaging Surveys. Each image side is 2′. North is up, and east is to the left. |
LV galaxy candidates from FASHI DR1.
We also include the galaxy UGC 63 in Table 1. Its HI parameters were known previously, but it has not been considered before as a member of the LV.
We note that, in general, the NAM distance estimations agree well with those determined using the TRGB distance estimate method. However, in specific sky regions close to the radius of the zero velocity sphere of the Virgo cluster, for example in the region of the Coma I group around NGC 4278 (Karachentsev et al. 2011), the difference between DNAM and DTRGB is large. For our LV member candidates, we therefore selected from the FASHI catalogue (Zhang et al. 2024) only galaxies for which the DNAM estimates do not differ greatly from the DTF estimates.
3. HI clouds in the LV galaxy groups
Table 2 presents seven cases for which nearby HI sources from the FASHI catalogue are not identified with any optical counterpart in the g and r bands of the Legacy Imaging Surveys, nor in the UV (GALEX) or infrared (Wide-field Infrared Survey Explorer) wavebands. These sources are all located in well-known nearby galaxy groups. The first six columns of Table 2 are similar to those of Table 1. Columns (7) and (8) present the name and distance (in Mpc) from the main galaxy in these groups. Columns (9) and (10) give the difference between the radial velocities (in km s−1) of the HI cloud and the central galaxy, as well as the projected separation between them (in kpc), assuming that the cloud is at the same distance as the host galaxy. Column (11) provides the hydrogen mass of the clouds calculated as described for Table 1. The bottom part of Table 2 presents the relevant data for four other known HI clouds in the LV groups: HIJASS1021+68 (Boyce et al. 2001), CVnHI (Kovač et al. 2009), M 94-HIn 9 (Zhou et al. 2023), and GBT 1355+54 (Mihos et al. 2012).
HI clouds in the LV groups.
We also identified in the FASHI catalogue 12 LV galaxies with known optical radial velocities for which HI parameters were absent. Their HI parameters are listed in Table 3: (1) a galaxy name, (2) equatorial coordinates, (3–5) HI galaxy parameters from FASHI (Zhang et al. 2024), (6) the galaxy distance (in Mpc) calculated via the NAM (Shaya et al. 2017; Kourkchi et al. 2020), and (7–8) estimates of hydrogen and stellar masses.
New HI data for the known LV objects.
Appendix A contains the names of the galaxies presented in Tables 1–3 and the corresponding ID numbers of the radio sources from the FASHI catalogue (Zhang et al. 2024). Appendix B shows the profiles of all the new LV HI sources in the same sequence as given in Tables 1–3.
4. Discussion and conclusion
As seen from Table 1, all nearby FASHI sources have radial velocities Vh < 850 km s−1. They are star-forming dwarf galaxies of morphological types Irr, Im, or BCD with a median color index of g − r = 0.21. The ones that lie within the GALEX viewing area have significant fluxes in the far-UV band. More than half of the HI sources with optical counterparts have a hydrogen mass that exceeds their stellar mass. The gas-rich dIrr galaxy FASHI1206+45 has a hydrogen-to-stellar mass ratio of 5.6.
Table 4 presents the average hydrogen and stellar masses for three categories of the FASHI sources: new LV dwarfs with an optical counterpart, HI sources without an optical counterpart, and the known LV dwarfs with new HI redshifts. There is no significant difference in the mean HI mass between the three subsamples. However, the HI clouds have a noticeably greater standard deviation (s.d.) in HI masses. The characteristic hydrogen mass of the new LV objects is 1.0 × 10⁷ M⊙ with a typical ratio MHI/M* = 1.3. Assuming that HI sources with no visible optical counterpart have g > 21.5 mag, we estimate their average hydrogen-to-stellar mass ratio to be more than 80.
Average parameters of the HI sources.
Most of these dwarf galaxies are located in the general field, though some of them are very isolated objects. Three dIrrs turned out to be peripheral members of known groups around M 101 and M 106 (also known as NGC 4258).
Estimates of distances to galaxies in Table 1, made according to the classic TF relation (Tully et al. 2008) or based on the galaxy’s baryonic analogue under the assumption that the shape of a dwarf is described by a rotating ellipsoid with an axis ratio b/a ≃ 0.6 (Karachentsev et al. 2017), are in satisfactory agreement with kinematic distance estimates (NAM), accounting for the local velocity field. The mean-square difference of the distance estimates is 2.1 Mpc, or 22% at the average distance of these objects, DNAM = 9.5 Mpc.
Relatively isolated dark HI clouds in the LV groups, presented in Table 2, have parameters W50 and SHI close to the parameters of usual dIrr galaxies. Their mean-square velocity difference relative to the host galaxies in the groups amounts to ⟨ΔV2⟩1/2 = 49 km s−1, and their average projected separation from the main galaxies, ⟨Rp⟩, is 90 kpc. These clouds can be considered test particles that characterise the groups’ kinematics. The average virial mass of the groups is Mv/M⊙ = 1.18 × 10⁶⟨ΔV2 × Rp⟩, where ΔV is expressed in km s−1 and Rp in kpc (Karachentsev & Kashibadze 2021), and equals (2.7 ± 1.0)1011 M⊙. The median K-band luminosity of the host galaxies in the groups under consideration is 6.2 × 10¹⁰ L⊙, which is close to the Milky Way luminosity. For such luminous galaxies, the virial radius of their dark halo amounts to Rv ∼ 300 kpc. Consequently, the subsystem of HI clouds is concentrated predominantly in the central part of the groups, with a characteristic radius three times less than Rv. In this volume, the ratio Mv/LK = (4.4 ± 1.7)M⊙/L⊙, estimated via the kinematics of HI clouds, is in line with the average ratio of ⟨Mv/LK⟩ = 17.4 ± 2.8(M⊙/L⊙) obtained for halos of major spiral galaxies in the LV on the scale of their virial radius as based on the kinematics of satellites (Karachentsev & Kashibadze 2021).
It should be noted that for FASHI, the lower radial velocity limit is Vh = 200 km s−1. However, there are about known 200 galaxies in the LV with radial velocities Vh < 200 km s−1. Hence, some fraction of the LV population will remain undetected by this survey. Obviously, the establishment in FASHI of a lower radial velocity limit is due to the difficulty in detecting the HI signal of a galaxy against the bright local HI background from the Milky Way.
Our identification of radio sources from the first FASHI release with optical objects led to the detection of 20 new dwarf galaxy candidates in the LV, as well as 7 HI clouds in nearby groups without signs of a stellar population. The upcoming completion of FASHI promises to increase the sample of LV galaxies.
The new LV candidates have radial velocities measured with a typical error of about 1 km s−1. Using new objects to trace the local field of peculiar velocities, determined by local attractors, requires high-precision TRGB distances that need to be obtained with space telescopes.
Acknowledgments
The authors thank the referee for constructive comments that helped to improve the paper. This work has made use of the FAST all Sky HI survey, the DESI Legacy Imaging surveys, the NASA/IPAC Extragalactic Database (NED), the Galaxy Evolution Explorer (GALEX), and the revised version of the Local Volume galaxy database. I.D.K. and S.S.K. are supported by the grant 07–15–2022–262 (13.MNPMU .21.0003) of the Ministry of Science and Higher Education of the Russian Federation.
References
- Abazajian, K. N., Adelman-McCarthy, J. K., Agüeros, M. A., et al. 2009, ApJS, 182, 543 [Google Scholar]
- Boyce, P. J., Minchin, R. F., Kilborn, V. A., et al. 2001, ApJ, 560, L127 [NASA ADS] [CrossRef] [Google Scholar]
- Carlsten, S. G., Greene, J. E., Beaton, R. L., Danieli, S., & Greco, J. P. 2022, ApJ, 933, 47 [CrossRef] [Google Scholar]
- Chiboucas, K., Karachentsev, I. D., & Tully, R. B. 2009, AJ, 137, 3009 [Google Scholar]
- Dey, A., Schlegel, D. J., Lang, D., et al. 2019, AJ, 157, 168 [Google Scholar]
- Gil de Paz, A., Boissier, S., Madore, B. F., et al. 2007, ApJS, 173, 185 [Google Scholar]
- Haynes, M. P., Giovanelli, R., Martin, A. M., et al. 2011, AJ, 142, 170 [Google Scholar]
- Huchtmeier, W. K., Karachentsev, I. D., Karachentseva, V. E., & Ehle, M. 2000, A&AS, 141, 469 [NASA ADS] [CrossRef] [EDP Sciences] [Google Scholar]
- Huchtmeier, W. K., Karachentsev, I. D., & Karachentseva, V. E. 2001, A&A, 377, 801 [NASA ADS] [CrossRef] [EDP Sciences] [Google Scholar]
- Huchtmeier, W. K., Karachentsev, I. D., & Karachentseva, V. E. 2003, A&A, 401, 483 [CrossRef] [EDP Sciences] [Google Scholar]
- Jiang, P., Tang, N.-Y., Hou, L.-G., et al. 2020, Res. Astron. Astrophys., 20, 064 [CrossRef] [Google Scholar]
- Karachentsev, I., & Kashibadze, O. 2021, Astron. Nachr., 342, 999 [NASA ADS] [CrossRef] [Google Scholar]
- Karachentsev, I. D., Nasonova, O. G., & Courtois, H. M. 2011, ApJ, 743, 123 [NASA ADS] [CrossRef] [Google Scholar]
- Karachentsev, I. D., Makarov, D. I., & Kaisina, E. I. 2013, AJ, 145, 101 [Google Scholar]
- Karachentsev, I. D., Kaisina, E. I., & Kashibadze Nasonova, O. G. 2017, AJ, 153, 6 [Google Scholar]
- Karachentseva, V. E., & Karachentsev, I. D. 1998, A&AS, 127, 409 [NASA ADS] [CrossRef] [EDP Sciences] [Google Scholar]
- Karachentseva, V. E., & Karachentsev, I. D. 2000, A&AS, 146, 359 [NASA ADS] [CrossRef] [EDP Sciences] [Google Scholar]
- Karachentseva, V. E., Karachentsev, I. D., & Richter, G. M. 1999, A&AS, 135, 221 [NASA ADS] [CrossRef] [EDP Sciences] [Google Scholar]
- Koribalski, B. S., Staveley-Smith, L., Kilborn, V. A., et al. 2004, AJ, 128, 16 [Google Scholar]
- Kourkchi, E., Courtois, H. M., Graziani, R., et al. 2020, AJ, 159, 67 [NASA ADS] [CrossRef] [Google Scholar]
- Kovač, K., Oosterloo, T. A., & van der Hulst, J. M. 2009, MNRAS, 400, 743 [CrossRef] [Google Scholar]
- Kraan-Korteweg, R. C., & Tammann, G. A. 1979, Astron. Nachr., 300, 181 [NASA ADS] [CrossRef] [Google Scholar]
- Makarova, L., Karachentsev, I., Takalo, L. O., Heinaemaeki, P., & Valtonen, M. 1998, A&AS, 128, 459 [NASA ADS] [CrossRef] [EDP Sciences] [Google Scholar]
- Martin, D. C., Fanson, J., Schiminovich, D., et al. 2005, ApJ, 619, L1 [Google Scholar]
- McGaugh, S. S., & Schombert, J. M. 2014, AJ, 148, 77 [Google Scholar]
- Mihos, J. C., Keating, K. M., Holley-Bockelmann, K., Pisano, D. J., & Kassim, N. E. 2012, ApJ, 761, 186 [NASA ADS] [CrossRef] [Google Scholar]
- Müller, O., Rejkuba, M., Pawlowski, M. S., et al. 2019, A&A, 629, A18 [Google Scholar]
- Shaya, E. J., Tully, R. B., Hoffman, Y., & Pomarède, D. 2017, ApJ, 850, 207 [NASA ADS] [CrossRef] [Google Scholar]
- Tully, R. B., Shaya, E. J., Karachentsev, I. D., et al. 2008, ApJ, 676, 184 [Google Scholar]
- Zhang, C.-P., Zhu, M., Jiang, P., et al. 2024, Sci. Chin. Phys. Mech. Astron., 67, 219511 [CrossRef] [Google Scholar]
- Zhou, R., Zhu, M., Yang, Y., et al. 2023, ApJ, 952, 130 [CrossRef] [Google Scholar]
Appendix A: Cross-identification with the FASHI catalogue
Appendix B: HI profiles of the new Local Volume objects
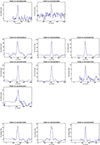 |
Fig. B.2. Continued. |
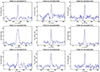 |
Fig. B.3. Continued. |
All Tables
All Figures
|
Fig. 1. Images of the 20 new dwarf galaxies identified with the FASHI radio sources. Most of the images are taken from the DESI Legacy Imaging Surveys. Each image side is 2′. North is up, and east is to the left. |
| In the text | |
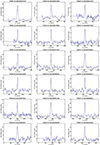 |
Fig. B.1. Profiles of 39 new LV HI sources from FASHI given in the same sequence as in Tables 1–3. |
| In the text | |
|
Fig. B.2. Continued. |
| In the text | |
|
Fig. B.3. Continued. |
| In the text | |
Current usage metrics show cumulative count of Article Views (full-text article views including HTML views, PDF and ePub downloads, according to the available data) and Abstracts Views on Vision4Press platform.
Data correspond to usage on the plateform after 2015. The current usage metrics is available 48-96 hours after online publication and is updated daily on week days.
Initial download of the metrics may take a while.