| Issue |
A&A
Volume 661, May 2022
|
|
|---|---|---|
| Article Number | A49 | |
| Number of page(s) | 6 | |
| Section | Stellar structure and evolution | |
| DOI | https://doi.org/10.1051/0004-6361/202243255 | |
| Published online | 02 May 2022 | |
Yet another star in the Albireo system
The discovery of Albireo Ad
1
Departamento de Astronomía, Universidad de Guanajuato, Callejón de Jalisco s/n, 36023 Guanajuato, GTO, Mexico
e-mail: This email address is being protected from spambots. You need JavaScript enabled to view it.
2
Sterrewacht Leiden, Universiteit Leiden, Niels Bohrweg 2, 2333 CA Leiden, The Netherlands
3
Hamburger Sternwarte, Universität Hamburg, Gojenbergsweg 112, 21029 Hamburg, Germany
4
Zentrum für Astronomie (Center for Astronomy), Heidelberg University, Mönchhofstr. 14, 69120 Heidelberg, Germany
Received:
3
February
2022
Accepted:
6
March
2022
Abstract
Context. Albireo is a well-known bright visual double star. It is still unclear if the components A and B form a gravitationally bound system. The component Albireo A is itself a binary star. The orbital parameters of the Albireo Aa, Ac system have been determined only recently. Thus, Albireo is still of interest for current research.
Aims. We aim to present evidence for the detection of a new member in the Albireo system. Furthermore, we aim to determine the orbital parameters and to find further conclusions for the Albireo system.
Methods. We used spectroscopic observations of Albireo A obtained with the TIGRE telescope and determined the radial velocities during a period of over three years. We analyzed the radial velocity curve with RadVel to determine the orbital parameters. In addition, we determined the stellar parameters of Albireo Aa with iSpec.
Results. We found clear evidence for yet another star in the Albireo system orbiting Albireo Aa with a period of about P = 371 days. Several alternative explanations for the periodic radial velocity signal could be discarded. The new companion Albireo Ad is a low mass star of about 0.085 M⊙.
Conclusions. We conclude that Albireo is a hierarchical multiple star system and remains an interesting object for future observations and studies.
Key words: stars: individual: Albireo / binaries: spectroscopic / techniques: radial velocities
© ESO 2022
1. Introduction
Albireo (β Cyg) is a very bright double star easily visible for small-sized telescopes, well-known among amateur astronomers, and an ideal object for public observations because of the very different colors of its components. It has been observed for over more than two centuries (Hass et al. 2016). However, there still exist many open questions about the origin, the components, and the orbital parameters of the Albireo system. Because of this, Albireo is still studied today and has been observed with many different methods (Scardia et al. 2007; Hartkopf 1999; Mason et al. 2013; Roberts & Mason 2018; Scardia 2019). There is the long-lasting question as to whether the two bright components Albireo A and B form a gravitationally bound system or not (Griffin 1999). The Gaia collaboration (Gaia Collaboration 2016) published improved parallaxes in the recent Data Release EDR3 (Gaia Collaboration 2021; Lindegren et al. 2021), and it seems that a gravitationally bound orbit is still possible because the parallaxes of the components A and B lie within a 2σ error. It is worth mentioning that Gaia, in general, has difficulties determining parallaxes of bright stars such as Albireo (Drimmel et al. 2019). In a thorough spectral analysis, Drimmel et al. (2021) have shown that Albireo A and B have about the same age and, therefore, might have at least a common origin. This conclusion is also supported by the discovery of a moving group containing four other fainter stars.
The star Albireo A is a binary system, which has been known for a long time (Maury & Pickering 1897; Clerke 1899). The spectrum is a composite of a K3II giant with a B9V companion (Markowitz 1969; Parsons & Ake 1998). This binary system has also recently been studied so as to understand its nature and to determine its properties (Jack et al. 2018; Bastian & Anton 2018; Drimmel et al. 2021). Drimmel et al. (2021) determined the orbital parameters of the Albireo Aa, Ac system combining a large set of long-term observations of the radial velocity (RV), astrometry, and speckle interferometry. They determined the orbital period of the Albireo Aa, Ac system to be about 122 years. Because of this long period, the uncertainties of the orbital parameters are still quite large. They detected the problem that the total mass of the Albireo A system was too high when compared to the masses determined by spectroscopic analysis. This “missing mass” must be hidden in the star Albireo Ac. They proposed that Albireo Ac might be a binary system either consisting of two very similar main sequence stars or that there is an invisible black hole component. This indicates that there exists at least one further object in the Albireo system.
In addition, there have been reports about the detection of another close companion of Albireo Aa using speckle interferometry (Bonneau & Foy 1980; Prieur et al. 2002). However, the detections were only marginal so that the existence of the star Albireo Ab has not been confirmed and is still doubtful.
In conclusion, the number of objects in the Albireo system and their properties are still unclear. In this publication, we present the discovery of a new low mass star in the Albireo system orbiting Albireo Aa, which we detected with RV measurements.
2. Observations of Albireo A
We obtained a time series of optical spectra with the Heidelberg Extended Optical Range Spectrograph (HEROS) echelle spectrograph mounted on the 1.2 m Telescopio Internacional de Guanajuato Robótico Espectroscópico (TIGRE) telescope (Schmitt et al. 2014) in central Mexico. The spectrograph has a resolution of R ≈ 20 000 and covers the optical wavelength range from about 3800 to 8800 Å divided into two channels (red and blue) with a small gap of 120 Å between the two channels at around 5800 Å. We observed Albireo A for over three years. All spectra were obtained with a high signal-to-noise ratio (S/N) between 200 and 400. One goal of this study was to determine the RVs of Albireo Aa. We used the method described in detail in Mittag et al. (2018). This method has also been successfully used in studies of spectroscopic binary stars (Jack et al. 2020, 2022).
The observed spectra of Albireo A are composite spectra that contain contributions from the two stars Albireo Aa and Ac (see Drimmel et al. 2021 for a complete TIGRE spectrum of Albireo A). The contribution from Albireo Ac is only visible in the blue channel of HEROS because it is a B type main sequence star. The main contribution in the red channel of the HEROS spectrograph comes from the K red giant Albireo Aa. The method to determine RVs uses only spectral lines in the red channel so that all the lines correspond to Albireo Aa.
We observed Albireo A for over three years and detected a clear variation in its RV. We present all values of the RV measurements in Table 1, where we list the RV in km s−1 in terms of the Julian date (JD). First, we checked for a possible periodicity in the RV measurements generating a Lomb-Scargle periodogram that we demonstrate in Fig. 1. There is a clear and strong peak at around 370 days, which indicates a periodic signal in the RV curve. The Fourier analysis gave a best period of 373.02 days. Below, we plotted the window function, where the peak disappeared indicating that it is not just a seasonal effect.
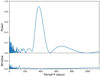 |
Fig. 1. Lomb-Scargle periodogram of the RV measurements of Albireo Aa showing a clear peak around 370 days. The graph below shows the window function, where the peak disappeared. |
RV measurements of Albireo Aa in terms of the Julian date (JD) obtained with optical spectra using the TIGRE telescope.
With a periodicity so close to the terrestrial year, instrumental effects by seasonal influences must rightfully be suspected, and the spectrograph temperature is the first issue that comes to mind. Nevertheless, the variations of the spectrograph temperature at each take of a spectrum (see Fig. 2) show no periodicity anywhere near a yearly cycle. Furthermore, it is important to note that the larger temperature variations in the first year of our observations was stopped by the installation of a second stage air conditioning of the spectrograph and its encapsulation, significantly improving the temperature stability for the latter years. There is no noticeable change or scatter of the RV measurements between those in the first and those in the remaining periods observed. This is additional proof that the RV recordings are real and not influenced by instrumental or seasonal effects. Finally, we point out that in the same time interval, and with the same instrumentation and reduction procedures, we measured RVs for about 50 other stars – and none of them showed any periodicity close to one year.
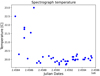 |
Fig. 2. Temperature of the spectrograph during the TIGRE observations of Albireo. |
We determined the stellar parameters of Albireo Aa with our improved method with iSpec as described in detail in Rosas-Portilla et al. (2022). We used the stellar parameters of Drimmel et al. (2021) as input parameters and performed a set of 27 fit calculations using the new method. This improved method more consistently determines the values for the surface gravity log g, and for the rotational and turbulence velocities. These values are required for our analysis.
We present the results of our spectral analysis in Table 2. The effective temperature Teff has hardly changed in comparison to Drimmel et al. (2021). The value for the surface gravity (log g = 1.7) is now consistent with the value calculated based on the parallax. The metallicity [M/H] is slightly lower. The primary goal was to determine the rotational velocity, which has a value of vrot sin i = 4.45 km s−1. Using the value for log g and assuming a mass of 5.2 M⊙, we obtained a radius of 55 R⊙ for Albireo Aa.
Stellar parameters of Albireo Aa determined with an improved method.
3. The orbital parameters of Albireo Ad
We analyzed the RV measurements of Albireo Aa using the Radial Velocity modeling toolkit (Fulton et al. 2018, RadVel, version 1.4.9) that models RV data using the method of Bayesian inference. This toolkit fits Keplerian orbits to observed RV curves and determines the six orbital parameters, which are the orbital period P, the time of inferior conjunction Tc, eccentricity e, semi-amplitude K, the argument of the periapsis of the star’s orbit ω, and the RV of the system vrad. To obtain an estimation of the uncertainties, RadVel contains the Markov-chain Monte Carlo (MCMC) package of Foreman-Mackey et al. (2013).
Because Albireo Aa is a member of a binary system with Albireo Ac, which has an orbital period of about 122 years (Drimmel et al. 2021), there is a slow change in the measured RV during the time of our observation campaign. The orbit determined by Drimmel et al. (2021) has large uncertainties, especially during the period of our observations (2018 to 2021). In their Fig. 6, the possible orbits may differ in up to 3 km s−1 in the RVs around the year 2020. This is larger than the semi-amplitude of the orbit. Therefore, we decided to fit the effect of an RV change induced by Albireo Ac using the dvdt parameter of RadVel, which fits a linear change to the observed RV curve.
In Table 3, we list the orbital parameters determined with RadVel. The errors were obtained with an MCMC run using 100 walkers and 20 000 steps. The orbital period of the discovered companion Albireo Ad is P ≈ 371 days. The semi-amplitude with K = 0.341 km s−1 is quite small, but still above the detection limit of 0.1 km s−1 of HEROS/TIGRE (Mittag et al. 2018). The orbit is within the error circular (e = 0.062 ± 0.057) and, therefore, we could not determine the argument of the periapsis of the star’s orbit ω. It is important to note that the determined RV of the system (vrad = −25.158 ± 0.019 km s−1) is not the systemic RV of the Albireo Aa, Ad system because it includes the effect of Albireo Ac.
Orbital parameters of Albireo Ad.
Considering the orbit of Albireo Ac with a period of 122 years and a semi-amplitude of 2.91 km s−1, one obtains an average change of 0.00026 km s−1 per day, which is consistent with the fitted value of dvdt. The general trend of an increasing RV is also correct because the RV curve of Albireo Aa, Ac passed through the minimum a few years ago (around 2010). It is important to keep in mind that the best fit RV curve of Drimmel et al. (2021) is not very well defined.
We present the complete RV curve and the RadVel fit of Albireo Aa in Fig. 3. Subplot a shows the complete data set of the TIGRE RV measurements. The solid line represents the RadVel fit. The residuals are shown in subplot b. Here, the solid line includes the linear trend of the fitted dvdt parameter. The phase-folded RV curve is demonstrated in subplot c. The part around phase 0.0 has no RV measurements because the period of the signal is very close to one year, and Albireo Aa was not observable during that phase.
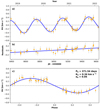 |
Fig. 3. RV curve of Albireo Aa with the fit curve obtained with RadVel. |
There exist published measurements of RVs of Albireo Aa for over a decade in the literature (Drimmel et al. 2021). The oldest measurements obviously have a very large uncertainty. We took a closer look into the 14 RV measurements obtained with CORAVEL on the 1-m Swiss telescope at the Haute-Provence Observatory (Famaey et al. 2005). Unfortunately, the CORAVEL RV data still have a scatter that is too large to detect any clear RV variation in the range of the amplitude of Albireo Ad. In Fig. 4, we present the CORAVEL data. We corrected the data for a linear trend caused by Albireo Ac. The color-coding according to the observation epoch clearly shows that there is no other trend in the data. Thus, we could not use the CORAVEL data to further constrain the period of the Albireo Ad orbit.
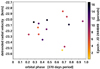 |
Fig. 4. RV measurements of CORAVEL. Vertical axis: CORAVELe RV after subtraction of a linear trend. Horizontal axis: Epochs phased with 370 days. Color: Epoch (in units of 370 days), to make any remaining trends visible. |
4. The mass of Albireo Ad
We calculated the mass function f of the Albireo Aa, Ad system using the known formula
 (1)
(1)
where G represents the gravitational constant, MAa and MAd are the masses of Albireo Aa and Ad, respectively, and i is the inclination of the orbit. The value f = 0.00000152 ± 0.00000036 M⊙ is quite small, indicating a small mass for the companion. We assumed a value of MAa = 5.2 ± 0.1 M⊙ for the stellar mass of Albireo Aa (Drimmel et al. 2021). Solving the above equation, we calculated the minimal mass of Albireo Ad to be MAd sin i = 0.0345 ± 0.0026 M⊙. This corresponds to about 36 Jupiter masses (MJ). We assumed that the inclinations i of the Albireo Ac and the Albireo Ad orbits are the same. Tokovinin (2017) found a strong tendency of orbit alignment in triple stars when the members are within 50 AU. With the inclination i = 156.15° (Drimmel et al. 2021), the mass of Albireo Ad is MAd = 0.085 ± 0.007 M⊙. Using the Kepler’s law equations, the maximal orbital separation of the two stars is about 1.9 AU. Assuming a distance of approximately 120 pc to Albireo A, the angular separation in the sky is 0.0157 arcsec.
Kervella et al. (2019) found a signal in their analysis of proper motion anomaly in Gaia DR2 data. They determined a secondary mass of  . This signal of an anomaly in the proper motion can be caused by both the distant companion Albireo Ac or the newly discovered close companion Albireo Ad. Since the proper motion anomaly is actually a vector, the measured effect is a combination of the influences from both companion stars. The relation between the Kervella et al. (2019) mass
  and the actual mass m2 is given by
  , with r being the orbital radius. For Albireo Ac, we have r = 48 AU and m2 = 2.7 M⊙ = 2828.44 MJ. The contribution from Albireo Ac is, therefore,
  , which coincides with the signal found by Kervella et al. (2019) very well. We performed the same exercise for Albireo Ad, with r = 1.9 AU and m2 = 0.085 M⊙ = 89 MJ. The contribution from Albireo Ad to the signal of a proper motion anomaly found by Kervella et al. (2019) is just
  . In addition, as described in Kervella et al. (2019), there is a smearing factor γ, which in the case of Albireo Ad is γ = 0.1. Thus, the final observable signal is just 6.5 MJ. This means that the signal found in Kervella et al. (2019) almost completely originates in the influence from Albireo Ac, and there is no contribution from Albireo Ad.
5. Discussion
We first checked if our detected star is actually the already reported star Albireo Ab and found that this is not the case because the angular separations are too different. We found a maximal angular separation of 0.0158 arcsec for Albireo Ad from Aa. The angular separations reported for the detections of Albireo Ab are 0.125 arcsec (Bonneau & Foy 1980) and 0.045 arcsec (Prieur et al. 2002). Even the smallest measurement is already three times larger than the maximal angular separation for Albireo Ad. Thus, our detected star cannot be Albireo Ab. Using Kepler’s third law (T2 ∝ a3), the expected period of the Albireo Ab orbit should be at least 5.2 years. We did not detect any signal of that period in our RV curve, but the HEROS instrument is probably not sensitive enough.
The new iSpec method for the determination of stellar parameters of Rosas-Portilla et al. (2022) now gives more reliable values for the rotational velocities of stars. The determined rotational velocities have a factor of sin i because of the inclination of the rotational axis, which is unknown. Based on the rotational velocity determined with iSpec of vrot = 4.45 km s−1, we calculated the rotation period assuming a radius of 55 R⊙. The result is a rotation period of about 618 days. This is the maximum of the rotation period, and depending on the inclination the rotation period can be shorter.
Another way to check if we somehow detected the signal of stellar rotation instead of the one of the orbit of a companion star is by stellar activity. We checked for periodic variations in the common activity indicators. The TIGRE telescope has a data reduction pipeline that determines the S-index (Mittag et al. 2016), which is a measure for the magnetic activity of the Ca II H&K lines. We found a small peak (≈0.4) in the Lomb-Scargle periodogram at 370 days. However, this part of the spectrum is completely dominated by the flux of Albireo Ac. The routine that measures the S-index obviously corrects for the RV of Albireo Aa. This introduces variations into the S-index, because the flux of Ac is falsely shifted in wavelength and, therefore, in the window that is used to determine the S-index. Because the RV correction has the variation of the orbital period, it obviously causes this false signal.
Variations of the RV in stars caused by stellar activity (star spots) are a widely known problem for the detection of exoplanets. Several studies have been performed to quantify this effect (Saar & Donahue 1997; Desort et al. 2007). As in the case of a companion, the signal is a sine curve, but there are usually jumps (phase shifts) in the signal because of the appearance and disappearance of the star spots or active regions. We did not detect any phase shifts during over three years of RV observations. The expected variations caused by stellar activity have normally peak-to-peak amplitudes of at most 0.1 km s−1 (Saar & Donahue 1997). This is below our detected RV signal with a peak-to-peak amplitude of 0.68 km s−1. Thus, the detected signal of RV variations is caused by the orbital movement of a companion star and cannot come from stellar activity on Albireo Aa.
We may comfortably exclude the possibility of a pulsation or oscillation for the RV signal. The former possibility can be excluded by the absence of a matching photometric signal in the HIPPARCOS data (van Leeuwen 2007). If there were any pulsations of Albireo Aa, then a brightness change should be observed. As shown in Fig. 5, the periodogram of the HIPPARCOS photometry data has no peak at all. This can also be seen in Fig. 6 where the phase-folded photometry of Albireo A is presented. The idea of an oscillation is excluded by the expected period being much shorter – after all, Albireo Aa is a much more compact giant than a Mira star. According to Kjeldsen & Bedding (1995), the frequency of the maximum-amplitude oscillation, vmax, of a star (which is the well-known 5-min mode of the Sun) mainly depends on gravity g and effective temperature Teff by being proportional to  . Using the physical parameters of Albireo Aa listed in Table 2, vmax of Albireo Aa is exactly 500 times smaller than the 5-min oscillation of the Sun, meaning a period of 1.74 days.
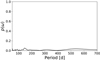 |
Fig. 5. Lomb-Scargle periodogram of the HIPPARCOS photometry of Albireo A. There are no periodic variations. |
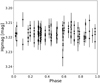 |
Fig. 6. HIPPARCOS photometry data of Albireo A folded with the 371 days period show no variations. |
The orbital period of 371 days is very close to one year. Because Albireo A is at least a triple system, there must be a large difference between the orbits of Ac and Ad, so that the system is gravitationally stable. The existence of the star Albireo Ab would actually disturb this configuration, making the system unstable.
Drimmel et al. (2021) found evidence that Albireo Ac itself is a binary system. They determined the mass ratio of Albireo Aa and Ac, and it indicates a “missing mass” for Albireo Ac. In this work, we discovered a new star in the Albireo A system that obviously changes the mass distribution. However, the additional mass is very small (0.085 M⊙) and has no effect on the mass problem of the Albireo Aa, Ac system.
In passing, we note that – depending on the unknown orientation of the Albireo Ad orbit, that is to say depending on its projection onto the celestial sphere – the 371-day period does modify the astrometrically measured parallax of Albireo A. If the inclination of the orbit is indeed about 156 degrees and if the semi-major axis is thus about 16 mas, then the radius of the Aa orbit around the common center of mass is about 0.25 mas. If the inclination is farther from 90 or 270 degrees, that is if the actual mass of Ad is higher than 0.085 M⊙, the astrometric orbit of Aa is correspondingly larger. The parallaxes of Albireo A and B, as published in Gaia eDR3, are 8.98 ± 0.45 mas and 8.19 ± 0.08 mas, respectively. The difference of 0.79 mas is a bit less than twice the combined uncertainty. The astrometric effect of the newly discovered component Ad might possibly explain a significant part of this difference.
6. Conclusions
The famous bright multiple stellar system Albireo remains an object of interest, to which it is worth dedicating further observations and studies. In our analysis of the RV curve of Albireo Aa, we detected a clear signal of a new member of the system. Albireo Ad is a star with a mass of 0.085 M⊙ orbiting the giant star Albireo Aa with a period of P = 371 days. The orbit is close to circular and has a small semi-amplitude of 0.34 km s−1.
We conclude that the Albireo system has a clear hierarchical structure. There is the possible gravitational connection between Albireo A and B. Albireo A is a multiple stellar system. The companion Albireo Ac is probably a binary star (Drimmel et al. 2021). In addition, the new member Albireo Ad has a close orbit to Albireo Aa. With the discovery of the new star Albireo Ad, the existence of Albireo Ab is very unlikely.
Acknowledgments
This research has been made possible by the CONACyT-DFG bilateral grant No. 278156. We thank the University of Guanajuato for the grants for the projects 036/2021 and 105/2021 of the Convocatoria Institucional de Investigación Científica 2021 and 2022. This work has made use of data from the European Space Agency (ESA) mission Gaia (https://www.cosmos.esa.int/gaia), processed by the Gaia Data Processing and Analysis Consortium (DPAC, https://www.cosmos.esa.int/web/gaia/dpac/consortium). Funding for the DPAC has been provided by national institutions, in particular the institutions participating in the Gaia Multilateral Agreement. This research has made use of the VizieR catalogue access tool, CDS, Strasbourg, France (Ochsenbein et al. 2000).
References
- Bastian, U., & Anton, R. 2018, A&A, 620, L2 [NASA ADS] [CrossRef] [EDP Sciences] [Google Scholar]
- Bonneau, D., & Foy, R. 1980, A&A, 86, 295 [NASA ADS] [Google Scholar]
- Clerke, A. M. 1899, The Observatory, 22, 387 [NASA ADS] [Google Scholar]
- Desort, M., Lagrange, A. M., Galland, F., Udry, S., & Mayor, M. 2007, A&A, 473, 983 [CrossRef] [EDP Sciences] [Google Scholar]
- Drimmel, R., Bucciarelli, B., & Inno, L. 2019, Res. Notes Am. Astron. Soc., 3, 79 [Google Scholar]
- Drimmel, R., Sozzetti, A., Schröder, K.-P., et al. 2021, MNRAS, 502, 328 [NASA ADS] [CrossRef] [Google Scholar]
- Famaey, B., Jorissen, A., Luri, X., et al. 2005, A&A, 430, 165 [CrossRef] [EDP Sciences] [Google Scholar]
- Foreman-Mackey, D., Hogg, D. W., Lang, D., & Goodman, J. 2013, PASP, 125, 306 [Google Scholar]
- Fulton, B. J., Petigura, E. A., Blunt, S., & Sinukoff, E. 2018, PASP, 130 [Google Scholar]
- Gaia Collaboration (Prusti, T., et al.) 2016, A&A, 595, A1 [NASA ADS] [CrossRef] [EDP Sciences] [Google Scholar]
- Gaia Collaboration (Brown, A. G. A., et al.) 2021, A&A, 650, C3 [EDP Sciences] [Google Scholar]
- Griffin, R. F. 1999, JRASC, 93, 208 [NASA ADS] [Google Scholar]
- Hartkopf, W. I. 1999, IAU Commission Double Stars, 139, 2 [Google Scholar]
- Hass, J., Phung, K., Carro, J., et al. 2016, J. Double Star Obs., 12, 204 [NASA ADS] [Google Scholar]
- Jack, D., Schröder, K.-P., & Bastian, U. 2018, Res. Notes Am. Astron. Soc., 2, 225 [Google Scholar]
- Jack, D., Hernández Huerta, M. A., & Schröder, K.-P. 2020, Astron. Nachr., 341, 616 [NASA ADS] [CrossRef] [Google Scholar]
- Jack, D., Hernández Huerta, M. A., Rosas Portilla, F. D., & Schröder, K.-P. 2022, Astron. Nachr., 343, e10015 [CrossRef] [Google Scholar]
- Kervella, P., Arenou, F., Mignard, F., & Thévenin, F. 2019, A&A, 623, A72 [NASA ADS] [CrossRef] [EDP Sciences] [Google Scholar]
- Kjeldsen, H., & Bedding, T. R. 1995, A&A, 293, 87 [NASA ADS] [Google Scholar]
- Lindegren, L., Klioner, S. A., Hernández, J., et al. 2021, A&A, 649, A2 [EDP Sciences] [Google Scholar]
- Markowitz, A. H. 1969, Ph.D. Thesis, THE Ohio State University [Google Scholar]
- Mason, B. D., Hartkopf, W. I., & Hurowitz, H. M. 2013, AJ, 146, 56 [NASA ADS] [CrossRef] [Google Scholar]
- Maury, A. C., & Pickering, E. C. 1897, Ann. Harvard College Obs., 28, 1 [Google Scholar]
- Mittag, M., Schröder, K. P., Hempelmann, A., González-Pérez, J. N., & Schmitt, J. H. M. M. 2016, A&A, 591, A89 [NASA ADS] [CrossRef] [EDP Sciences] [Google Scholar]
- Mittag, M., Hempelmann, A., Fuhrmeister, B., Czesla, S., & Schmitt, J. H. M. M. 2018, Astron. Nachr., 339, 53 [NASA ADS] [CrossRef] [Google Scholar]
- Ochsenbein, F., Bauer, P., & Marcout, J. 2000, Astron. Astrophys. Suppl. Ser., 143, 23 [NASA ADS] [CrossRef] [EDP Sciences] [Google Scholar]
- Parsons, S. B., & Ake, T. B. 1998, ApJS, 119, 83 [NASA ADS] [CrossRef] [Google Scholar]
- Prieur, J. L., Koechlin, L., Ginestet, N., et al. 2002, ApJS, 142, 95 [NASA ADS] [CrossRef] [Google Scholar]
- Roberts, L. C., & Mason, B. D. 2018, MNRAS, 473, 4497 [CrossRef] [Google Scholar]
- Rosas-Portilla, F. D., Schröder, K. P., & Jack, D. 2022, ArXiv eprints [arXiv:2203.16593] [Google Scholar]
- Saar, S. H., & Donahue, R. A. 1997, ApJ, 485, 319 [Google Scholar]
- Scardia, M. 2019, IAU Commission G1, 198, 3 [Google Scholar]
- Scardia, M., Prieur, J. L., Pansecchi, L., et al. 2007, MNRAS, 374, 965 [NASA ADS] [CrossRef] [Google Scholar]
- Schmitt, J. H. M. M., Schröder, K.-P., Rauw, G., et al. 2014, Astron. Nachr., 335, 787 [NASA ADS] [CrossRef] [Google Scholar]
- Tokovinin, A. 2017, ApJ, 844, 103 [NASA ADS] [CrossRef] [Google Scholar]
- van Leeuwen, F. 2007, A&A, 474, 653 [CrossRef] [EDP Sciences] [Google Scholar]
All Tables
RV measurements of Albireo Aa in terms of the Julian date (JD) obtained with optical spectra using the TIGRE telescope.
All Figures
|
Fig. 1. Lomb-Scargle periodogram of the RV measurements of Albireo Aa showing a clear peak around 370 days. The graph below shows the window function, where the peak disappeared. |
| In the text | |
|
Fig. 2. Temperature of the spectrograph during the TIGRE observations of Albireo. |
| In the text | |
|
Fig. 3. RV curve of Albireo Aa with the fit curve obtained with RadVel. |
| In the text | |
|
Fig. 4. RV measurements of CORAVEL. Vertical axis: CORAVELe RV after subtraction of a linear trend. Horizontal axis: Epochs phased with 370 days. Color: Epoch (in units of 370 days), to make any remaining trends visible. |
| In the text | |
|
Fig. 5. Lomb-Scargle periodogram of the HIPPARCOS photometry of Albireo A. There are no periodic variations. |
| In the text | |
|
Fig. 6. HIPPARCOS photometry data of Albireo A folded with the 371 days period show no variations. |
| In the text | |
Current usage metrics show cumulative count of Article Views (full-text article views including HTML views, PDF and ePub downloads, according to the available data) and Abstracts Views on Vision4Press platform.
Data correspond to usage on the plateform after 2015. The current usage metrics is available 48-96 hours after online publication and is updated daily on week days.
Initial download of the metrics may take a while.