| Issue |
A&A
Volume 590, June 2016
|
|
|---|---|---|
| Article Number | A117 | |
| Number of page(s) | 6 | |
| Section | Stellar structure and evolution | |
| DOI | https://doi.org/10.1051/0004-6361/201527920 | |
| Published online | 25 May 2016 | |
The fundamental parameters of the roAp star HD 24712
A rapidly oscillator at the red edge of the instability strip⋆
1
Univ. Grenoble Alpes, IPAG,
38000
Grenoble,
France
e-mail:
This email address is being protected from spambots. You need JavaScript enabled to view it.
2
CNRS, IPAG, 38000
Grenoble,
France
3
Instituto de Astrofísica e Ciências do Espaço, Universidade do
Porto, CAUP, Rua das
Estrelas, 4150-762
Porto,
Portugal
4
Institute for Astrophysics, Georg-August-University,
Friedrich-Hund-Platz 1,
37077
Göttingen,
Germany
5
Laboratoire Lagrange, Université Côte d’Azur, Observatoire de la
Côte d’Azur, CNRS, Bd de l’Observatoire, CS 34229, 06304
Nice Cedex 4,
France
6
CHARA Array, Mount Wilson Observatory,
91023
Mount Wilson
CA,
USA
Received: 8 December 2015
Accepted: 24 April 2016
Abstract
Context. There is still a debate about the nature of the mechanism that causes the pulsation excitation of the rapidly oscillating Ap stars that oscillate above the highest theoretically acoustic frequency. HD 24712 is a good test case for such a study because it is bright, its parallax accurately determined, and its frequency spectrum is well known.
Aims. Visible long-baseline interferometry is a unique technique for measuring accurate angular diameters of targets as small as the brightest roAp stars, and thus estimating accurate radii by a method as independent as possible of atmosphere models.
Methods. We used the visible spectrograph VEGA at the CHARA long-baseline optical array to observe HD 24712, and we derived its limb-darkened diameter. We also estimated its bolometric flux from spectroscopic data in the literature and determined its radius, luminosity, and effective temperature.
Results. We determined a limb-darkened angular diameter of 0.335 ± 0.009 mas for HD 24712 and derived a radius of R = 1.772 ± 0.057 R⊙, a luminosity of L = 7.2 ± 1.8 L⊙, and an effective temperature of Teff = 7235 ± 280 K, which is in very close agreement with the values provided by the self-consistent stratified model developed for this star. We used these fundamental parameters to set HD 24712 in the Hertzsprung-Russell diagram. Its position is marginally consistent with the region where high radial order modes are predicted to be excited by the κ-mechanism.
Conclusions. We conclude that oscillations in this star are most likely not driven by the κ-mechanism.
Key words: stars: fundamental parameters / stars: individual: HD 24712 / techniques: high angular resolution / techniques: interferometric
Based on observations made with the VEGA/CHARA spectro-interferometer.
© ESO, 2016
1. Introduction
HD 24712 (HR 1217; DO Eri) is a cool rapidly oscillating (roAp) Ap star whose 6.15 min light variation was discovered by Kurtz (1981) and whose radial velocity (RV) variations with an amplitude of 400 ± 50 m/s were detected by Matthews et al. (1988). Like all the Ap stars, it exhibits a strong large-scale organized magnetic field whose intensity is changing as the star rotates with a period of 12.46 days (Lüftinger et al. 2008). The recent study of Rusomarov et al. (2015) concludes that the magnetic field topology of HD 24712 has a dominant dipolar component with a very weak contribution from high orders. The authors derive a polar field strength Bp = 3440 G, an inclination angle between the line of sight and the stellar rotation axis of i = 120°, and an angle between the magnetic and rotation axes of β = 160°. Such a strong magnetic field can significantly affect the high-order p modes of the roAp oscillations in complex ways (Cunha 2007).
Log of the observations.
As an oscillating star, HD 24712 was several times observed by asteroseismology (Kurtz 1981; Matthews et al. 1988; Kurtz et al. 2005; Mkrtichian & Hatzes 2005). A main frequency of 2.721 mHz, a highest one of 2.806 mHz, and a large frequency separation of about 68 μHz have been identified. HD 24712 is thus one of twelve roAp stars discovered so far that oscillate above about 2 mHz and, as such, constitutes a good test case for the pulsation excitation models. Even if the observed frequencies can be fitted relatively well with theoretical frequencies for model stars whose positions on the Hertzsprung-Russell (HR) diagram are close to the position of HD 24712 (Cunha 2001; Cunha et al. 2003; Saio et al. 2010), no excited oscillation modes with frequencies appropriate for HD 24712 can be found. All the modes are damped, and the κ-mechanism in the hydrogen ionization area that is generally invoked to explain the excitation of pulsation modes in roAp stars (Balmforth et al. 2001; Cunha 2002) seems to be too weak to be able to excite super-critical high-order p modes. This seems to be common to the coolest roAp stars, and is similar in α Cir (Cunha et al. 2013) and HD 101065 (Mkrtichian et al. 2008), for instance. To better study the mechanism that is able to excite pulsations in such cool roAp stars, the radius is of primordial importance since the frequency region where modes are expected to be excited is very sensitive to the stellar radius (Cunha et al. 2013).
In roAp stars the strong magnetic field is assumed to stabilize the external layers and to partially or fully suppress the convection. This can lead to vertical and horizontal microscopic diffusion of the chemical elements and abnormal surface layers (Stift & Alecian 2012), which might generate systematic errors in the determination of stellar luminosities and effective temperatures by spectrometric and/or photometric techniques (Matthews et al. 1999). Moreover, Shulyak et al. (2009) have shown that stratification of chemical elements implies significant changes in the structure of the atmosphere model. This means that it is mandatory to determine accurate fundamental parameters by a method as independent as possible of an atmosphere model to test non-adiabatic pulsation models. Since modern interferometry working in the visible range allows targets as small as 0.2 milliseconds of arc (mas) to be resolved, we have started an observing program on roAp stars to accurately derive their fundamental parameters.
In this paper, we report our interferometric observations of HD 24712 with the VEGA instrument (Sect. 2). The observations allow a limb-darkened angular diameter to be derived. We then compute the stellar bolometric flux (Sect. 3) and derive its fundamental parameters and set it in the HR diagram (Sect. 4). Finally, we compare our results with those published in the literature (Sect. 5).
2. Interferometric observations and data processing
2.1. CHARA/VEGA observations
We observed HD 24712 with the VEGA instrument (Mourard et al. 2009) of the CHARA Array (Ten Brummelaar et al. 2010) and the instrument CLIMB (Sturmann et al. 2010) for group-delay sensing. We used different triplets of telescopes (S1S2E2, E1E2W2, and E1E2W1) to reach baselines spanning from ~30 m to ~300 m and allowing targets smaller than 0.3 mas to be resolved in the visible range. The observation log is given in Table 1. The corresponding baseline coverage (e.g. (u, v) plane) is displayed in the left panel of Fig. 1. The orientation of the longest baselines is either along PA = −110° or along PA = −150°. Our poor (u, v) plane coverage prevents us from analyzing the angular diameter variation with respect to the baseline orientation, which is not penalizing since HD 24712 is a very slow rotator, as are Ap stars in general. Its v sini is quoted to be 18 km s-1 in Royer et al. (2002) and, more recently, 5.8 km s-1 in Glebocki & Gnacinski (2005), and its inclination i equals 120° (Rusomarov et al. 2015), therefore no photosphere flattening is expected to be detectable. Our radius estimation is thus not biased by the rotational effect.
For the absolute calibration of the squared visibilities, we followed a sequence calibrator-target-calibrator and recorded 40 blocks of 2500 short exposures (of 10 ms) per star, which leads to a target swap every 20 min and ensures that the instrumental transfer function is stable enough. The calibrators were chosen to be close to the target, smaller than the target, and with a well-known angular diameter. All the observations were calibrated by two calibrators selected with the SearchCal tool (Bonneau et al. 2006)1 with rejection of multiplicity and variability flagged stars: HD 18883 (whose uniform angular diameter is taken as θUD(R) = 0.155 ± 0.011 mas) and HD 32296 (θUD(R) = 0.172 ± 0.012 mas) are thus clear for this, which of course does not exclude multiplicity because of their spectral types. As usual, the use of different calibrators and the control of the stability and coherence of the transfer function of the interferometer is the final test to guarantee the reliability of the calibration process. This is well the case in our program.
 |
Fig. 1 Left: (u, v) plane coverage of the VEGA observations of HD 24712 in the R and (red circles) and in the V band (blue circles). Right: squared visibility versus spatial frequency for HD 24712 obtained with the VEGA observations (diamonds) in the R band (red) and in the V band (blue) and best uniform-disk model provided by LITPRO for all the data points in the R band (case 1 – thick line) and for the whole data set (case 2 – thin line). |
2.2. VEGA data processing
The data were processed in different spectral bands of 15 nm each (their central wavelengths are given in Col. 7 of Table 1) using the standard V2 procedure of the VEGA instrument as described in Mourard et al. (2009). Our data processing is done in such a way that one calibrated visibility measurement is associated with a specific 15 nm spectral range. The wavelength domains we considered (on blue and red detectors) do not overlap and are thus totally independent. We followed the same processing as described in our previous papers (Perraut et al. 2011, 2013, 2015) to compute raw squared visibility for each block of 1000 individual frames and calibrated them using the known angular diameter of the calibrators. The final squared visibilities V2 and the corresponding errors are given in Table 1. The total error on the calibrated visibility consists of an intrinsic statistical error (σstat) and of a systematic error coming from the uncertainty on the angular diameter of the calibrator (σsyst). Even for the longest baselines (i.e., more than 200 m) the error bar is dominated by the statistical error.
2.3. Deriving the angular diameters
We used the JMMC fitting engine LITpro (Tallon-Bosc et al. 2008) that is based on a modified Levenberg-Marquardt algorithm2 to fit the visibility measurements (right panel of Fig. 1). Using all the data recorded in the R band (case 1) leads to a uniform-disk angular diameter θUD of 0.3225 ± 0.0085 mas for HD 24712. Adding the squared visibilities recorded at 552.5 nm (case 2) leads to an angular diameter of θUD of 0.3273 ± 0.0085 mas. We used the linear limb-darkening coefficients provided by Claret & Bloemen (2011) to derive the corresponding limb-darkened angular diameters θLD. For a solar metallicity and a null microturbulent velocity, we computed the coefficients u(V) and u(R) and the corresponding limb-darkened diameters when the effective temperature spans from 7000 K to 7500 K and log g from 4 to 4.5. These coefficients vary at the third decimal level when spanning the effective temperature and gravity ranges. By considering the average limb-darkening coefficient on our parameter space in the R band for case 1, e.g. u(R) = 0.468, we obtained a limb-darkened angular diameter of θLD = 0.335 ± 0.009 mas. For case 2 we considered a mean limb-darkening coefficient between u(R) and u(V) values, for instance u = 0.508 and obtained a limb-darkened angular diameter of 0.342 ± 0.009 mas. The two limb-darkened angular diameters are consistent together. We took θLD = 0.335 ± 0.009 mas for HD 24712 as a final value because peculiar stars have far fewer spectral features in the R band than in the V band. Therefore, the limb-darkening coefficients of peculiar stars in the R band will deviate less strongly from the computed values in models with normal chemical composition.
3. Computation of the bolometric flux
To compute the bolometric flux, fbol, of HD 24712 we followed the approach used in our previous works(see Perraut et al. 2011 for an example): first, we determined the spectral energy distribution (SED) of the star, and then we computed fbol, which is given by the area below the curve of that distribution. We started by collecting data available in the literature for HD 24712 and used them to determine the SED of the star; in regions where no data were available, we performed an interpolation with the Kurucz model whose synthetic magnitudes best fit the observed ones (Fig. 2).
 |
Fig. 2 Bolometric spectrum obtained for HD 24712. The black line represents the IUE flux and the purple line represents the Kurucz model that best fits the Geneva photometry (black circles) and 2MASS photometry (triangles). |
Observed fluxes for HD 24712 computed from Geneva and 2MASS photometry.
The apparent flux distribution of HD 24712 in the wavelength range from 912 Å to 1.6 × 10⁶ Å was determined by concatenating the following flux distributions:
-
For the ultraviolet (UV) region, we computed a single spectrum between 1851 Å and 2908 Å by combining three rebinned spectra from the Sky Survey Telescope obtained by the IUE Newly Extracted Spectra (INES) data archive3. Based on the quality flag listed in the IUE spectra (Garhart et al. 1997), we removed all bad pixels and measurements with negative flux from the data.
-
From the visible to the far-infrared, namely between 2910 Å to 1.6 × 10⁶ Å we considered a Kurucz model computed with ATLAS9 (Castelli & Kurucz 2004). This model was chosen to fit the observed Geneva photometry of HD 24712 (we disregarded the U band of Geneva as we have IUE in that region of the spectrum) and the photometric data from the 2MASS All Sky Catalog of point sources (Cutri et al. 2003).To find the model that best fits the observed photometry of the star, we started by constructing a grid of Kurucz models with different values of Teff, log g, and [Fe/H]. We used the angular diameter given in Sect. 2.2 to calibrate Kurucz models since they give the flux of the star and not the flux observed on Earth. For each model, we computed synthetic fluxes using filter profiles and zero points for Geneva and 2MASS photometry given by Cutri et al. (2003) and by Cohen et al. (2003), respectively. They were then compared to the observed fluxes (converted from the observed magnitudes), and we selected the best model corresponding to the lowest chi-square value (Table 2).
-
At the left extreme of the spectral distribution, we performed a linear interpolation (on a logarithmic scale) between 912 Å and 1842 Å, considering zero flux at 912 Å.
Finally, we found a bolometric flux of (1.03 ± 0.15) × 10-7 erg cm2 s-1 for this star, a photometric angular diameter of 0.339 mas, and an effective temperature of Teff = 7200 K. The uncertainty associated with the bolometric flux was estimated by considering a 10% uncertainty on the flux computed from the combined IUE spectra, and a conservative 15% was considered both on the Kurucz model flux and on the flux derived from interpolation.
4. Determination of the fundamental parameters
4.1. Linear radius
From the parallax (πP = 20.32 ± 0.39 mas; van Leeuwen 2007) and our limb-darkened angular diameter θLD we derived the radius of HD 24712 and its error through a Monte Carlo simulation:  (1)We obtained R = 1.772 ± 0.057 R⊙, hence an accuracy of 3% on the radius determination.
4.2. Luminosity and effective temperature
We used the parallax and the bolometric flux to derive the luminosity through a Monte Carlo method:  (2)where C is the conversion from parsecs to cm (3.086 × 10¹⁸), and πp the parallax in seconds. We found L = 7.8 ± 1.2 L⊙.
We used the measured angular diameter and bolometric flux to estimate the effective temperature through the equation  (3)where σ stands for the Stefan-Boltzmann constant (5.67 × 10⁻⁵ erg cm-2 s-1 K-4). We determined an effective temperature of 7235 ± 280 K.
4.3. Mass and age
We used the determined fundamental parameters to set our target in the Hertzsprung-Russell diagram (Fig. 3). With the isochrone tool CMD 2.74 we derived the mass and the age of HD 24712. Without knowing the metallicity of HD 24712, we first assumed Z = 0.019 and Y = 0.282 and obtained a mass of 1.59 ± 0.06 M⊙ and an age of 1.08 Gyr. Changing Z between 0.014 and 0.022 causes the mass of the best fit to change between 1.55 and 1.60 M⊙ and the age to change between 0.95 Gyr and 1.33 Gyr.
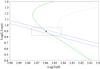 |
Fig. 3 Position of HD 24712 in the Hertzsprung-Russell diagram. The constraints on the fundamental parameters are indicated by the 1σ-error box (log (Teff, log (L/L⊙)) and the diagonal lines (radius). Evolutionary tracks are overplotted as green lines for Z = 0.019 and Y = 0.282, and ages of 1.08 Gyr (solid line), 0.8 Gyr, and 1.42 Gyr (dash-dotted lines). |
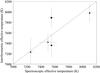 |
Fig. 4 Spectroscopic effective temperature vs. interferometric effective temperature for the five roAp stars for which accurate fundamental parameters have been determined and modeled: HD 24712 (diamond), α Cir (star), γ Equ (circle), 10 Aql (square), and β CrB (triangle). |
5. Discussion and conclusion
Taking advantage of the unique angular resolution of the CHARA array when coupled with a visible instrument, we clearly resolved the roAp star HD 24712.The limb-darkened angular diameters we derived from our interferometric measurements on one side (0.335 ± 0.009 mas), and from the SED fit on the other side (0.339 mas), agree closely. In addition, the limb-darkened angular diameter and the radius that we derived from our VEGAdata are identical to those computed with the self-consistent stratified model developed by Shulyak et al. (2009). By fitting the spectral energy distribution of HD 24712 with their model,which is clearly better suited to these peculiar stars than a standard model such as that of Kurucz, the authors derived an angular diameter of the star of 0.335 ± 0.005 mas, which, combined with the revised Hipparcos parallax, yields a radius of 1.772 ± 0.043 R⊙.
The effective temperatures we derived from the SED fit (Teff = 7200 K) and from the angular diameter measurement (Teff = 7235 K) agree very well with the effective temperature derived from the stratified model (Teff = 7250 K). When the latter instead of the Kurucz model is used for wavelengths ranging from the visible to the far-infrared, a bolometric flux of (1.04 ± 0.15) × 10-7 erg cm2 s-1 and an effective temperature Teff = 7200 K are derived, while using the stratified model for the whole spectral range leads to an effective temperature of Teff = 7250 K and thus to a maximum difference of about 50 K. This is well within the error bars.
As previously said, atmosphere models of Ap stars are extremely complex, and calibrating the effective temperature scale for these peculiar stars is crucial. Comparing the fundamental parameters of these stars derived from atmosphere models (i.e. spectroscopic determination) with those determined by a method as independent as possible of atmosphere model (i.e. interferometric determination) is an efficient way for better understanding the modeling of these stars and the processes at play. Figure 4 displays the effective temperature comparison for the five roAp stars for which interferometric effective temperature determination exists: α Cir (Bruntt et al. 2008), β CrB (Bruntt et al. 2010), γ Equ (Perraut et al. 2011), 10 Aql (Perraut et al. 2013), and HD 24712 (this work). A noticeable disagreement between spectroscopic and interferometric radii measurements was found only for 10 Aql. Based on ground-based data and atmospheric models, the derived spectroscopic values of stellar radii range between 2.59 R⊙ and 2.72 R⊙, as discussed in Nesvacil et al. (2013). Interferometric estimates resulted in a radius of 2.32 ± 0.09 R⊙. However, this interferometric radius results in an effective temperature of the star that is too high to fit spectroscopic observables such as hydrogen Balmer line profiles or the slope of the Paschen continuum. We note that 10 Aql owns an atmospheric structure that is very similar to two other Ap stars, γ Equ and α Cir. But interferometric and spectroscopic measurements agree very well for these stars. The difference between 10 Aql and γ Equ and α Cir is the smaller log g and weaker surface magnetic field, but it is difficult to envision this to introduce serious biases in the spectroscopic analysis. We therefore conclude that 10 Aql clearly required additional investigation. Even if interferometric determination is not biased by spots that are clearly unresolved by our baselines, the determination of the limb-darkened angular diameter through limb-darkening coefficients might be prone to some inaccuracies and/or sensitive to chromatic effects especially for these peculiar stars. As an example, considering the limb-darkened angular diameter of 0.342 ± 0.009 mas obtained for HD 24712 with the data in the R and V bands (case 2) leads to an effective temperature of 7160 K, which clearly remains consistent with the value obtained in case 1, but is 75 K lower. Therefore we may expect a similar or even stronger effect of peculiar chemistry for 10 Aql on the determination of the limb-darkened angular diameter from interferometric data. This will be investigated in future works.
 |
Fig. 5 Five roAp stars for which accurate fundamental parameters have been determined based on interferometric data are overplotted on the roAp star theoretical instability strip derived by Cunha (2002). The 1σ-error box (log (Teff), log (L/L⊙)) and the 1σ radius limits are shown for HD 24712. The other four stars are, in order of increasing luminosity, α Cir, γ Equ, 10 Aql, and β CrB. Small open circles show models where high radial order pulsations were found to be excited. The numbers next to each open circle indicate the characteristic frequency in mHz excited in the corresponding model. |
The fundamental parameters of roAp stars are important input also for testing models of pulsation excitation. Adopting the parameters derived in this work, we show in Fig. 5 the position of HD 24712 with respect to the roAp star instability strip computed by Cunha (2002). This theoretical instability strip was derived from a linear non-adiabatic analysis of models in which envelope convection was assumed to be suppressed by the magnetic field and the driving of the oscillations results from the κ-mechanism acting on the hydrogen ionization region. The positions of the other roAp stars for which interferometric radii have been determined are also shown in the figure. HD 24712 appears at the red edge of the instability strip, its position is marginally consistent with the region of the HR diagram where high radial order modes are predicted to be excited by the κ-mechanism. However, inspection of the characteristic pulsation frequencies excited (shown in mHz by the numbers plotted next to the open circles) indicates that the oscillations expected for a star with the radius of HD 24712 have frequencies lower than the 2.6−2.8 mHz range observed. We therefore conclude that oscillations in this star are likely driven by a different excitation mechanism. A similar conclusion has been reached by Cunha et al. (2013) when considering the oscillations observed in the roAp star α Cir. As suggested at the time, and also by Antoci et al. (2014) when considering the higher frequency pulsations observed in the δ Scuti star HD 187547, a possible alternative would be that these oscillations are still excited in the hydrogen ionization region, but by the perturbation of the turbulent pressure, not by the opacity. Testing this possibility will require addressing the complex dynamics associated with high-frequency oscillations in the strongly magnetic atmospheres of roAp stars.
Available at www.jmmc.fr/searchcal
Acknowledgments
VEGA is supported by French programs for stellar physics and high angular resolution PNPS and ASHRA, by the Nice Observatory and the Lagrange Department. The CHARA Array is funded through NSF grants AST-0908253 and AST 1211129 and by Georgia State University through the College of Arts and Sciences. This work has been supported by a grant from LabEx OSUG@2020 (Investissements d’avenir – ANR10LABX56) and made use of funds from the ERC through the project FP7-SPACE-2012-312844. I.B. acknowledges financial support from the FCT through the grant SFRH/BPD/87857/2012. M.S.C. acknowledges the support of the Fundação para a Ciência e a Tecnologia (FCT) through the Investigador FCT contract of reference IF/00894/2012 and by POPH/FSE (EC) through FEDER funding through the program COMPETE. Funding for this work was also provided by the FCT grant UID/FIS/04434/2013 and by EC, under FP7, through the grant agreement FP7-SPACE- 2012-312844. D.S. acknowledges support from CRC 963 – Astrophysical Flow Instabilities and Turbulence (project A16-A17) and Fizeau optical interferometry program (2015B). This research has made use of the SearchCal and LITPRO services of the Jean-Marie Mariotti Center, and of CDS Astronomical Databases SIMBAD and VIZIER.
References
- Antoci, V., Cunha, M., Houdek, G., et al. 2014, ApJ, 796, 118 [NASA ADS] [CrossRef] [Google Scholar]
- Balmforth, N. J., Cunha, M. S., Dolez, N., Gough, D. O., & Vauclair, S. 2001, MNRAS, 323, 362 [NASA ADS] [CrossRef] [Google Scholar]
- Bonneau, D., Clausse, J.-M., Delfosse, X., et al. 2006, A&A, 456, 789 [NASA ADS] [CrossRef] [EDP Sciences] [Google Scholar]
- Bruntt, H., North, J. R., Cunha, M., et al. 2008, MNRAS, 386, 2039 [NASA ADS] [CrossRef] [Google Scholar]
- Bruntt, H., Kervella, P., Mérand, A., et al. 2010, A&A, 512, A55 [NASA ADS] [CrossRef] [EDP Sciences] [Google Scholar]
- Castelli, F., & Kurucz, R. L. 2004, ArXiv e-prints [arXiv:astro-ph/0405087] [Google Scholar]
- Claret, A., & Bloemen, S. 2011, VizieR Online Data Catalog: J/A+A/529/A75 [Google Scholar]
- Cohen, M., Wheaton, W. A., & Megeath, S. T. 2003, AJ, 126, 1090 [NASA ADS] [CrossRef] [Google Scholar]
- Cunha, M. S. 2001, MNRAS, 325, 373 [NASA ADS] [CrossRef] [Google Scholar]
- Cunha, M. S. 2002, MNRAS, 333, 47 [NASA ADS] [CrossRef] [Google Scholar]
- Cunha, M. S. 2007, Commun. Asteroseismol., 150, 48 [NASA ADS] [CrossRef] [Google Scholar]
- Cunha, M. S., Fernandes, J. M. M. B., & Monteiro, M. J. P. F. G. 2003, MNRAS, 343, 831 [NASA ADS] [CrossRef] [Google Scholar]
- Cunha, M. S., Alentiev, D., Brandão, I. M., & Perraut, K. 2013, MNRAS, 436, 1639 [NASA ADS] [CrossRef] [Google Scholar]
- Cutri, R. M., Skrutskie, M. F., van Dyk, S., et al. 2003, VizieR Online Data Catalog: II/246 [Google Scholar]
- Garhart, M. P., Smith, M. A., Turnrose, B. E., Levay, K. L., & Thompson, R. W. 1997, IUE NASA Newsletter, 57, 1 [NASA ADS] [Google Scholar]
- Glebocki, R., & Gnacinski, P. 2005, VizieR Online Data Catalog: III/244 [Google Scholar]
- Kurtz, D. W. 1981, IBVS, 1915, 1 [NASA ADS] [Google Scholar]
- Kurtz, D. W., Cameron, C., Cunha, M. S., et al. 2005, MNRAS, 358, 651 [NASA ADS] [CrossRef] [Google Scholar]
- Lüftinger, T., Kochukhov, O., Ryabchikova, T., et al. 2008, Contributions of the Astronomical Observatory Skalnate Pleso, 38, 335 [NASA ADS] [Google Scholar]
- Matthews, J. M., Wehlau, W. H., Walker, G. A. H., & Yang, S. 1988, ApJ, 324, 1099 [NASA ADS] [CrossRef] [Google Scholar]
- Matthews, J. M., Kurtz, D. W., & Martinez, P. 1999, ApJ, 511, 422 [NASA ADS] [CrossRef] [Google Scholar]
- Mkrtichian, D. E., & Hatzes, A. P. 2005, A&A, 430, 263 [NASA ADS] [CrossRef] [EDP Sciences] [Google Scholar]
- Mkrtichian, D. E., Hatzes, A. P., Saio, H., & Shobbrook, R. R. 2008, A&A, 490, 1109 [NASA ADS] [CrossRef] [EDP Sciences] [Google Scholar]
- Mourard, D., Clausse, J. M., Marcotto, A., et al. 2009, A&A, 508, 1073 [NASA ADS] [CrossRef] [EDP Sciences] [Google Scholar]
- Nesvacil, N., Shulyak, D., Ryabchikova, T. A., et al. 2013, A&A, 552, A28 [NASA ADS] [CrossRef] [EDP Sciences] [Google Scholar]
- Perraut, K., Brandão, I., Mourard, D., et al. 2011, A&A, 526, A89 [NASA ADS] [CrossRef] [EDP Sciences] [Google Scholar]
- Perraut, K., Borgniet, S., Cunha, M., et al. 2013, A&A, 559, A21 [NASA ADS] [CrossRef] [EDP Sciences] [Google Scholar]
- Perraut, K., Cunha, M., Brandão, I., et al. 2015, A&A, 579, A85 [NASA ADS] [CrossRef] [EDP Sciences] [Google Scholar]
- Royer, F., Grenier, S., Baylac, M.-O., Gomez, A. E., & Zorec, J. 2002, VizieR Online Data Catalog: J/A+A/339/897 [Google Scholar]
- Rusomarov, N., Kochukhov, O., Ryabchikova, T., & Piskunov, N. 2015, A&A, 573, A123 [NASA ADS] [CrossRef] [EDP Sciences] [Google Scholar]
- Saio, H., Ryabchikova, T., & Sachkov, M. 2010, MNRAS, 403, 1729 [NASA ADS] [CrossRef] [Google Scholar]
- Shulyak, D., Ryabchikova, T., Mashonkina, L., & Kochukhov, O. 2009, A&A, 499, 879 [NASA ADS] [CrossRef] [EDP Sciences] [Google Scholar]
- Stift, M. J., & Alecian, G. 2012, MNRAS, 425, 2715 [NASA ADS] [CrossRef] [Google Scholar]
- Sturmann, J., Ten Brummelaar, T., Sturmann, L., & McAlister, H. A. 2010, in SPIE Conf. Ser., 7734, 77343A [Google Scholar]
- Tallon-Bosc, I., Tallon, M., Thiébaut, E., et al. 2008, in SPIE Conf. Ser., 7013, 70131J [Google Scholar]
- Ten Brummelaar, T. A., McAlister, H. A., Ridgway, S. T., et al. 2010, in SPIE Conf. Ser., 7734, 773403 [Google Scholar]
- van Leeuwen, F. 2007, A&A, 474, 653 [NASA ADS] [CrossRef] [EDP Sciences] [Google Scholar]
All Tables
All Figures
|
Fig. 1 Left: (u, v) plane coverage of the VEGA observations of HD 24712 in the R and (red circles) and in the V band (blue circles). Right: squared visibility versus spatial frequency for HD 24712 obtained with the VEGA observations (diamonds) in the R band (red) and in the V band (blue) and best uniform-disk model provided by LITPRO for all the data points in the R band (case 1 – thick line) and for the whole data set (case 2 – thin line). |
| In the text | |
|
Fig. 2 Bolometric spectrum obtained for HD 24712. The black line represents the IUE flux and the purple line represents the Kurucz model that best fits the Geneva photometry (black circles) and 2MASS photometry (triangles). |
| In the text | |
|
Fig. 3 Position of HD 24712 in the Hertzsprung-Russell diagram. The constraints on the fundamental parameters are indicated by the 1σ-error box (log (Teff, log (L/L⊙)) and the diagonal lines (radius). Evolutionary tracks are overplotted as green lines for Z = 0.019 and Y = 0.282, and ages of 1.08 Gyr (solid line), 0.8 Gyr, and 1.42 Gyr (dash-dotted lines). |
| In the text | |
|
Fig. 4 Spectroscopic effective temperature vs. interferometric effective temperature for the five roAp stars for which accurate fundamental parameters have been determined and modeled: HD 24712 (diamond), α Cir (star), γ Equ (circle), 10 Aql (square), and β CrB (triangle). |
| In the text | |
|
Fig. 5 Five roAp stars for which accurate fundamental parameters have been determined based on interferometric data are overplotted on the roAp star theoretical instability strip derived by Cunha (2002). The 1σ-error box (log (Teff), log (L/L⊙)) and the 1σ radius limits are shown for HD 24712. The other four stars are, in order of increasing luminosity, α Cir, γ Equ, 10 Aql, and β CrB. Small open circles show models where high radial order pulsations were found to be excited. The numbers next to each open circle indicate the characteristic frequency in mHz excited in the corresponding model. |
| In the text | |
Current usage metrics show cumulative count of Article Views (full-text article views including HTML views, PDF and ePub downloads, according to the available data) and Abstracts Views on Vision4Press platform.
Data correspond to usage on the plateform after 2015. The current usage metrics is available 48-96 hours after online publication and is updated daily on week days.
Initial download of the metrics may take a while.