| Issue |
A&A
Volume 559, November 2013
|
|
|---|---|---|
| Article Number | A120 | |
| Number of page(s) | 6 | |
| Section | Interstellar and circumstellar matter | |
| DOI | https://doi.org/10.1051/0004-6361/201322425 | |
| Published online | 25 November 2013 | |
Research Note
VLA survey of 22 GHz H2O masers toward ten silicate carbon stars⋆,⋆⋆
1
Max-Planck-Institut für Radioastronomie,
Auf dem Hügel 69,
53121
Bonn,
Germany
e-mail:
kohnaka@mpifr.de
2
United States Naval Observatory, 3450 Massachusetts Avenue, NW, Washington, DC
20392-5420,
USA
3
National Science Foundation, 4201 Wilson Boulevard,
Arlington,
VA, 22230, USA
e-mail:
dboboltz@nsf.gov
4
Okayama Astrophysical Observatory, National Astronomical
Observatory, Kamogata, Asakuchi,
719-0232
Okayama,
Japan
5
European Southern Observatory, Karl-Schwarzschild-Str. 2, 85748
Garching,
Germany
Received: 1 August 2013
Accepted: 8 October 2013
Context. Despite their carbon-rich photospheres, silicate carbon stars show evidence of oxygen-rich circumstellar material, which is thought to exist in disks. Silicate carbon stars represent interesting cases that allow us to study the possible effects of binarity on stellar evolution and mass loss accompanied by the formation of disks.
Aims. We present a small survey of 22 GHz H2O masers toward ten silicate carbon stars with much better sensitivity than is the case for previous observations.
Methods. We observed our sample with the Karl G. Jansky Very Large Array (VLA) using the most expanded configuration (A-configuration) with a maximum baseline of 36 km. For some of our program stars with noisy Infrared Astronomical Satellite (IRAS) Low Resolution Spectra (LRS), we present new mid-IR spectra obtained with the Very Large Telescope Interferometer and the Spitzer Space Telescope.
Results. We detected H2O masers toward five out of ten silicate carbon stars (EU And, V778 Cyg, IRAS 06017+1011, V1415 Cyg, and NC83 = V1945 Cyg), with NC83 being a new detection. No H2O masers were detected toward BM Gem, IRAS 07221-0431, IRAS 08002-3803, IRAS 18006-3213, and HD 189605. The velocity separation between the most blue- and red-shifted maser features is 10–14 km s-1. If we assume that the masers originate in circum-companion disks, the measured velocity separations translate into a lower limit of the rotational velocity of 5–7 km s-1, and the upper limit of the radius of the maser emitting region is estimated to be 10–68 AU for a companion mass of 0.5–1.7 M⊙. The new mid-IR spectra of NC83, IRAS 06017+1011, and HD 189605 confirm the 10 μm silicate emission. The latter two stars show a bump at ~11.5 μm, which is presumably due to SiC originating in the ongoing mass loss from the carbon-rich primary star, not due to crystalline silicate. We also report on the detection of the UV flux at 2271 Å toward HD 189605.
Key words: radio lines: stars / techniques: interferometric / circumstellar matter / stars: carbon / stars: chemically peculiar / stars: AGB and post-AGB
© ESO, 2013
Our program stars.
1. Introduction
Silicate carbon stars are characterized by oxygen-rich circumstellar material in spite of their carbon-rich photospheres (Little-Marenin 1986; Willems & de Jong 1986). As summarized in Ohnaka et al. (2006, and references therein), a current hypothesis suggests that silicate carbon stars have a low-luminosity companion (a main-sequence star or a white dwarf) and that oxygen-rich material shed by past mass loss, when the primary star was an oxygen-rich giant, is stored in a circumbinary disk or in a circumstellar disk around the unseen companion until the primary star becomes a carbon star (Morris 1987; Lloyd-Evans 1990; Yamamura et al. 2000). However, the formation mechanisms of such circumbinary or circum-companion disks and their relation to binary parameters are unknown. Moreover, this scenario does not explain the following peculiar chemical composition of the photosphere of silicate carbon stars: highly enriched in 13C with 12C/13C ≈ 4–5, in marked contrast to 12C/13C ≳ 20 in normal carbon stars (Ohnaka & Tsuji 1999). This anomalous chemical composition is difficult to explain by standard stellar evolution theory and may be related to binarity (e.g., Zhang & Jeffery 2013; Sengupta et al. 2013). Thus, silicate carbon stars represent interesting cases that allow us to study the possible effects of binarity on stellar evolution and mass loss accompanied by the formation of disks.
High spatial resolution mid-IR (8–13 μm) observations with the mid-IR interferometric instrument MIDI at the ESO’s Very Large Telescope Interferometer (VLTI) have spatially resolved the dusty environment of silicate carbon stars and suggest the presence of circumbinary disks (Ohnaka et al. 2006; Deroo et al. 2007). On the other hand, our MIDI observations of the silicate carbon star BM Gem with a spatial resolution of 20 mas suggest the presence of a circum-companion disk (Ohnaka et al. 2008). Furthermore, Izumiura et al. (2008) detected significant emission shortward of ~4000 Å and Balmer lines with the P-Cyg profile in BM Gem, which strongly indicate an accretion disk around the putative companion.
Our 22 GHz water maser mapping of the silicate carbon star EU And with the Very Long Baseline Array (VLBA) shows that the masers are aligned with a slightly S-shaped structure along a straight line (Ohnaka & Boboltz 2008). This is similar to what is found in the silicate carbon star V778 Cyg by Szczerba et al. (2006) using MERLIN and by Engels (priv. comm.) using VLBA. Ohnaka & Boboltz (2008) as well as Szczerba et al. (2006) suggest that the masers likely originate in warped circum-companion disks viewed almost edge-on.
The maser imaging of more silicate carbon stars is indispensable for understanding the spatial structure of the oxygen-rich circumstellar material. To select objects appropriate for the detailed imaging with VLBA, we carried out a small survey of H2O masers at 22 GHz toward ten silicate carbons stars with the Karl G. Jansky Very Large Array (VLA). Our goal is to detect potential targets for future VLBA imaging with much better sensitivity than the previous observations in the literature.
Results of the VLA H2O maser observations of our program stars.
2. Observations and data reduction
Table 1 lists our ten program stars, which we selected from the list of confirmed silicate carbon stars in Engels (1994). From Table 3 of this paper, which consists of 13 stars, we excluded two stars, MC79-11 and CGCS3922. The star MC79-11 is too southern to observe from VLA. The identification of CGCS3922 as a silicate carbon star is not entirely established, as Lloyd-Evans (1991) notes. Besides, the star is included in a list of Li-rich “K giants” in De la Reza et al. (1997). We observed the remaining 11 stars, but the results of IRAS 07204-1032 (CGCS1682) will be presented in a separate paper together with VLBA imaging observations (Boboltz et al., in prep.). Five objects previously showed the H2O masers, as summarized in Table 1.
We observed the 616–523, 22.2 GHz transition of H2O using the VLA in A-configuration. The VLA is maintained and operated by the National Radio Astronomy Observatory (NRAO)1. We observed ten silicate carbon stars along with their respective extragalactic phase calibrators on 2007 August 19 and 20. We used a bandwidth of 6.25 MHz centered on a line rest frequency of 22.23508 GHz except for V1415 Cyg and IRAS 08002-3803. The VLA correlator produced 128 spectral channels with a channel spacing of 48.8 kHz (~0.66 km s-1). For V1415 Cyg and IRAS 08002-3803, we used a wider band (12.5 MHz) providing a channel spacing of 195.3 kHz (~2.64 km s-1) over 64 channels. The central velocities as well as the velocity ranges searched for our program stars are listed in Table 2. The central velocities were set based on the previous maser observations or the radial velocity measurements from optical spectral lines. However, no information about the radial velocity of IRAS 08002-3803 is available. Therefore, we set the central velocity to zero for this source.
The data were reduced using the standard routines within NRAO’s Astronomical Image Processing System (AIPS). The absolute flux density scale was established using the calibration sources 3C 286 and 3C 48, assuming 22.2 GHz flux densities of 2.59 Jy and of 1.13 Jy, respectively. For each target star, we observed a nearby (within 3°) extragalactic calibrator to estimate the instrumental and atmospheric phase fluctuations. Observations of these calibrators were interspersed with the target source scans at roughly ten-minute intervals. Phase corrections estimated from the calibration sources were applied to the target source data. For each source, we performed an iterative self-calibration and imaging procedure to map a single strong reference spectral feature in the 22.2 GHz H2O transition. The resulting phase solutions were applied to all channels in the band. To eliminate ringing in channels adjacent to strong maser features, the data were Hanning smoothed prior to the production of the final spectra. We estimated the root mean square (RMS) noise level from the far wings of the spectra. We took the 3σ RMS noise level as an upper limit on the maser emission for nondetection sources. While we obtained a data cube of images for each star, the spatial resolution of our VLA observations of 87 mas is too low to spatially resolve the distribution of the maser spots. Therefore, we only present the resulting spectra of our program stars.
Our program stars are classified as silicate carbon stars in the literature based on the Infrared Astronomical Satellite (IRAS) Low Resolution Spectra (LRS). However, for IRAS 06017+1011, IRAS 07221-0431, NC83, HD 189605, and V1415 Cyg, the quality of the IRAS LRS is too poor to detect the 10 μm silicate emission definitively or to study its spectral shape in detail. Therefore, we searched for newer mid-IR spectra for these objects. The VLTI/MIDI observation of IRAS 06017+1011 took place on 2005 December 22 (Program ID: 076.D-0250, P.I.: K. Ohnaka). We reduced the data with the MIA+EWS ver2.02, and the spectra were calibrated using HD 39400 (K1.5IIb) as a spectroscopic standard star, using the method described in Ohnaka et al. (2006). The observations of NC83 and HD 189605 with the InfraRed Spectrometer (IRS, Houck et al. 2004) onboard the Spitzer Space Telescope (Werner et al. 2004) occurred on 2004 December 9 and 2005 October 11, respectively, using the Short-High and Long-High modes with a spectral resolution of ~600 (Program ID: P03235, P.I.: C. Waelkens). We downloaded the Post Basic Calibrated Data (PBCD) from the Spitzer Heritage Archive. As presented in Sect. 3, the new mid-IR spectra confirm the silicate emission in these stars.
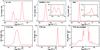 |
Fig. 1 VLA spectra (vector-averaged cross-power spectra over all baselines) of five silicate carbon stars with the detection of H2O masers. |
3. Results and discussion
We detected H2O maser emission from five out of ten sources: EU And, IRAS 06017+1011, NC83, V778 Cyg, and V1415 Cyg, with NC83 being the first maser detection. Figure 1 shows the H2O maser spectra of these five stars. The velocity range of the detected maser peaks, the velocity and intensity of each peak, and the integrated flux are listed in Table 2. For the nondetection sources, we list the upper limit of the maser intensity set by the 3σ RMS noise estimated as described in Sect. 2.
For NC83, Little-Marenin et al. (1988), Engels & Leinert (1994), and Benson & Little-Marenin (1996) searched for H2O masers at more than ten epochs in total in the 1980 s and 1990 s, but detected no H2O masers. In 2007 we detected a strong peak with 4.1 Jy, which should have been detectable in the previous observations. For example, the upper limit of 0.1 Jy reported by Engels & Leinert (1994) means an increase in the maser intensity by a factor of at least 40. On the other hand, IRAS 07221-0431 showed a single-peaked H2O maser with 0.75 Jy at VLSR = 79 km s-1 in 1992 (Engels 1994), but we detected no H2O masers, despite the detection limit (3σ RMS) of 0.02 Jy. This means that the maser intensity has decreased by more than a factor of 38. While significant time variations in the H2O masers toward silicate carbon stars are not unusual, the drastic variation by a factor of ~40 seen in NC83 and IRAS 07221-0431 is unique. This might be caused by some mechanism that differs from the usual erratic variations in the masers in stars such as V778 Cyg and IRAS 06017+1011 (as described below). The objects NC83 and IRAS 07221-0431 are worth monitoring in the long term.
In addition to this “on/off” variation, we also detected noticeable time variations in the maser intensity and spectral shape in IRAS 06017+1011 and V778 Cyg. Engels (1994) detected a strong single-peaked H2O maser (20 Jy) at −13 km s-1 toward IRAS 06017+1011 in 1992, while our VLA spectrum obtained 15 years later is very different, showing a peak (4.2 Jy) at −24 km s-1 and much weaker peaks of 150 and 140 mJy at −18 and −15 km s-1, respectively. Our VLA spectrum of V778 Cyg is also remarkably different from the MERLIN spectrum taken in 2001 (Szczerba et al. 2006), which shows the strongest peak at −15 km s-1 and a much weaker peak at −17 km s-1.
The VLA H2O maser spectra of EU And, IRAS 06017+1011, and NC83 are characterized by blue and red peaks separated by 8, 9, and 14 km s-1, respectively, and by weaker peaks in between. The VLA spectrum of V778 Cyg is dominated by a single peak at −17 km s-1, but there are weaker peaks of 0.22 Jy at −19.5 km s-1 and 0.21 Jy at −14.2 km s-1 on each side of the primary peak (Fig. 1, bottom right). In addition, there is some low level emission, from −24.0 to −20.1 km s-1, which is 3–4σ above the RMS noise of 0.02 Jy. This means a velocity separation of ~10 km s-1 between the most blue- and red-shifted features. The H2O maser spectrum of V1415 Cyg is also dominated by a single peak. This spectral feature is much broader (~10 km s-1) than the features in our other spectra, but the spectrum of V1415 Cyg was recorded with a much wider channel spacing of ~2.64 km s-1. Therefore, this single peak is likely a blend of several narrower features. In this case, the velocity width of this single peak of ~10 km s-1 would approximately correspond to the velocity separation between the most blue- and red-shifted peaks.
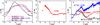 |
Fig. 2 New mid-IR spectra of IRAS 06017+1011 obtained with VLTI/MIDI a), NC83 b), and HD 189605 c), both obtained with Spitzer/IRS. Also plotted are the scaled spectra of IRAS 08002-3803, BM Gem, AC Her, and SS Vir. |
The measured velocity separations can be used to estimate the projected rotational velocity of the maser emitting region in circumbinary or circum-companion disks. We suggest that the masers in IRAS 06017+1011, NC83, and V1415 Cyg originate in circum-companion disks similar to EU And and V778 Cyg (Ohnaka & Boboltz 2008; Szczerba et al. 2006) for the following reason. The amount of the IR excesses toward these stars is similar and modest (see Table 3 of Engels 1994) and, therefore, implies that the oxygen-rich circumstellar material is optically thin. As Yamamura et al. (2000) argue, such material cannot exist stably in a circumbinary or circum-primary disk because the oxygen-rich material would be blown away by the intense radiation pressure from the primary carbon star.
It should be noted that the velocity separation measured at a given epoch can be narrower than the true velocity separation due to significant time variations in the maser intensity and the spectral shape as described above. Therefore, we checked the H2O maser spectra previously presented in the literature (see Table 1 for references) to estimate the true velocity separation for those sources with positive maser detections in the VLA data (with the exception of NC83, as our VLA observation yielded the first maser detection). The maximum maser velocity range obtained from the past and present maser spectra is −42.6... −29.5 km s-1, −24.0...−13.0 km s-1, and −24.0...−14.2 km s-1, for EU And, IRAS 06017+1011, and V778 Cyg, respectively3. Therefore, the velocity separation in EU And, IRAS 06017+1011, V778 Cyg, and NC83, are 13.1, 11.0, 9.8, and 13.8 km s-1, respectively. In the case of V1415 Cyg, the only previous detection is reported by Engels (1994), who detected a narrow, single peak at −28.2 km s-1. As mentioned above, the single peak in our VLA spectrum, which appears at roughly the same velocity, is much broader. Therefore, we took the width of this broad feature (~10 km s-1) as the velocity separation.
One half of measured velocity separations corresponds to the projected rotational velocity of the putative circum-companion disks. Therefore, the observed velocity separations of 10–14 km s-1 translate into the projected rotational velocities of 5–7 km s-1 for five stars shown in Fig. 1. If we adopt 0.5–0.8 M⊙ for the companion mass as in EU And (Ohnaka & Boboltz 2008) and assume the Keplerian rotation, the radius of the maser emitting region is estimated to be 10–32 AU. Adopting a higher mass of 1.7 M⊙ derived for V778 Cyg by Babkovskaia et al. (2006) leads to a radius of 68 AU for the rotational velocity of 5 km s-1. Because the velocity separations estimated from the past and present maser spectra are still a lower limit, the estimated projected rotational velocities are a lower limit. The projected rotational velocities themselves provide a lower limit on the (de-projected) rotational velocities. Therefore, the radius of the maser emitting region estimated above is an upper limit.
If the masers originate in circum-companion disks, the velocity range of the maser spectra is expected to drift systematically if observed long enough due to the orbital motion of the companion around the primary star. However, this is difficult to detect for two reasons. First, the orbital period is expected to be as long as a few hundred years. For example, the modeling of the masers toward V778 Cyg by Babkovskaia et al. (2006) suggests a mass of 1 M⊙ and 1.7 M⊙ for the primary star and the companion, respectively, with a separation of 80 AU. This translates into an orbital velocity of ~2 km s-1 and a period of ~440 years. Second, the small systematic drift in the velocity range caused by the orbital motion is masked by the erratic time variation of the masers, as mentioned above. We searched for possible systematic drifts in the velocity range of the masers in the spectra of V778 Cyg and EU And, which are the best targets for this purpose, thanks to ample maser observations in the past (see references in Table 1), but could find no definitive systematic drift.
The new mid-IR spectra of IRAS 06017+1011, NC83, and HD 189605, shown in Fig. 2, reveal the silicate emission, confirming that these stars are silicate carbon stars. While the Spitzer/IRS spectra of NC83 and HD 189605 are available only longward of 10 μm, the combination with the 9 μm flux measured by AKARI (Ishihara et al. 2010) indicates the 10 μm silicate feature. The spectra of IRAS 06017+1011 and HD 189605 exhibit a bump centered at 11–11.5 μm, which is clear when compared with BM Gem in Fig. 2a. This bump is also seen in the silicate carbon stars IRAS 08002-3803 (Ohnaka et al. 2006, also plotted in Fig. 2a) and IRAS 18006-3213 (Deroo et al. 2007). A comparison with the spectrum of the carbon-rich Mira SS Vir obtained with the Infrared Space Observatory (ISO), shown in Fig. 2c, suggests that the bump centered at 11 μm resembles the SiC feature often observed in usual carbon stars. Therefore, we suggest that the bump at 11–11.5 μm is due to SiC, which originates in the ongoing mass loss from the carbon-rich primary star.
It is noteworthy that the Spitzer/IRS spectrum of HD 189605 shows no signatures of crystalline silicate, although the spectral resolution of 600 is sufficient to resolve its sharp features. Figure 2c shows the ISO spectrum of the post-AGB star AC Her obtained with a spectral resolution of 750. AC Her, one of the best examples, shows fine, sharp crystalline silicate features that can be seen, for example, at 11.4, 16, and 18 μm (Molster et al. 2002). None of these features is seen in HD 189605.
Furthermore, the Galaxy Evolution Explorer (GALEX) detected HD 189605 in the near-UV with a flux of 5.1–7.7 μJy at 2271 Å4. The offset of the object detected with GALEX (GALEX J200105.1-072151) from the position of HD 189605 measured in the optical and IR is 0 2–09, which is within the positional error of the GALEX data. This means that the near-UV emission is likely associated with HD 189605. The UV emission may originate from an accretion disk around the putative companion as in BM Gem (Izumiura et al. 2008). Therefore, HD 189605 is a good candidate for studying the accretion process in silicate carbon stars.
There seems to be no clear correlation between the maser detection and the amount of the IR excess. For example, IRAS 06017+1011 and BM Gem show approximately the same amount of IR excess (see their SEDs in Figs. 3b and c in Kwok & Chan 1993). However, IRAS 06017+1011 shows masers, while BM Gem has not shown any masers so far. The detection of masers does not show a clear correlation with the shape of the silicate feature either. For example, IRAS 06017+1011 shows a broad silicate feature with a 11.5 μm bump, while EU And shows a narrow silicate feature. Nevertheless, both objects show maser emission. This can be understood if SiC in the ongoing mass loss from the carbon-rich primary star is responsible for the 11.5 μm bump. In this case, the shape of the 10 μm feature is not related to the oxygen-rich material.
4. Conclusions
We presented the results of a survey of the 22 GHz H2O masers toward ten silicate carbon stars using the VLA. We detected H2O masers in five stars, including NC83, for which masers have been detected for the first time. The H2O maser spectra show a velocity separation of 10–14 km s-1 between the most blue- and red-shifted peaks. This suggests a lower limit of the rotation velocity of the circum-companion disks of 5–7 km s-1 and an upper limit of the radius of the maser emitting region of 10–68 AU for a companion mass of 0.5–1.7 M⊙.
Using newer mid-IR spectra obtained with VLTI/MIDI and the Spitzer Space Telescope, we confirmed the 10 μm silicate feature in IRAS 06017+1011, NC83, and HD 189605. The silicate feature in IRAS 06017+1011 and HD 189605 shows a broad bump centered at 11–11.5 μm. We suggest that SiC in the ongoing mass loss from the carbon-rich primary star, not crystalline silicate, may be responsible for this bump. We also detected near-UV emission toward HD 189605 with GALEX.
The radius of the maser emitting region of 10–68 AU translates into 5–68 mas for distances of 1–2 kpc. This is resolvable with VLBA. High spatial resolution imaging of more silicate carbon stars with VLBA is feasible and necessary to reveal the spatial distribution of oxygen-rich material.
Little-Marenin et al. (1988) report a possible detection of a peak at −12.4 km s-1 toward EU And. However, because it is not a definitive detection, we did not include this peak.
None of the other silicate carbon stars in our list is found in the GALEX catalog at http://galex.stsci.edu/GR6/
References
- Alksnis, A., Balklavs, A., Dzervitis, U., et al. 2001, BaltA., 10, 1 [Google Scholar]
- Babkovskaia, N., Poutanen, J., Richards, A. M. S., & Szczerba, R. 2006, MNRAS, 370, 1921 [NASA ADS] [CrossRef] [Google Scholar]
- Benson, P. J., & Little-Marenin, I. R. 1987, ApJ, 316, L37 [NASA ADS] [CrossRef] [Google Scholar]
- Benson, P. J., & Little-Marenin, I. R. 1996, ApJS, 106, 579 [NASA ADS] [CrossRef] [Google Scholar]
- Colomer, F., Reid, M. J., Menten, K. M., & Bujarrabal, V. 2000, A&A, 355, linebreak979 [Google Scholar]
- Deguchi, S., Kawabe, R., Ukita, N., et al. 1988, ApJ, 325, 795 [NASA ADS] [CrossRef] [Google Scholar]
- Deguchi, S., Nakada, Y., & Forster, J. R. 1989, MNRAS, 239, 825 [NASA ADS] [Google Scholar]
- de la Reza, R., Drake, N. A., da Silva, L., Torres, C. A. O., & Martin, E. L. 1997, ApJ, 482, L77 [NASA ADS] [CrossRef] [Google Scholar]
- Deroo, P., Van Winckel, H., Verhoelst, T., et al. 2007, A&A, 467, 1093 [NASA ADS] [CrossRef] [EDP Sciences] [Google Scholar]
- Engels, D. 1994, A&A, 285, 497 [NASA ADS] [Google Scholar]
- Engels, D., & Leinert, Ch. 1994, A&A, 282, 858 [NASA ADS] [Google Scholar]
- Houck, J., Roellig, T., van Cleve, J., et al. 2004, ApJS, 154, 18 [NASA ADS] [CrossRef] [Google Scholar]
- Ishihara, D., Onaka, T., Kataza, H., et al. 2010, A&A, 514, A1 [NASA ADS] [CrossRef] [EDP Sciences] [Google Scholar]
- Izumiura, H., Noguchi, K., Aoki, W., et al. 2008, ApJ, 682, 499 [NASA ADS] [CrossRef] [Google Scholar]
- Kim, J., Cho, S.-H., & Kim, S. J. 2013, AJ, 145, 22 [NASA ADS] [CrossRef] [Google Scholar]
- Kwok, S., & Chan, S. J. 1993, AJ, 106, 2140 [NASA ADS] [CrossRef] [Google Scholar]
- Lewis, B. M. 1997, AJ, 114, 1602 [NASA ADS] [CrossRef] [Google Scholar]
- Little-Marenin, I. R. 1986, ApJ, 307, L15 [NASA ADS] [CrossRef] [Google Scholar]
- Little-Marenin, I. R., Benson, P. J., & Dickinson, D. F. 1988, ApJ, 330, 828 [NASA ADS] [CrossRef] [Google Scholar]
- Little-Marenin, I. R., Benson, P. J., & Cadmus, R. R., Jr. 1993, in Astrophysical masers, Proceedings of the Conference, Lect. Notes Phys., 412, 295 [Google Scholar]
- Lloyd-Evans, T. 1990, MNRAS, 243, 336 [NASA ADS] [Google Scholar]
- Lloyd-Evans, T. 1991, MNRAS, 249, 409 [NASA ADS] [CrossRef] [Google Scholar]
- Molster, F., Waters, L. B. F. M., & Tielens, A. G. G. M. 2002, A&A, 382, 222 [NASA ADS] [CrossRef] [EDP Sciences] [Google Scholar]
- Morris, M. 1987, PASP, 99, 1115 [NASA ADS] [CrossRef] [Google Scholar]
- Nakada, Y., Izumiura, H., Onaka, T., et al. 1987, ApJ, 323, L77 [NASA ADS] [CrossRef] [Google Scholar]
- Nakada, Y., Deguchi, S., & Forster, J. R. 1988, A&A, 193, L13 [NASA ADS] [Google Scholar]
- Ohnaka, K., & Boboltz, D. A. 2008, A&A, 478, 809 [NASA ADS] [CrossRef] [EDP Sciences] [Google Scholar]
- Ohnaka, K., & Tsuji, T. 1999, A&A, 345, 233 [NASA ADS] [Google Scholar]
- Ohnaka, K., Driebe, T., Hofmann, K.-H., et al. 2006, A&A, 445, 1015 [NASA ADS] [CrossRef] [EDP Sciences] [Google Scholar]
- Ohnaka, K., Izumiura, H., Leinert, Ch., et al. 2008, A&A, 490, 173 [NASA ADS] [CrossRef] [EDP Sciences] [Google Scholar]
- Sengupta, S., Izzard, R., & Lau, H. 2013, A&A, 559, A66 [NASA ADS] [CrossRef] [EDP Sciences] [Google Scholar]
- Shintani, M., Imai, H., Ando, K., et al. 2008, PASJ, 60, 1077 [NASA ADS] [Google Scholar]
- Szczerba, R., Szymczak, M., Babkovskaia, N., et al. 2006, A&A, 452, 561 [NASA ADS] [CrossRef] [EDP Sciences] [Google Scholar]
- Werner, M. W., Roellig, T. L., Low, F. J., et al. 2004, ApJS, 154, 1 [Google Scholar]
- Willems, F., & de Jong, T. 1986, ApJ, 309, L39 [NASA ADS] [CrossRef] [Google Scholar]
- Yamamura, I., Dominik, C., de Jong, T., Waters, L. B. F. M., & Molster, F. J. 2000, A&A, 363, 629 [NASA ADS] [Google Scholar]
- Zhang, X., & Jeffery, C. S. 2013, MNRAS, 430, 2113 [NASA ADS] [CrossRef] [Google Scholar]
All Tables
All Figures
|
Fig. 1 VLA spectra (vector-averaged cross-power spectra over all baselines) of five silicate carbon stars with the detection of H2O masers. |
| In the text | |
|
Fig. 2 New mid-IR spectra of IRAS 06017+1011 obtained with VLTI/MIDI a), NC83 b), and HD 189605 c), both obtained with Spitzer/IRS. Also plotted are the scaled spectra of IRAS 08002-3803, BM Gem, AC Her, and SS Vir. |
| In the text | |
Current usage metrics show cumulative count of Article Views (full-text article views including HTML views, PDF and ePub downloads, according to the available data) and Abstracts Views on Vision4Press platform.
Data correspond to usage on the plateform after 2015. The current usage metrics is available 48-96 hours after online publication and is updated daily on week days.
Initial download of the metrics may take a while.