| Issue |
A&A
Volume 542, June 2012
|
|
|---|---|---|
| Article Number | A124 | |
| Number of page(s) | 6 | |
| Section | Stellar structure and evolution | |
| DOI | https://doi.org/10.1051/0004-6361/201219158 | |
| Published online | 18 June 2012 | |
Period decrease in three SuperWASP eclipsing binary candidates near the short-period limit
1 Department of Physical Sciences, The Open University, Walton Hall, Milton Keynes, MK7 6AA, UK
e-mail: Marcus.Lohr@open.ac.uk
2 Astrophysics Group, Keele University, Staffordshire ST5 5BG, UK
3 Astrophysics Research Centre, Main Physics Building, School of Mathematics & Physics, Queen’s University, University Road, Belfast BT7 1NN, UK
4 Department of Physics and Astronomy, University of Leicester, Leicester LE1 7RH, UK
Received: 2 March 2012
Accepted: 3 May 2012
SuperWASP light curves for 53 W UMa-type eclipsing binary (EB) candidates, identified in previous work as being close to the contact binary short-period limit, were studied for evidence of period change. The orbital periods of most of the stars were confirmed, and period decrease, significant at more than 5σ, was observed in three objects: 1SWASP J174310.98+432709.6 (−0.055 ± 0.003 s yr-1), 1SWASP J133105.91+121538.0 (−0.075 ± 0.013 s yr-1) and 1SWASP J234401.81−212229.1 (−0.313 ± 0.019 s yr-1). The magnitudes of the observed period changes cannot be explained by magnetic braking or gravitational radiation effects, and are most likely primarily due to unstable mass transfer from primary to secondary components, possibly accompanied by unstable mass and angular momentum loss from the systems. If these period decreases persist, the systems could merge on a relatively short timescale.
Key words: stars: variables: general / binaries: eclipsing / stars: individual: V1067Her / stars: individual: GSC 2314-0530 / binaries: close
© ESO, 2012
1. Introduction
The SuperWASP project has been surveying bright (V ~ 8–15 mag) stars across almost the whole sky since 2004, looking for photometric variations indicative of exoplanetary transits (Pollacco et al. 2006). However, in addition to 67 exoplanets announced by early February 20121, it has discovered several tens of thousands of new variable stars, the majority of which appear to be eclipsing binaries (EB) (Payne, in prep.). The cameras’ observational cadence permits detection of periods from several months down to about 20 min (e.g. pulsations in Am stars measured by Smalley et al. 2011). Hence the SuperWASP archive represents a useful source of evidence for short-period EBs.
W UMa-type variables, which usually represent contact binaries, exhibit a fairly sharp lower limit to their observed orbital periods, of around 0.22 d (Rucinski 2007). Suggested explanations for this cut-off have involved the stars reaching full convective limit (Rucinski 1992) or an effective low mass limit, given the finite age of the Universe, on the assumption that angular momentum loss rates are related to stellar masses (Stepień 2006). However, the convective limit would not provide a full explanation (Rucinski 1992), and Stepien’s low mass limit does not appear to hold true for some recently-discovered systems (Jiang et al. 2012) e.g. GSC 2314 − 0530. Hence Jiang et al. have suggested that dynamic mass transfer instability develops in detached binary systems possessing both low initial primary mass and a low mass ratio, once the primary fills its Roche lobe, leading to a rapid merger of the binary. Stable mass transfer would however lead to formation of a contact binary at the point of Roche lobe overflow, explaining the short-period limit for contact binaries with appropriate primary mass and mass ratio.
Norton et al. (2011) presented evidence for 53 candidate W UMa-type EBs observed using SuperWASP, with periods close to the short-period limit, of which 48 were new discoveries. Some of these, when folded at their determined period, failed to give well-defined light curves, which could be the result of period variability. Therefore our aim here was to determine whether any of the 53 candidate EBs showed evidence of period changes during their observation by SuperWASP. Period decreases might indicate a detached or semi-detached binary undergoing unstable mass transfer likely to end in merger, or even a contact binary approaching merger (as observed by Tylenda et al. 2011).
2. Method
The best orbital period values for the 53 stars were checked using a three-step custom-written IDL procedure. First, an approximation to the half-period was found by fitting a sinusoidal function, using the Levenberg-Marquardt algorithm (Levenberg 1944; Marquardt 1963), to light curve data from three optimal nights of observation. The inverse-variance weighted average half-period, and its uncertainties, were then used to constrain the search range for a Lomb-Scargle periodogram (Lomb 1976; Scargle 1982; Horne & Baliunas 1986) to determine a more precise estimate for the half-period, which was doubled to give an estimate for the orbital period. Finally, the light curve data set was folded on trial periods within a narrow range, and the dispersion of flux values within phase bins was minimized to find the optimum period to the nearest 0.01 s.
A reference light curve minimum was then automatically selected as near to the middle of the data set as possible (since the period here would be expected to approximate the “average” period found for the whole data set in cases where the period was changing linearly). The time of zero-point minimum t0 was more precisely found by fitting a sinusoidal function to nearby points; the optimum period length Pcalc was then used to calculate expected times of minimum light (C = t0 + PcalcE, where E is the period number, or epoch, relative to t0) within the full time-range observed. Actual times of minimum O near these values were determined using quadratic fitting (which proved more robust than Gaussian or sinusoidal fits), with poor fits and inadequately-sampled minima being automatically rejected.
In this way a series of observed minus calculated (O−C) values were obtained, and plotted against epoch. A second series was found for the other set of light curve minima (since EBs exhibit a primary and secondary eclipse during each orbital period). Such O − C diagrams will be expected to follow a quadratic curve if the period is changing linearly, allowing the determination of the rate of change of period with respect to epoch. Since O = t0 + P(E)E when P = P(E), we have:  (1)so, differentiating with respect to E:
  (2)giving dP/dE = 2a. Therefore an attempt was made to fit a quadratic function to each O−C series, from which a value for the rate of period change (per period) could be determined. The inverse-variance weighted average period change (across both O−C series) was thus found for each star, and could be converted into an approximate rate of change dP/dt in s yr-1.
The validity of the method and code described above was tested using several synthetic data sets. Even with noisy data, it proved able to recover input periods correct to 6 to 7 significant figures (s.f.), and input linear period changes correct to 0.1 s yr-1, significant at over 7σ. The latter error is largely due to the approximation of a continuous function of time by a discontinuous function of epoch in the customary differential equation as pointed out by Kopal & Kurth (1957).
3. Results
The optimum orbital periods found for the 53 stars are given in Table 1. In the majority of cases, identical periods (to 4 or 5 s.f.) to those found in Norton et al. (2011) were obtained. Object J0554’s period was given incorrectly in Table 1 of Norton et al., but correctly in the Appendix. For nine objects, a period approximately 1/8 longer was obtained by this method; manual checks indicated that the longer periods found here were more plausible (e.g. the folded light curve was more clearly defined; the primary and secondary minima exhibited more difference in depths). In the earlier paper, only candidate periods below 20 000 s (~0.2315 d) had been investigated, allowing these longer periods to be missed. Therefore the 53 stars probably do not all possess periods below 20 000 s, but since all are below about 22 600 s (~0.2616 d), they still constitute a useful sample of notably short-period EB candidates.
Period results for 53 SuperWASP eclipsing binaries.
Table 1 also gives the period change results. Object J1738 only had enough minima data for a single O − C series, so was excluded. Object J0930 appeared to show significant period increase, but its folded light curve and O − C diagram suggested an anomaly in the data, and a check of the sky within 1′ of the object revealed a nearby bright star which appears to have contaminated the light curve; this object was also therefore excluded at this stage. Of the remaining 51 objects, 17 showed period change inconsistent with zero, at 1σ confidence, with 6 cases of apparent period increase and 11 of decrease. However, given the number of objects studied, we might expect approximately this number of marginally-significant results purely by chance, and so we do not claim that all these 17 results indicate genuine period changes (although this is a possibility).
More notable is that three objects show a period change significant at more than 3σ, where we would expect no significant results by chance alone in a set of 51 objects. These three stars underwent significant decreases in period during the time they were observed by SuperWASP: objects J1743 ( − 0.055 ± 0.003 s yr-1, significant at 21σ), J1331 ( − 0.075 ± 0.013 s yr-1, significant at 5σ) and J2344 ( − 0.31 ± 0.02 s yr-1, significant at 16σ). Figures 1–6 show the folded light curves and O − C diagrams for these three objects, while Fig. 7 illustrates a non-significant result (object J0509) for comparison. Given the method of period determination, the choice of a precise zero point for the ephemerides of these three objects is somewhat arbitrary. However, using the zero points assigned by the program, and the optimum periods for the whole observation set, we have approximate eclipse times:
-
J1743
HJD 2 454 997.688926+0.258108E − 4.5 × 10⁻¹⁰E2
-
HJD 2 454 976.358606+0.218014E − 5.2 × 10⁻¹⁰E2
-
HJD 2 454 417.284057+0.213676E − 2.1 × 10⁻⁹E2.
4. Discussion
We may note that period changes have been observed in many EBs (Kim et al. 2003, claim that about 46% of the 1140 EBs in Kreiner et al.’s 2001, collection of O−C diagrams show at least some evidence of period change). Moreover, in short-period W UMa-type systems, period increases and decreases have been found to be of similar frequency, with the majority having |Ṗ| ≤ 0.02 s yr-1 and none exceeding about ±0.4 s yr-1 (Kubiak et al. 2006), which would make our 3 main examples of period change notably rapid, but not exceptionally so. Therefore, we do not suggest that our evidence for period change is in itself especially surprising, nor would we argue for period decreases being generally dominant in this stellar population, on the basis of such a small sample. Rather, the particular interest of (relatively rapid) period decrease in the three objects J1743, J1331 and J2344 is that they are already near or below the short-period limit for W UMa objects of 0.22 d, and have timescales P/Ṗ between 4 × 10⁵ and 6 × 10⁴ years. The underlying processes which may be operating in these objects therefore merit further consideration.
To investigate possible causes of the period decreases apparently observed for these three objects, the eclipsing binary modelling software PHOEBE (Prša & Zwitter 2005), built upon the code of Wilson & Devinney (1971), was used to estimate component masses, radii and other system parameters. In the absence of radial velocity measurements, values for semimajor axis a could not be determined, so best-fit parameter combinations were found for a range of physically-plausible values of a. Several external constraints were applied: from general light curve morphology, such as continuous light variation, the systems were taken to be W UMa-type contact binaries (overcontact in PHOEBE’s terms) i.e. with filling factors in (0, 1]. The values for M1 were required to be approximately consistent with system temperatures as indicated by spectral types, themselves estimated from V − J and V − K colours using 2MASS data (J1743 was taken to be approximately type K2, with temperature ~4600 K; J1331 type G9, Teff ~ 5000 K; J2344 type K9, Teff ~ 3700 K). Mass ratios q were taken to be in the range 0.08–0.8, as typical for W UMa systems (Hilditch 2001), subject to the hydrogen-burning requirement for M2 to be at least 0.08 M⊙. Maximum and minimum values of a could then be derived from the possible radii of the (contact) component stars. The resulting best-fit masses and radii (found to 2 s.f. by minimizing χ2 values) are given in Table 2. Object J1331 could not be as well-fitted as the other two objects, by any combination of a, q, inclination i and Kopal potential Ω, because its maxima differ significantly in height, probably due to spots on the stellar surfaces. However, spots were not modelled here, in the absence of direct evidence.
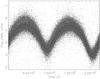 |
Fig. 1 Light curve for object J1743, folded at period of 22 300.517 s, with mean values for binned data overplotted. |
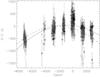 |
Fig. 2 O − C diagram for object J1743, with best fit quadratic curves overplotted. Black stars and solid line indicate primary eclipse series; grey open diamonds and dashed line indicate secondary eclipse series. Period decrease significant at 21σ is indicated. |
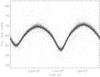 |
Fig. 3 Light curve for object J1331, folded at period of 18 836.380 s, with mean values for binned data overplotted. |
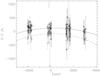 |
Fig. 4 O − C diagram for object J1331, with best fit quadratic curves overplotted. Black stars and solid line indicate primary eclipse series; grey open diamonds and dashed line indicate secondary eclipse series. Period decrease significant at 5σ is indicated. |
 |
Fig. 5 Light curve for object J2344, folded at period of 18 461.591 s, with mean values for binned data overplotted. |
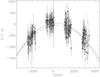 |
Fig. 6 O − C diagram for object J2344, with best fit quadratic curves overplotted. Black stars and solid line indicate primary eclipse series; grey open diamonds and dashed line indicate secondary eclipse series. Period decrease significant at 16σ is indicated. |
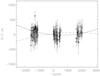 |
Fig. 7 O − C diagram for object J0509, with best fit quadratic curves overplotted. Black stars and solid line indicate primary eclipse series; grey open diamonds and dashed line indicate secondary eclipse series. No significant period change is indicated. |
Period decrease might be caused by magnetic braking, removing angular momentum from the system. The plausibility of this was assessed using Bradstreet & Guinan’s equation (1994):  (3)Although this applies properly only to detached systems, Bradstreet & Guinan suggest that magnetic field strengths would be weaker in contact binaries. So we may at least use their formula to estimate an upper limit for the effect of magnetic braking on a contact system. Therefore, taking the gyration constant k2 as 0.1 (typical for main sequence stars, Bradstreet & Guinan 1994), the value of the RHS was evaluated for the various system parameter combinations and compared with dP/dt for the three stars. The results, given in Table 2, are between about 20% and 1% of the observed quantities. Other estimates of the effect of magnetic braking were made from equations for
  from Rappaport et al. (1983) and Hurley et al. (2002), as calibrated by Davis et al. (2008) by using the angular momentum loss rate at the upper edge of the cataclysmic variable period gap (the binary systems were approximated as single, fully-convective stars in order to use these equations). This produced significantly smaller estimates of expected period change: between 3 and 4 orders of magnitude too small. This suggests that magnetic braking is not the main cause of period decrease in any of the three systems, though the difference of 1 to 2 orders of magnitude in the estimates produced by the different equations also implies significant limitations in our ability to quantify magnetic braking.
Another possibility is angular momentum loss due to gravitational wave radiation (GWR). Combining expressions from Kolb (2010) and Hilditch (2001): 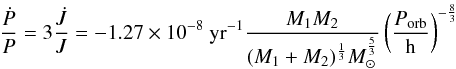 (4)the expected Ṗ/P was calculated for each parameter combination (Table 2). However, these quantities are about 6 orders of magnitude smaller than the observed Ṗ/P values. GWR can be responsible for only a tiny fraction of the period decreases observed here.
Model parameters and theoretical period/mass changes for three objects.
This leaves mass transfer from M1 to M2 and/or mass (and hence angular momentum) loss from the system, from other mechanisms, as plausible causes. Using equations as given by Hilditch: ![\begin{eqnarray} \frac{\dot{P}}{P}&=&\frac{3\dot{M_1}(M_1-M_2)}{M_1M_2} \\ \frac{\dot{P}}{P}&=&3\dot{M_1}\left[\frac{(M_1+M_2)}{M_1M_2}\frac{d^2}{a^2}-\frac{M_2}{M_1(M_1+M_2)}\right] \end{eqnarray}](/articles/aa/full_html/2012/06/aa19158-12/aa19158-12-eq124.png) (where d is the distance from the binary centre of mass to Lagrange point L2) for conservative and non-conservative mass loss respectively, we can calculate the necessary values of
(where d is the distance from the binary centre of mass to Lagrange point L2) for conservative and non-conservative mass loss respectively, we can calculate the necessary values of  to explain the observed Ṗ/P values (Table 2). These are of the order of 10-6–10-7 M⊙ yr-1, which we may note is similar to the mass loss rate calculated by Hilditch for contact binary SV Cen, to explain its precipitous observed rate of period decrease. He argues that mass may be ejected during a rapid phase of Roche-lobe overflow (or more generally, in a contact system) through L2, contributing to period decrease. Possible mechanisms for unstable mass transfer/loss leading to rapid period decrease in contact or near-contact binaries are also discussed in Rasio (1995), Tylenda et al. (2011) and Jiang et al. (2012). This explanation is left as the most plausible for the observed period decreases in the objects J1743, J1331 and J2344, with further small contributions from magnetic braking and GWR.
What future, then, might we envisage for these three systems? Since their primary masses and mass ratios cannot currently be determined with any precision, it is possible that they are subject to Jiang et al.’s low mass limit (2012), leading to unstable mass transfer, or to Rasio’s tidal instabilities (1995), and will undergo merger on a relatively short timescale. Rasio proposes the orbital decay time tD ~ 103–104 years for an unstable W UMa system. Another indication of the possible timescale for merger is given by Tylenda et al.’s study (2011) of the decaying period of the contact binary progenitor of the V1309 Sco outburst. Using their exponential model for period decay, one can determine that their object would have been decreasing in period at a rate of 0.3 s yr-1 about 130 years before the observed outburst (and presumed merger). Since object J2344 appears to be currently undergoing period decrease at approximately this rate, and is already below the short-period limit, it is perhaps not inconceivable that it might merge on a timescale of centuries or even decades from now (assuming, of course, that its period decrease is maintained). Whatever their ultimate fate, these may be rare examples of objects caught in a brief transitional stage between stable states.
5. Conclusions
Our study of the periods of 53 W UMa candidate binary stars, observed with SuperWASP, confirmed that they are all very close to the short-period limit, and thus constitute a useful sample of sources for investigating the causes of this limit. In three of the objects, period decrease significant at 5σ or more was found during their time of observation; the remaining objects’ period changes were consistent with zero change at 3σ. Modelling estimates for possible system parameters indicated that neither magnetic braking nor GWR are likely to be the primary cause of these period decreases. The rates of change observed in these three objects can best be explained by unstable mass transfer from primary to secondary components, and/or mass and angular momentum loss from the systems, which could lead to merger on a relatively short timescale if the periods continue to decrease.
These are potentially unusual transitional objects, capable of shedding light on the evolution of EBs and the causes of the short-period limit of W UMa binaries. As such they would repay further study and additional observations. In future we hope to obtain spectroscopic measurements of these systems, permitting more precise stellar modelling and parameter determination. We also intend to run the programs developed here on other SuperWASP variable objects, to search for further interesting period variation.
Acknowledgments
The WASP project is funded and operated by Queen’s University Belfast, the Universities of Keele, St. Andrews and Leicester, the Open University, the Isaac Newton Group, the Instituto de Astrofisica de
Canarias, the South African Astronomical Observatory and by STFC. This work was supported by the Science and Technology Funding Council and the Open University. We would like to thank the referee S. Rucinski for his constructive advice which has improved this paper.
References
- Bradstreet, D. H., & Guinan, E. F. 1994, in Interacting Binary Stars, ed. A. W. Shafter (San Francisco, Calif.: ASP), ASP Conf. Ser., 56, 228 [Google Scholar]
- Davis, P. J., Kolb, U., Willems, B., & Gänsicke, B. T. 2008, MNRAS, 389, 1563 [NASA ADS] [CrossRef] [Google Scholar]
- Hilditch, R. W. 2001, An Introduction to Close Binary Stars (Cambridge, UK: Cambridge University Press) [Google Scholar]
- Horne, J. H., & Baliunas, S. L. 1986, ApJ, 302, 757 [NASA ADS] [CrossRef] [Google Scholar]
- Hurley, J. R., Tout, C. A., & Pols, O. R. 2002, MNRAS, 329, 897 [NASA ADS] [CrossRef] [Google Scholar]
- Jiang, D., Han, Z., Ge, H., Yang, L., & Li, L. 2012, MNRAS, 421, 2769 [NASA ADS] [CrossRef] [Google Scholar]
- Kim, C. H., Kreiner, J. M., & Nha, L. S. 2003, in Stellar Astrophysics – A Tribute to Helmut A. Abt, ed. K. S. Cheng, K. C. Leung, & T. P. Li (Dordrecht: Kluwer Academic Publishers), 298, 127 [Google Scholar]
- Kolb, U. 2010, Extreme Environment Astrophysics (Cambridge, UK: Cambridge University Press/The Open University) [Google Scholar]
- Kopal, Z., & Kurth, R. 1957, Z. Astrophys., 42, 90 [NASA ADS] [Google Scholar]
- Kreiner, J. M., Kim, C.-H., & Nha, I.-S. 2001, An Atlas of O–C Diagrams of Eclipsing Binary Stars (Cracow, Poland: Wydawnictwo Naukowe Akademii Pedagogicznej) [Google Scholar]
- Kubiak, M., Udalski, A., & Szymański, M. K. 2006, Acta Astron., 56, 253 [NASA ADS] [Google Scholar]
- Levenberg, K. 1944, Quart. Appl. Math., 2, 164 [Google Scholar]
- Lomb, N. R. 1976, Ap&SS, 39, 447 [NASA ADS] [CrossRef] [Google Scholar]
- Marquardt, D. W. 1963, SIAM J. Appl. Math., 11, 431 [Google Scholar]
- Norton, A. J., Payne, S. G., Evans, T., et al. 2011, A&A, 528, A90 [NASA ADS] [CrossRef] [EDP Sciences] [Google Scholar]
- Pollacco, D. L., Skillen, I., Cameron, A. C., et al. 2006, PASP, 118, 1407 [NASA ADS] [CrossRef] [Google Scholar]
- Prša, A., & Zwitter, T. 2005, ApJ, 628, 426 [NASA ADS] [CrossRef] [Google Scholar]
- Rappaport, S., Verbunt, F., & Joss, P. C. 1983, ApJ, 275, 713 [NASA ADS] [CrossRef] [Google Scholar]
- Rasio, F. A. 1995, ApJ, 444, L41 [NASA ADS] [CrossRef] [Google Scholar]
- Rucinski, S. M. 1992, AJ, 103, 960 [NASA ADS] [CrossRef] [Google Scholar]
- Rucinski, S. M. 2007, MNRAS, 382, 393 [NASA ADS] [CrossRef] [Google Scholar]
- Scargle, J. D. 1982, ApJ, 263, 835 [NASA ADS] [CrossRef] [Google Scholar]
- Smalley, B., Kurtz, D. W., Smith, A. M. S., et al. 2011, A&A, 535, A3 [CrossRef] [EDP Sciences] [Google Scholar]
- Stepień, K. 2006, Acta Astron., 56, 347 [NASA ADS] [Google Scholar]
- Tylenda, R., Hajduk, M., Kamiński, T., et al. 2011, A&A, 528, A114 [Google Scholar]
- Wilson, R. E., & Devinney, E. J. 1971, ApJ, 166, 605 [NASA ADS] [CrossRef] [Google Scholar]
All Tables
All Figures
|
Fig. 1 Light curve for object J1743, folded at period of 22 300.517 s, with mean values for binned data overplotted. |
| In the text | |
|
Fig. 2 O − C diagram for object J1743, with best fit quadratic curves overplotted. Black stars and solid line indicate primary eclipse series; grey open diamonds and dashed line indicate secondary eclipse series. Period decrease significant at 21σ is indicated. |
| In the text | |
|
Fig. 3 Light curve for object J1331, folded at period of 18 836.380 s, with mean values for binned data overplotted. |
| In the text | |
|
Fig. 4 O − C diagram for object J1331, with best fit quadratic curves overplotted. Black stars and solid line indicate primary eclipse series; grey open diamonds and dashed line indicate secondary eclipse series. Period decrease significant at 5σ is indicated. |
| In the text | |
|
Fig. 5 Light curve for object J2344, folded at period of 18 461.591 s, with mean values for binned data overplotted. |
| In the text | |
|
Fig. 6 O − C diagram for object J2344, with best fit quadratic curves overplotted. Black stars and solid line indicate primary eclipse series; grey open diamonds and dashed line indicate secondary eclipse series. Period decrease significant at 16σ is indicated. |
| In the text | |
|
Fig. 7 O − C diagram for object J0509, with best fit quadratic curves overplotted. Black stars and solid line indicate primary eclipse series; grey open diamonds and dashed line indicate secondary eclipse series. No significant period change is indicated. |
| In the text | |
Current usage metrics show cumulative count of Article Views (full-text article views including HTML views, PDF and ePub downloads, according to the available data) and Abstracts Views on Vision4Press platform.
Data correspond to usage on the plateform after 2015. The current usage metrics is available 48-96 hours after online publication and is updated daily on week days.
Initial download of the metrics may take a while.