| Issue |
A&A
Volume 527, March 2011
|
|
|---|---|---|
| Article Number | A95 | |
| Number of page(s) | 8 | |
| Section | Interstellar and circumstellar matter | |
| DOI | https://doi.org/10.1051/0004-6361/201015079 | |
| Published online | 01 February 2011 | |
Herschel observations of EXtra-Ordinary Sources (HEXOS): Methanol as a probe of physical conditions in Orion KL⋆
1
Department of Astronomy, University of Michigan,
500 Church Street, Ann Arbor, MI
48109, USA
e-mail: shiya@umich.edu
2
Jet Propulsion Laboratory, Caltech, Pasadena, CA
91109,
USA
3
California Institute of Technology, Cahill Center for Astronomy and Astrophysics
301-17, Pasadena,
CA
91125,
USA
4
Max-Planck-Institut für Radioastronomie,
Auf dem Hügel 69, 53121
Bonn,
Germany
5
I. Physikalisches Institut, Universität zu Köln,
Zülpicher Str. 77, 50937
Köln,
Germany
6
California Institute of Technology, Division of Geological and
Planetary Sciences, MS
150-21, Pasadena,
CA
91125,
USA
7
Centre d’étude Spatiale des Rayonnements, Université de Toulouse
[UPS], 31062
Toulouse Cedex 9,
France
8
CNRS/INSU, UMR 5187, 9 avenue du Colonel Roche, 31028
Toulouse Cedex 4,
France
9
Laboratoire d’Astrophysique de l’Observatoire de
Grenoble, BP 53,
38041
Grenoble, Cedex 9,
France
10
Centro de Astrobiología (CSIC/INTA), Laboratiorio de Astrofísica
Molecular, Ctra. de Torrejón a Ajalvir, km 4 28850, Torrejón de Ardoz, Madrid, Spain
11
LERMA, CNRS UMR8112, Observatoire de Paris and École Normale
Supérieure, 24 Rue
Lhomond, 75231
Paris Cedex 05,
France
12
LPMAA, UMR7092, Université Pierre et Marie Curie,
Paris,
France
13
LUTH, UMR8102, Observatoire de Paris,
Meudon,
France
14
Departments of Physics, Astronomy and Chemistry, Ohio State
University, Columbus,
OH
43210,
USA
15
National Research Council Canada, Herzberg Institute of
Astrophysics, 5071 West Saanich
Road, Victoria, BC
V9E 2E7,
Canada
16
Infrared Processing and Analysis Center, California Institute of
Technology, MS
100-22, Pasadena,
CA
91125,
USA
17
Canadian Institute for Theoretical Astrophysics, University of
Toronto, 60 St George St,
Toronto, ON
M5S 3H8,
Canada
18
Harvard-Smithsonian Center for Astrophysics,
60 Garden Street, Cambridge
MA
02138,
USA
19
National University of Ireland Maynooth.
Ireland
20
Department of Physics and Astronomy, Johns Hopkins
University, 3400 North Charles
Street, Baltimore,
MD
21218,
USA
21
SRON Netherlands Institute for Space Research,
PO Box 800, 9700 AV, Groningen, The Netherlands
22
Department of Physics and Astronomy, University of Calgary, 2500
University Drive NW, Calgary, AB
T2N 1N4,
Canada
Received:
28
May
2010
Accepted:
21
December
2010
We have examined methanol emission from Orion KL withthe Herschel/HIFI instrument, and detected two methanol bands centered at 524 GHz and 1061 GHz. The 524 GHz methanol band (observed in HIFI band 1a) is dominated by the isolated ΔJ = 0, K = −4 → −3, vt = 0 Q branch, and includes 25 E-type and 2 A-type transitions. The 1061 GHz methanol band (observed in HIFI band 4b) is dominated by the ΔJ = 0, K = 7 → 6, vt = 0 Q branch transitions which are mostly blended. We have used the isolated E-type vt = 0 methanol transitions to explore the physical conditions in the molecular gas. With HIFI’s high velocity resolution, the methanol emission contributed by different spatial components along the line of sight toward Orion KL (hot core, low velocity flow, and compact ridge) can be distinguished and studied separately. The isolated transitions detected in these bands cover a broad energy range (upper state energy ranging from 80 K to 900 K), which provides a unique probe of the thermal structure in each spatial component. The observations further show that the compact ridge is externally heated. These observations demonstrate the power of methanol lines as probes of the physical conditions in warm regions in close proximity to young stars.
Key words: ISM: abundances / ISM: molecules
© ESO, 2011
1. Introduction
Methanol (CH3OH) is an abundant molecule in a wide range of interstellar conditions (e.g., Friberg et al. 1988; Menten et al. 1988). An asymmetric-top rotor, methanol has numerous rotational transitions from far-infrared to millimeter wavelengths. This marks methanol as a common “weed” molecule, and the number and strength of its transitions means that methanol contamination has to be minimized when analyzing transitions from other molecules. However, rather than being treated solely as a contaminant, methanol is also a useful molecular tracer of dense gas (Menten et al. 1988). Leurini et al. (2004) further explore the properties of methanol emission in dense molecular clouds and illustrate how methanol transitions at sub-millimeter and millimeter wavelengths are sensitive to the density and the kinetic temperature of the gas. Therefore, with its observational advantage of a large number of lines being observable simultaneously, methanol is an excellent tool with which to probe the physical structure in dense molecular gas (also see Kama et al. 2010).
A full spectral scan toward Orion KL covering frequency ranges 479.8 to 560.0 GHz (band 1a) and 1047.0 to 1121.5 GHz (band 4b) has been carried out by the HIFI instrument (de Graauw et al. 2010) aboard on the Herschel Space Observatory (Pilbratt et al. 2010), as part of the guaranteed time key programHerschel/HIFI observations of EXtra-Ordinary Sources: the Orion and sagittarius b2 star-forming regions (HEXOS). Orion KL, located within the Orion molecular cloud at ~450 pc, is the nearest massive star-forming region (Genzel & Stutzki 1989). It contains several kinematic components (e.g., Blake et al. 1987; Persson et al. 2007), a hot core, multiple outflows, and the compact ridge, surrounding by cold quiescent gas. We have detected two methanol bands (i.e., groups of methanol lines within small frequency ranges) with transitions spanning a large range in upper state energy (80–900 K) falling within a single HIFI bandpass (4 GHz). In this paper, we show that these two bands of methanol can be used to determine the gas temperature and we explore thermal gradients in the Orion compact ridge. In Sect. 2, we discuss the HEXOS observations and the analysis tools used in this study. In Sect. 3, we present the spectra of two methanol bands and their 13CH3OH counterparts, and resolve the methanol emission from the compact ridge and the outflow. In Sect. 4, we show the population diagrams for the detected isolated methanol transitions for compact ridge and the outflow. And in Sect. 5, we examine how these two methanol bands can be used to provide additional information on the physical structure of the emitting regions.
2. Observations
 |
Fig.1 HIFI spectra of two methanol bands in band 1a (521.7–525.6 GHz; upper panel) and 4b (1056.1–1065.6 GHz; lower panel). Red number 1-42 label isolated methanol transitions, which are also listed in Table 1. Blue texts label transitions from other molecules and the methanol transitions which are blended. Green texts and “B” label the methanol lines which are blended with different parity states. “U” labels two unidentified lines. |
The HIFI observations presented here, which are part of HEXOS (Bergin et al. 2010), are full spectral scans in bands 1a and 4b, covering a frequency range of 479.8 to 560.0 GHz and 1047.0 to 1121.5 GHz, respectively, pointing towards the Orion hot core at αJ2000 = 5h35m14.3s and δJ2000 = −5°22′36.7′′. These observations were carried out on March 1 and 3, 2010 using the dual beam switch (DBS) mode with redundancy 6, with the wide band spectrometer (WBS) providing a spectral resolution of 1.1 MHz over a 4 GHz IF bandwidth. The HIFI beam sizes are ~43′′ in band 1a and 20′′ in band 4b, and the beam efficiency in both bands is 0.71. All data presented here were processed with HIPE (Ott et al. 2010) version 2.4, using the standard HIFI deconvolution (doDeconvolution task in HIPE). From line-free regions in the spectrum, we obtain a rms of  K for band 1a and
  K for band 4b. All spectra here were analyzed using the XCLASS program (https://www.astro.uni-koeln.de/projects/schilke/XCLASS), which provides access to the CDMS and JPL molecular catalogs (Müller et al. 2001, 2005; Pickett et al. 1998) for identifying lines and obtaining the molecular parameters of methanol (Xu & Lovas 1997; Xu et al. 2008).
3. Results
3.1. Detection of distinctive methanol bands
There are 223 and 141 methanol lines with vt = 0 and 1 detected in HIFI bands 1a and 4b, respectively. No molecular and frequency information for transitions with vt > 1 is available at present from the CDMS and JPL catalogs. Among these detected methanol lines, 112 in band 1a and 73 in band 4b are isolated transitions. The rest are transitions which are blended with either other methanol transitions or lines of other molecules. These detected isolated methanol transitions span a wide range in upper state energy (0–1000 K). The focus of this paper is to investigate how we can utilize the advantage offered by methanol – having many transitions within small frequency ranges – to probe the physical conditions in the emitting region. For this purpose, we look for groups of isolated methanol transitions which are confined within small frequency range in the spectrum but which also cover a wide range in upper state energy with minimal line blending. This approach is useful as it shows an example of how physical conditions can be probed by observing only a limited spectral range.
Among all the detected methanol lines, there are two very distinctive methanol bands in HIFI bands 1a and 4b – both are constructed with a series of methanol lines confined within a few GHz range and have a similar characteristic spectral shape. Figure 1 shows the spectra of these two methanol bands. The first covers 521.7 to 525.6 GHz in HIFI band 1a (upper panel). The 4 GHz spectrum includes the methanol band peaked at 524.8 GHz, which is defined as the “524 GHz methanol band” in this paper. The second covers from 1056.1 to 1065.6 GHz in HIFI band 4b (lower panel). The 10 GHz spectrum includes the methanol band peaked at 1061.6 GHz, which is defined as the “1061 GHz methanol band” in this paper.
In the 524 GHz methanol band, 31 methanol lines are detected: 27 isolated methanol transitions (labeled in red numbers 1–27), 2 lines either blended with other methanol transitions or transitions from other molecules (labeled in blue), and 2 lines which are blended with methanol transitions having the same quantum numbers (J, K, vt) but different parity with either E, A+, or A− state (defined as the blended “B” lines and labeled as “B” in green). Methanol has E and A symmetric states, which are considered as different species as no radiative transitions are allowed between them. A-type methanol can be further separated as + and − parity. Figure 1 shows that the 524 GHz methanol band is dominated by isolated transitions, which are mostly ΔJ = 0, K = −4 → −3 Q branch with vt = 0 representing the torsional ground state. On the other hand, in the 1061 GHz methanol band, 42 methanol lines are detected: 15 isolated transitions (labeled in red numbers 28–42), 6 lines blended with others, and 21 blended “B” lines. Figure 1 shows that, unlike the 524 GHz methanol band, the 1061 GHz methanol band is dominated by the blended “B” lines mostly with ΔJ = 0, K = 7 → 6, vt = 0 transitions.
Detected isolated CH3OH Lines.
Table 1 lists the molecular parameters of the 42 isolated transitions, including 37 E-type (33 vt = 0 and 4 vt = 1) and 5 A-type (4 vt = 0 and 1 vt = 1) methanol transitions, their peak intensities in units of antenna temperature (TA∗), line frequency ν, upper state energy Eu, and Sμ2 where S and μ are the line strength and dipole moment, respectively. The peak intensities are estimated with baseline continuum subtracted; the continuum level ~1.23 K for band 1a and ~6.45 K for band. These methanol lines have peak intensities between 0.4 and 12 K. They are widely spread in upper state energy, which ranges from 80 to 900 K, covering almost the same energy range as those detected from the entirety of methanol lines detected in bands 1a and 4b. This energy range is sensitive to kinetic temperatures anticipated in molecular clouds, and these lines are thus a good set of transitions to probe the cloud conditions. We only focus on those 33 isolated E-type vt = 0 (25 in band 1a and 8 in band 4b), in order not to get too involved in complicated excitation issues, any potential A/E abundance variations, and any vt > 0 transitions that can be excited through radiative pumping of the strong Nν12 torsional bands.
Furthermore, among all 112 isolated methanol lines detected in the whole of band 1a, there are in total 55 isolated E-type vt = 0 transitions. This means that 25 (almost 50%) out of the total 55 lines in band 1a (covering 80 GHz) are located within the 4 GHz bandwidth of this 524 methanol band. On the other hand, among the 73 isolated methanol lines detected in whole band 4b, there are in total 36 isolated E-type vt = 0 transitions – only ~20% of them are located in the 1061 GHz methanol band. The fact that the 524 GHz methanol band is dominated by isolated transitions while the 1061 GHz methanol band is mostly constructed with blended “B” lines, suggests that the 524 GHz methanol band is more suitable for exploration of the physical conditions. Hereafter, when we use the terms “524 GHz methanol band” and “1061 GHz methanol band” we are referring only to those isolated E-type vt = 0 transitions.
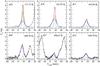 |
Fig.2 Spectra of six isolated methanol lines. Each spectrum is plotted with the data (black) and the two-component Gaussian fit (red) to the data, which includes a narrower component (green) and wider component (blue). The number in the upper left corner and the energy (in K) in the upper right corner of each panel indicate the associated methanol transition and its upper state energy given in Table1. |
3.2. Resolving different kinematic components in Orion KL
Figure 2 plots the spectra of six isolated methanol lines with different upper state energies. All methanol lines show asymmetry in the line profiles, indicating the existence of multiple contributions from different kinematic components in Orion KL, as suggested previously. For example, a high resolution VLA spectrum of one methanol line toward Orion KL (Wilson et al. 1989) shows one narrower (linewidth ΔV ~ 2 kms-1, and VLSR = 7.6 kms-1) and one wider (ΔV ~ 7 kms-1, and VLSR ~ 6.2−9.2 km s-1) component. Consistent with previous results, the detected isolated methanol lines in Table 1 can all be fit with two Gaussians (see Fig. 2): (1) a narrow component at VLSR = 8.6 kms-1 with ΔV = 2.7 km s-1, and (2) one wide component at VLSR = 6−9 kms-1 with ΔV = 4−11 kms-1. Therefore, we fitted all methanol lines with fixed VLSR at 8.6 kms-1 and ΔV at 2.7 kms-1 for the narrow component, and freely fitting the VLSR and ΔV for the wide component. It is well known that there are distinct spatial components (hot core, outflow, and compact ridge) along the line of sight that can be distinguished by their kinematic signature in the molecular emission profile (e.g., Blake et al. 1987; Persson et al. 2007). Based on this information, we assign the VLSR = 8.6 kms-1 component to the compact ridge, and the VLSR = 6−9 kms-1 component to the outflow.
Detected 13CH3OH counterparts.
3.3. 13CH3OH counterparts for those detected methanol transitions
In order to estimate the opacities of these 12CH3OH transitions, we look for their 13CH3OH counterparts throughout the whole band 1a. 13 of these 25 methanol transitions in HIFI band 1a with Eu < 37 K have 13CH3OH counterparts detected (Table 2). We did not search 13CH3OH for those transitions in 4b because no molecular information of 13CH3OH transitions with frequency above 1 THz are available in either the CDMS and JPL catalogs. Figure 3 plots four selected methanol lines and their 13CH3OH counterparts. Following the same strategy to separate different kinematic components as shown in Sect. 3.2, we then obtain the spectra for the compact ridge and the outflow component of each 13CH3OH line. By comparing CH3OH and 13CH3OH lines, optical depth (τ) for compact ridge and outflow components can be estimated using  (1)where we have assumed that CH3OH and 13CH3OH have the same excitation temperature, CH3OH is optically thick, and τ13 = τ12 / f, where f is the 13C to 12C abundance ratio ~60 (e.g., Sheffer et al. 2007). T12 and T13 are the observed peak intensity for CH3OH and 13CH3OH lines. Table 2 gives the estimated CH3OH τ12 for the compact ridge and the outflow, and we see that they are mostly <10. We also estimate an upper limit of τ12 ~ 15 for those methanol lines with Eu > 370 K using the three times of the the band 1a rms (rms: K) as the upper limit for all undetected 13CH3OH emissions.
4. Population diagrams of the isolated transitions
Population diagrams are one traditional, but effective, way to display the relative populations of different energy states, generally obtained from a set of observed transitions (Goldsmith & Langer 1999). This is a useful tool to study the physical conditions in the gas, as the relative populations of different states change as a function of kinetic temperature and density. A population diagram plots the upper state energy Eu as the x axis and the logarithm of Nu/gu as the y axis, where Nu and gu are the column density and statistical weight in the upper state, respectively. Nu can be derived from the observed integrated line intensity of the associated transition with Eq. (9) in Goldsmith & Langer (1999). Therefore, if all energy levels are thermalized with single kinetic temperature (LTE), the population diagram should be a straight line with the slope and y-intercept presenting the kinetic temperature and total column density.
 |
Fig.3 Spectra of four isolated methanol lines (black) plotted with their 13CH3OH counterparts (red), which are scaled by a factor of two in order to be compared to methanol lines more clearly. The number in the upper left corner and the energy (in K) in the upper right corner of each panel indicate the associated methanol transition and its upper state energy given in Table 1. |
 |
Fig.4 Population diagrams of detected 33 E-type vt = 0 methanol transitions for a) the compact ridge and b) the outflow. Transitions in HIFI bands 1a and 4b are plotted in black and red, respectively. Transitions of 13CH3OH are plotted in blue. Straight lines are fitted in order to obtain temperature estimates assuming LTE. |
 |
Fig.5 Population diagrams of the 524 GHz methanol band (in black) and the other 30 isolated E-type methanol transitions detected throughout the rest of 1a (in red), for (a) the compact ridge and (b) the outflow, respectively. The fitted straight lines from Fig. 4 are also plotted for comparison. |
Figure 4 shows the population diagrams, without correcting for possible beam dilution and opacity, for the detected isolated 33 transitions of E-type vt = 0 methanol and their 13CH3OH counterparts for the compact ridge (upper panel) and the outflow (lower panel), respectively. The straight lines shown in this figure are the slopes determined from least squares fitting with a linear function. We do not include the HIFI band 4b transitions in the fitting as they are observed with different beam sizes. This figure shows that a curvature in the methanol population diagram is clearly seen for the compact ridge, which will be further examined in Sect. 5. However, there are not enough 13CH3OH transitions to confirm whether this curvature is also shown for 13CH3OH in compact ridge.
Unlike the curvature seen in the compact ridge data, the populations of the 1a transitions from the outflow can be satisfactorily represented by a single kinetic temperature in LTE of 184 K and 94 K for CH3OH and 13CH3OH, respectively. The 13CH3OH temperature might be a better approximation to the true kinetic temperature in this system because its emission is optically thin. However, the level populations derived from transitions within the 1061 GHz methanol band arising from the outflow exhibit a higher degree of scatter compared to those from compact ridge. This might suggest that the higher spatial resolution observations at 1 THz are less well coupled to the outflow and perhaps are contaminated by emission from other components such as the hot core. It is intriguing that the outflow in Orion KL is consistent with a single gas temperature, as outflow shocks are thought to be gas composed of a range of temperatures. It is likely that the derived temperature is simply showing an average gas temperature in this system.
In addition, in order to verify whether the curvature in the compact ridge and the single temperature population in the outflow are still valid for those transitions outside the selected distinctive methanol bands, we compare the population diagram of the 524 GHz methanol band with that from the 30 isolated E-type vt = 0 transitions in HIFI band 1a. Figure 5 plots the population diagrams for the 524 GHz methanol band (in black) and the rest 30 lines (in red). A curvature is still present in compact ridge and all the level populations in the outflow can still be fitted with a straight line. The fitted straight lines indicating rotation temperatures of 125 and 184 K from Fig. 4 are plotted for comparison. This figure also shows that the addition of these 30 transitions increases the scatter in the population diagram for both compact ridge and outflow. As these 30 transitions are actually dominated by different Q branches, compared to those in the 524 GHz methanol band, this scatter is possibly due to a deviation from LTE for populations within different K ladders.
5. Probing the thermal structure in the Orion KL compact ridge
 |
Fig.6 Modeled spectra compared with the those observed in the 524 GHz methanol band (panel a), for models with constant temperature of 50 (panel b), 100 (panel c), and 150 K (panel d), assuming the compact ridge is a spherical clump 5′′ in radius (r), constant molecular hydrogen number density 107 cm-3, and methanol abundance 10-6. |
As shown is Sect. 4, a curvature is present in the methanol population diagram of compact ridge, which cannot be fitted well with LTE excitation at a single temperature (Fig. 4). It has also been suggested in Fig. 5 that non-LTE excitation exists for methanol in the compact ridge, at least between transitions with different K ladders. Indeed, Leurini et al. (2004) has shown that LTE can be a poor assumption for methanol even in clouds with high densities. However, to date, only transitions with up to upper state energies ~350 K have available collision rates for any non-LTE modeling; while the 524 GHz methanol band includes upper state energies from 80 to 900 K. In addition, according to Fig. 4, 0−350 K is not a wide enough energy range to clearly distinguish a curve from a straight line in the population diagram.
Nevertheless, despite the currently limited capability for any non-LTE excitation modeling for all the detected transitions in the 524 GHz methanol band, it is intriguing that their population diagram shows such a cohesive curvature for compact ridge. This curvature might suggest presences of large opacity variations, thermal gradients, and/or non-LTE excitation. Indeed, the opacity estimation in Sect. 3.3 (also see Table 2) is not negligible and can indeed affect the population diagram slope. In addition, thermal gradients are another potential contributor to this observed curvature. It has been suggested that the compact ridge is externally heated due to its very narrow linewidth and high temperature, inconsistent with normal centrally heated star-forming cores (Blake et al. 1987).
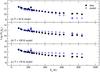 |
Fig.7 Population diagrams of the observed 524 GHz methanol band (in black) and those models (in blue) shown in Fig. 6. |
In order to investigate how temperature gradients impact the curvature in a population diagram, we assume the compact ridge to be a spherical clump 5′′−10′′ in radius (r), having constant molecular hydrogen number density of 107 cm-3, and a constant methanol fractional abundance of 10-5−10-7, as previously suggested (e.g., Beuther et al. 2006; Persson et al. 2007). We consider various radial temperature profiles, and at each given point in the modeled clump, all energy levels are assumed to be populated in LTE with the temperature appropriate for that radius. With given level populations thus determined, we then use the ray propagation part of 1D RATRAN program (Hogerheijde & van der Tak 2000) to generate a synthetic spectrum for the 524 GHz methanol band observed with a 40′′ beam, consistent with the beam size in HIFI band 1a.
 |
Fig.8 a) The 524 GHz methanol band spectrum. b) The best fit externally heated modeled spectrum. c) Modeled spectrum of a centrally heated clump with temperature decreasing from 140 K in the center to 30 K on the clump surface. |
 |
Fig.9 a) Population diagrams for the HIFI band 1a (the 524 GHz methanol band, in black) and HIFI band 4b (the 1061 GHz methanol band, in red) methanol bands and the best fit externally heated model for HIFI band 1a transitions (in blue) and HIFI band 4b transitions (in green). b) Population diagrams for the HIFI band 1a (the 524 GHz methanol band, in black) and HIFI band 4b (the 1061 GHz methanol band, in red) methanol bands and the centrally heated model (1a in blue and 4b in green) for a clump with temperature decreasing from 140 K in the center to 30 K on the clump surface. |
Figures 6 and 7 plot models with constant temperatures, to illustrate how the shape of this 524 GHz methanol band and its population diagram varies with different temperatures. Each modeled spectrum is constructed by combining the modeled compact ridge spectrum with the observed outflow spectrum. These two plots show that the observed spectrum cannot be explained by a constant temperature in LTE.
We next explore two approaches with nonuniform temperatures: central heating and external heating. First, we examine whether a centrally-heated source can result in the observed spectrum with a temperature range from a few hundred K in the center of the clump decreasing to 30−50 K in its outer layer, which is consistent with the quiescent gas temperature along the line of sight (Bergin et al. 1994). We allow any methanol abundance variation within the range 10-5 to 10-7. We were unable to find any models within these parameter ranges that provided a satisfactory match to the observed spectrum. The cold layer in the outer part of the clump always results in large opacities which produce much optically thicker lines than are observed.
Second, we considered the possibility of externally-heated clumps and obtained a good fit that can reproduce the observed spectrum of the 524 GHz methanol band. The best fit is to a model of the compact ridge as a 7.5′′ (0.016 pc) spherical clump with a constant molecular hydrogen number density of 107 cm-3, a temperature profile with constant 30 K for r < 5.0′′, T ~ r3.8 outside r > 5.0′′, and a constant methanol abundance of 3 × 10⁻⁶ and 3 × 10⁻⁷ in the inner and outer part of the clump. This corresponds to a methanol column density of 9.5 × 1018 cm-2 and 9.5 × 1017 cm-2 in the inner and outer part of the clump, respectively. This gives a temperature of 120 K on the clump surface. We stress that the assumed temperature profile in this model is not based on any self-consistent calculation, but rather is a way to explore the range of gradients needed to obtain the observed level populations. PDR models do show that gas heating can produce such sharp gradients as modelled here (Kaufman et al. 1999) and in the future we will examine more physically-motivated solutions. Figure 8 plots the 524 GHz methanol band spectrum and the modeled spectrum for this best fit externally-heated solution in panel (a) and (b), respectively, and their associated population diagrams in Fig. 9a. We also apply this model for transitions detected in HIFI band 4b to generate its synthetic spectrum appropriate for a 20′′ beam, and further produce its population diagram shown in Fig. 9a. Figures 8c and 9b plot the modeled spectrum and its associated population diagram for one of the internally heated models we tested, for comparison, in order to show that the internally heated models can not explain the observed spectrum.
We conclude that the compact ridge is externally heated with the warm clump surface in front of the cold gas along the line of sight in LTE. Although our results show an external heated cloud can indeed result in a curvature in the observed population diagram, non-LTE excitation, such as far-infrared pumping, is also a possible contributor, which could potentially improve the fit for transitions having higher upper state energies.
6. Conclusions
We have examined the methanol emission in HIFI bands 1a and 4b from our spectral scan observations toward Orion KL. In bands 1a and 4b, 223 and 141 methanol lines are identified. In band 1a, 112 out of the total 223 lines, and in band 4b, 73 out of the 141 lines are isolated transitions. In order to minimize the confusion due to any blends, abundance variation between E- and A-type methanol, and optically pumping effects for vt > 0 transitions, we have focused on the isolated E-type vt = 0 transitions within two methanol bands: methanol is known to have numerous transitions from far-infrared to millimeter regime, often including different symmetric states (A and E), parities, and torsional states, and blends. This makes the modeling and interpretation of underlying physical conditions difficult. But with the approach in this paper – focusing on one type of isolated methanol transitions – methanol can be a very useful tool to probe the physical conditions in molecular clouds. In particular, the 524 GHz methanol band, including 25 isolated E-type vt = 0 transitions with upper state energy ranging from 80 to 900 K, provides a valuable set of lines that can be easily observed simultaneously and used to examine the temperature and other physical conditions. Furthermore, by resolving emission from different kinematic components (compact ridge and outflow) for each transition, we find a curved slope in the population diagram for the methanol emission from the compact ridge. We suggest that this can be explained by externally heating. Unlike the compact ridge, the population diagram of the outflow component shows a highly linear relation, suggesting a single temperature, but which might be the average temperature of the outflowing gas. Our study has shown that, with HIFI’s broad instantaneous frequency coverage, these methanol bands can be very useful for probing the structure of molecular clouds having various physical conditions.
Acknowledgments
HIFI has been designed and built by a consortium of institutes and university departments from across Europe, Canada and the United States under the leadership of SRON Netherlands Institute for Space Research, Groningen, The Netherlands and with major contributions from Germany, France and the US. Consortium members are: Canada: CSA, U. Waterloo; France: CESR, LAB, LERMA, IRAM; Germany: KOSMA, MPIfR, MPS; Ireland, NUI Maynooth; Italy: ASI, IFSI-INAF, Osservatorio Astrofisico di Arcetri– INAF; The Netherlands: SRON, TUD; Poland: CAMK, CBK; Spain: Observatorio Astronmico Nacional (IGN), Centro de Astrobiologa (CSIC-INTA). Sweden: Chalmers University of Technology – MC2, RSS & GARD; Onsala Space Observatory; Swedish National Space Board, Stockholm University – Stockholm Observatory; Switzerland: ETH Zurich, FHNW; USA: Caltech, JPL, NHSC. The HEXOS team also is grateful to the HIFI instrument team for building a fantastic instrument. Support for this work was provided by NASA through an award issued by JPL/Caltech.
References
- Bergin, E. A., Goldsmith, P. F., Snell, R. L., & Ungerechts, H. 1994, ApJ, 431, 674 [NASA ADS] [CrossRef] [Google Scholar]
- Bergin, E. A., Phillips, T. G., Comito, C., et al. 2010, A&A, 521, L20 [NASA ADS] [CrossRef] [EDP Sciences] [Google Scholar]
- Beuther, H., Zhang, Q., Reid, M. J., et al. 2006, ApJ, 636, 323 [NASA ADS] [CrossRef] [Google Scholar]
- Blake, G. A., Sutton, E. C., Masson, C. R., & Phillips, T. G. 1987, ApJ, 315, 621 [NASA ADS] [CrossRef] [Google Scholar]
- de Graauw, T., Helmich, F. P., Phillips, T. G., et al. 2010, A&A, 518, L6 [Google Scholar]
- Friberg, P., Hjalmarson, A., Madden, S. C., & Irvine, W. M. 1988, A&A, 195, 281 [Google Scholar]
- Genzel, R., & Stutzki, J. 1989, ARA&A, 27, 41 [NASA ADS] [CrossRef] [Google Scholar]
- Goldsmith, P. F., & Langer, W. D. 1999, ApJ, 517, 209 [NASA ADS] [CrossRef] [Google Scholar]
- Hogerheijde, M. R., & van der Tak, F. F. S. 2000, A&A, 362, 697 [NASA ADS] [Google Scholar]
- Kama, M., Dominik, C., Maret, S., et al. 2010, A&A, 521, L39 [NASA ADS] [CrossRef] [EDP Sciences] [Google Scholar]
- Kaufman, M. J., Wolfire, M. G., Hollenbach, D. J., & Luhman, M. L. 1999, ApJ, 527, 795 [NASA ADS] [CrossRef] [Google Scholar]
- Leurini, S., Schilke, P., Menten, K. M., et al. 2004, A&A, 422, 573 [NASA ADS] [CrossRef] [EDP Sciences] [Google Scholar]
- Menten, K. M., Walmsley, C. M., Henkel, C., & Wilson, T. L. 1988, A&A, 198, 253 [NASA ADS] [Google Scholar]
- Müller, H. S. P., Thorwirth, S., Roth, D. A., & Winnewisser, G. 2001, A&A, 370, L49 [NASA ADS] [CrossRef] [EDP Sciences] [Google Scholar]
- Müller, H. S. P., Schlöder, F., Stutzki, J., & Winnewisser, G. 2005, J. Mol. Struct., 742, 215 [NASA ADS] [CrossRef] [Google Scholar]
- Ott, S., Science Centre, H., & Space Agency, E. 2010, in ASP Conf. Ser., Astronomical Data Analysis Software and Systems XIX, Y. Mizumoto, K.-I. Morita, and M. Ohishi, eds., in press [Google Scholar]
- Persson, C. M., Olofsson, A. O. H., Koning, N., et al. 2007, A&A, 476, 807 [NASA ADS] [CrossRef] [EDP Sciences] [Google Scholar]
- Pickett, H. M., Poynter, I. R. L., Cohen, E. A., et al. 1998, J. Quant. Spectros. Rad. Trans., 60, 883 [Google Scholar]
- Pilbratt, G. L., Riedinger, J. R., Passvogel, T., et al. 2010, A&A, 518, L1 [CrossRef] [EDP Sciences] [Google Scholar]
- Sheffer, Y., Rogers, M., Federman, S. R., Lambert, D. L., & Gredel, R. 2007, ApJ, 667, 1002 [NASA ADS] [CrossRef] [Google Scholar]
- Wilson, T. L., Johnston, K. J., Henkel, C., & Menten, K. M. 1989, A&A, 214, 321 [NASA ADS] [Google Scholar]
- Xu, L., & Lovas, F. J. 1997, J. Phys. Chem. Ref. Data, 26, 17 [NASA ADS] [CrossRef] [Google Scholar]
- Xu, L., Fisher, J., Lees, R. M., et al. 2008, J. Mol. Spectr., 251, 305 [NASA ADS] [CrossRef] [Google Scholar]
All Tables
All Figures
|
Fig.1 HIFI spectra of two methanol bands in band 1a (521.7–525.6 GHz; upper panel) and 4b (1056.1–1065.6 GHz; lower panel). Red number 1-42 label isolated methanol transitions, which are also listed in Table 1. Blue texts label transitions from other molecules and the methanol transitions which are blended. Green texts and “B” label the methanol lines which are blended with different parity states. “U” labels two unidentified lines. |
| In the text | |
|
Fig.2 Spectra of six isolated methanol lines. Each spectrum is plotted with the data (black) and the two-component Gaussian fit (red) to the data, which includes a narrower component (green) and wider component (blue). The number in the upper left corner and the energy (in K) in the upper right corner of each panel indicate the associated methanol transition and its upper state energy given in Table1. |
| In the text | |
|
Fig.3 Spectra of four isolated methanol lines (black) plotted with their 13CH3OH counterparts (red), which are scaled by a factor of two in order to be compared to methanol lines more clearly. The number in the upper left corner and the energy (in K) in the upper right corner of each panel indicate the associated methanol transition and its upper state energy given in Table 1. |
| In the text | |
|
Fig.4 Population diagrams of detected 33 E-type vt = 0 methanol transitions for a) the compact ridge and b) the outflow. Transitions in HIFI bands 1a and 4b are plotted in black and red, respectively. Transitions of 13CH3OH are plotted in blue. Straight lines are fitted in order to obtain temperature estimates assuming LTE. |
| In the text | |
|
Fig.5 Population diagrams of the 524 GHz methanol band (in black) and the other 30 isolated E-type methanol transitions detected throughout the rest of 1a (in red), for (a) the compact ridge and (b) the outflow, respectively. The fitted straight lines from Fig. 4 are also plotted for comparison. |
| In the text | |
|
Fig.6 Modeled spectra compared with the those observed in the 524 GHz methanol band (panel a), for models with constant temperature of 50 (panel b), 100 (panel c), and 150 K (panel d), assuming the compact ridge is a spherical clump 5′′ in radius (r), constant molecular hydrogen number density 107 cm-3, and methanol abundance 10-6. |
| In the text | |
|
Fig.7 Population diagrams of the observed 524 GHz methanol band (in black) and those models (in blue) shown in Fig. 6. |
| In the text | |
|
Fig.8 a) The 524 GHz methanol band spectrum. b) The best fit externally heated modeled spectrum. c) Modeled spectrum of a centrally heated clump with temperature decreasing from 140 K in the center to 30 K on the clump surface. |
| In the text | |
|
Fig.9 a) Population diagrams for the HIFI band 1a (the 524 GHz methanol band, in black) and HIFI band 4b (the 1061 GHz methanol band, in red) methanol bands and the best fit externally heated model for HIFI band 1a transitions (in blue) and HIFI band 4b transitions (in green). b) Population diagrams for the HIFI band 1a (the 524 GHz methanol band, in black) and HIFI band 4b (the 1061 GHz methanol band, in red) methanol bands and the centrally heated model (1a in blue and 4b in green) for a clump with temperature decreasing from 140 K in the center to 30 K on the clump surface. |
| In the text | |
Current usage metrics show cumulative count of Article Views (full-text article views including HTML views, PDF and ePub downloads, according to the available data) and Abstracts Views on Vision4Press platform.
Data correspond to usage on the plateform after 2015. The current usage metrics is available 48-96 hours after online publication and is updated daily on week days.
Initial download of the metrics may take a while.