| Issue |
A&A
Volume 519, September 2010
|
|
|---|---|---|
| Article Number | A56 | |
| Number of page(s) | 9 | |
| Section | Extragalactic astronomy | |
| DOI | https://doi.org/10.1051/0004-6361/201014272 | |
| Published online | 14 September 2010 | |
Infrared/optical - X-ray simultaneous observations of X-ray flares in GRB 071112C and GRB 080506
T. Uehara1 - M. Uemura2 - K. S. Kawabata2 - Y. Fukazawa1 - R. Yamazaki3 - A. Arai4 - M. Sasada1 - T. Ohsugi2 - T. Mizuno1 - H. Takahashi1 - H. Katagiri1 - T. Yamashita5 - M. Ohno6 - G. Sato6 - S. Sato7 - M. Kino7
1 - Department of Physical Science, Hiroshima University,
Kagamiyama 1-3-1, Higashi-Hiroshima 739-8526, Japan
2 -
Hiroshima Astrophysical Science Center, Hiroshima University, Kagamiyama
1-3-1, Higashi-Hiroshima 739-8526, Japan
3 -
Department of Physics and Mathematics,
Aoyama Gakuin University, 5-10-1 Fuchinobe,
Sagamihara 252-5258, Japan
4 -
Faculty of Science, Kyoto Sangyo University, Motoyama,
Kamigamo, Kita-Ku, Kyoto-City 603-8555, Japan
5 -
National Astronomical Observatory of Japan, 2-21-1 Osawa,
Mitaka, Tokyo 181-0015, Japan
6 -
Institute of Space and Astronautical Science, JAXA, 3-1-1
Yoshinodai, Sagamihara, Kanagawa 229-8510, Japan
7 -
Department of Physics, Nagoya University, Furo-cho,
Chikusa-ku, Nagoya 464-8602, Japan
Received 17 February 2010 / Accepted 25 May 2010
Abstract
Aims. We investigate the origin of short X-ray flares which
are occasionally observed in early stages of afterglows of gamma-ray
bursts (GRBs).
Methods. We observed two Swift
events, GRB 071112C and GRB 080506, before the start of X-ray
flares in the optical and near-infrared (NIR) bands with the 1.5-m
Kanata telescope. In conjunction with published X-ray and optical data,
we analyzed densely sampled light curves of the early afterglows and
spectral energy distributions (SEDs) in the NIR-X-ray ranges.
Results.
We found that the SEDs had a break between the optical and X-ray bands
in the normal decay phases of both GRBs regardless of the model for the
correction of the interstellar extinction in host galaxies of GRBs. In
the X-ray flares, X-ray flux increased by 3 and 15 times in the case of
GRB 071112C and 080506, respectively, and the X-ray spectra became
harder than those in the normal decay phases. No significant variation
in the optical-NIR range was detected together with the X-ray flares.
Conclusions.
These results suggest that the X-ray flares were associated with either
late internal shocks or external shocks from two-component jets.
Key words: gamma-ray burst: individual: GRB 071112C - gamma-ray burst: individual: GRB 080506
1 Introduction
Gamma-ray bursts (GRBs) are transient gamma-ray sources whose durations areX-ray observations with the Swift satellite have discovered short flares in X-ray afterglows 102-4 s after GRBs. These X-ray flares are unexpected in the framework of the standard external shock model because it predicts a monotonous decay of the X-ray afterglow with a power-law form (Burrows et al. 2005). The X-ray flare is observed in a half of GRB afterglows (Falcone et al. 2007). The afterglow emission from the external shock could exhibit short-term modulations when a shell passes a high-density region of the interstellar medium (Wang & Loeb 2000), or slow shells catch up with the main shell (Rees & Meszaros 1998). Such modulations of the emission from the external shock are candidates for the origin of the X-ray flare. It is also possible that a late-time internal shock causes the X-ray flare (e.g. Butler & Kocevski 2007; Chincarini et al. 2010,2007; Zhang et al. 2006a; Burrows et al. 2005). This scenario with the late internal shock requires a long activity of the central engine of GRBs (Ioka et al. 2005).
The optical and infrared observations of afterglows are important to evaluate the models for the X-ray flare because the external shock model predicts that an optical-infrared flare is associated with an X-ray flare. No optical-infrared flare has been reported during the X-ray flares in previous observations, while a part of those observations were too sparse to investigate the detailed behavior of optical-infrared afterglows during the X-ray flares (Krimm et al. 2007; Stanek et al. 2007).
Little is known about the temporal variation of spectral energy distributions (SEDs) associated with the X-ray flare. This is because simultaneous multi-wavelength observations are required with a high time-resolution. In addition, it is problematic to correct the interstellar extinction in host galaxies of GRBs which is highly uncertain even if such a densely-sampled multi-wavelength data is available (e.g. see Watson et al. 2007; Schady et al. 2007; Stratta et al. 2004; Kann et al. 2006; Starling et al. 2007; Chen et al. 2006).
GRB 071112C and 080506 were detected by Swift/BAT at 18:32:57.54 UT 12 November 2007 (Perri et al. 2007) and 17:46:21.22 UT 6 May 2008 (Baumgartner et al. 2008), respectively. X-ray flares were detected in both GRBs (Sbarufatti et al. 2008; Stratta et al. 2007). Here we report on our optical and NIR observations of those two GRBs using the Kanata 1.5-m telescope. Combined with X-ray spectra, these simultaneous optical and NIR data allowed us to investigate the interstellar extinction in the host galaxies, and thereby, variations of SEDs. We describe the details of our observations in Sect. 2. We report on the temporal evolution of the optical and X-ray afterglows and SEDs in Sect. 3. In Sect. 4, we discuss the origin of the X-ray flare using the internal and external shock models. Finally, we summarize our results in Sect. 5.
1.1 Optical and NIR observation
Our observations of GRB 071112C and GRB 080506 started at 18:36:21 (UT)
12 November 2007 and 17:49:51 (UT) 6 May 2008,
which were ![]() 324 s and
324 s and ![]() 210 s
after the GRB trigger times, respectively.
Both observations were performed with TRISPEC attached to the Kanata
1.5-m telescope at Higashi-Hiroshima Observatory of Hiroshima University.
TRISPEC is a simultaneous imager and spectrograph with polarimetry
covering both optical and NIR wavelengths (Watanabe et al. 2005).
We used the imaging mode of TRISPEC with the V, J, and
210 s
after the GRB trigger times, respectively.
Both observations were performed with TRISPEC attached to the Kanata
1.5-m telescope at Higashi-Hiroshima Observatory of Hiroshima University.
TRISPEC is a simultaneous imager and spectrograph with polarimetry
covering both optical and NIR wavelengths (Watanabe et al. 2005).
We used the imaging mode of TRISPEC with the V, J, and ![]() band filters for GRB 071112C. Instead of the V-band filter,
we used the
band filters for GRB 071112C. Instead of the V-band filter,
we used the ![]() -band filter for GRB 080506.
The observations continued for 4.5 and 5.7 ks,
and we obtained 40 and 35 sets of three photometric band
images for GRB 071112C and GRB 080506, respectively.
The central wavelength of
the TRISPEC's
-band filter for GRB 080506.
The observations continued for 4.5 and 5.7 ks,
and we obtained 40 and 35 sets of three photometric band
images for GRB 071112C and GRB 080506, respectively.
The central wavelength of
the TRISPEC's ![]() system is
system is ![]()
![]() ,
slightly shifted from the standard one (=
,
slightly shifted from the standard one (=
![]() ).
The difference of the photometric systems is so small that
we neglect it in our following discussion about spectral
energy distributions.
).
The difference of the photometric systems is so small that
we neglect it in our following discussion about spectral
energy distributions.
We obtained differential magnitudes of the afterglows
using a Java-based PSF photometry package
after making dark-subtracted and flat-fielded images.
We used a nearby field-star located at
![]() ,
,
![]() as a comparison star for GRB 071112C.
The V, J, and
as a comparison star for GRB 071112C.
The V, J, and ![]() -band magnitudes
of the comparison star were quoted from the Guide Star Catalog Version 2.3.2
(V=14.43) and 2MASS All-Sky Catalog of Point Sources (J=13.238 and
-band magnitudes
of the comparison star were quoted from the Guide Star Catalog Version 2.3.2
(V=14.43) and 2MASS All-Sky Catalog of Point Sources (J=13.238 and
![]() ), respectively.
We checked systematic errors of
V, J, and
), respectively.
We checked systematic errors of
V, J, and ![]() magnitudes
depending on comparison stars, and found that it is smaller than 0.28, 0.02, and 0.02 mag,
using neighboring stars.
Uemura et al. (2007b) contains differential magnitudes obtained
by our optical observations of GRB 071112C.
magnitudes
depending on comparison stars, and found that it is smaller than 0.28, 0.02, and 0.02 mag,
using neighboring stars.
Uemura et al. (2007b) contains differential magnitudes obtained
by our optical observations of GRB 071112C.
For the differential photometry of GRB 080506,
we used averages of magnitudes of
USNO B1.0 1289-0511223, 1289-0511261, 1289-0511235, 1289-0511157,
and 1289-0511139 for the ![]() band,
2MASS 1289-0511197, 1289-0511261, 1289-0511235, 1289-0511157,
and 1289-0511139 for the J band,
and 2MASS 1289-0511197 and 1289-0511261 for the
band,
2MASS 1289-0511197, 1289-0511261, 1289-0511235, 1289-0511157,
and 1289-0511139 for the J band,
and 2MASS 1289-0511197 and 1289-0511261 for the ![]() band.
We checked systematic errors of
band.
We checked systematic errors of ![]() ,
J, and
,
J, and ![]() magnitudes
depending on comparison stars,
and found that it is smaller than 0.13, 0.01, and 0.06 mag,
using neighboring USNO B1.0 and 2MASS stars.
Table 1 contains magnitudes obtained
by our observations of GRB 080506.
In this table, the magnitudes are averages in equally spaced bins
in the logarithmic scale of time.
The errors include both statistical and systematic ones.
magnitudes
depending on comparison stars,
and found that it is smaller than 0.13, 0.01, and 0.06 mag,
using neighboring USNO B1.0 and 2MASS stars.
Table 1 contains magnitudes obtained
by our observations of GRB 080506.
In this table, the magnitudes are averages in equally spaced bins
in the logarithmic scale of time.
The errors include both statistical and systematic ones.
Table 1: Kanata optical photometry of GRB 080506.
1.2 XRT analysis of GRB 071112C and GRB 080506
XRT began observing GRB 071112C and GRB 080506
at 2007 November 12 18:34:27 UT, i.e. at T+90 s and 2008 May 6 17:48:47 UT, i.e. at T+146 s, respectively
(T represents a GRB trigger time).
Both XRT data were processed using the HEASOFT package.
We extracted both source data with a
rectangular 40
![]() region for the Windowed Timing mode (WT),
and 40
region for the Windowed Timing mode (WT),
and 40
![]() radius region for the Photon Counting mode (PC)
from the processed data.
Both GRB backgrounds were also extracted from
40
radius region for the Photon Counting mode (PC)
from the processed data.
Both GRB backgrounds were also extracted from
40
![]() source of both ends region for the WT,
and 192
source of both ends region for the WT,
and 192
![]() internal and 231
internal and 231
![]() outer annulus radius region
for the PC, far from the source.
Light curves were binned with a requirement of a minimum of
30 photons per bin of WT and 20 photons per bin of PC for GRB 071112C,
while 30 photons per bin of WT and 40 photons per bin of PC for GRB 080506.
outer annulus radius region
for the PC, far from the source.
Light curves were binned with a requirement of a minimum of
30 photons per bin of WT and 20 photons per bin of PC for GRB 071112C,
while 30 photons per bin of WT and 40 photons per bin of PC for GRB 080506.
2 Results
2.1 Optical and X-ray light curves
![\begin{figure}
\par\includegraphics[angle=270,width=16.5cm,clip]{14272fg1.eps}
\end{figure}](/articles/aa/full_html/2010/11/aa14272-10/img22.png)
|
Figure 1:
X-ray and NIR-UV light curves of
afterglows of GRB 071112C ( left) and GRB 080506 ( right).
The flux density of the NIR-UV
afterglows are shifted by 2 in XRT;
100.5 in uvw1- (Oates & Stratta 2007);
100.0 in U- (Oates & Stratta 2007);
10-0.5 in B- (Oates & Stratta 2007);
10-1.0 in |
| Open with DEXTER | |
In Fig. 1,
we show the X-ray and NIR-UV light curves of
afterglows of GRB 071112C (left) and GRB 080506 (right).
The X-ray observations by XRT are indicated by the crosses.
The other symbols indicate the UV, optical, and NIR
observations as described in the figure.
In addition to our observations by the Kanata telescope, this figure
includes observations reported in GCN Circular: Yuan et al. (2007);
Uemura et al. (2007a); Klotz et al. (2007); Burenin et al. (2007);
Chen et al. (2007a); Nugent & Bloom (2007); Dintinjana et al. (2007); Oates & Stratta (2007);
Chen et al. (2007b); Updike et al. (2007); Ishimura et al. (2007); Greco et al. (2007);
Sposetti (2007); Yoshida et al. (2007); Uemura et al. (2007b); van der Horst & Wijers (2007);
Chandra & Frail (2007); Minezaki et al. (2007); Huang et al. (2008)
for GRB 071112C
and Baumgartner et al. (2008); Kawabata et al. (2008); Osborne et al. (2008);
Kann et al. (2008b); Kocka et al. (2008); de Postigo Ugarte et al. (2008);
McLean et al. (2008); Oates & Baumgartner (2008); Sbarufatti et al. (2008); Kann et al. (2008a);
Chandra & Frail (2008); Sahu et al. (2008); Maeno et al. (2008)
for GRB 080506.
According to Jakobsson et al. (2007a), the host galaxy of GRB 071112C
is detected at
![]() .
The host galaxy is so faint that its
contribution to the afterglow is negligible in our analysis.
The host galaxy of GRB 080506 was not detected.
.
The host galaxy is so faint that its
contribution to the afterglow is negligible in our analysis.
The host galaxy of GRB 080506 was not detected.
Table 2: Decay and spectral index of the X-ray afterglow of GRB 071112C.
The X-ray light curve of GRB 071112C
can be described with a broken power-law form;
![]() and,
and,
![]() with a weak X-ray flare between T+450 s and T+1270 s.
Excluding the X-ray flare phase, we calculated the decay indexes
(
with a weak X-ray flare between T+450 s and T+1270 s.
Excluding the X-ray flare phase, we calculated the decay indexes
(![]() and
and ![]() ), and show them in Table 2.
The break time (
), and show them in Table 2.
The break time (
![]() )
was estimated
to be
)
was estimated
to be
![]() ks.
Table 2 also includes the decay indexes during
the rising and decay phases of the X-ray flare which we calculated
assuming a single power-law form.
The optical light curves
show a brightening trend before T+365 s.
After the maximum, the flux decayed as a single power-law
without a break as observed in the X-ray afterglow.
We confirmed that the decay indexes
are same in all NIR to UV bands within errors.
The decay index was,
hence, calculated with all NIR-UV observations,
and shown in Table 3.
ks.
Table 2 also includes the decay indexes during
the rising and decay phases of the X-ray flare which we calculated
assuming a single power-law form.
The optical light curves
show a brightening trend before T+365 s.
After the maximum, the flux decayed as a single power-law
without a break as observed in the X-ray afterglow.
We confirmed that the decay indexes
are same in all NIR to UV bands within errors.
The decay index was,
hence, calculated with all NIR-UV observations,
and shown in Table 3.
The X-ray light curve of GRB 080506 (the right panel of Fig. 1)
is more complex than that of GRB 071112C.
Before T+200 s, the X-ray flux remained at a high level,
which may be related to the prompt emission (Sbarufatti et al. 2008; McLean et al. 2008).
A steep decay was observed from T+200 s to T+350 s.
Between T+350 s and T+672 s,
it showed an X-ray flare centered at
![]() s.
The X-ray afterglow finally entered a normal decay phase
after the X-ray flare.
The optical and NIR light curves of GRB 080506
can be described with a broken power-law model.
The power-law decay index changes after a break time at T+1.3 ks.
The calculated decay indexes are summarized in Tables 3
and 4.
s.
The X-ray afterglow finally entered a normal decay phase
after the X-ray flare.
The optical and NIR light curves of GRB 080506
can be described with a broken power-law model.
The power-law decay index changes after a break time at T+1.3 ks.
The calculated decay indexes are summarized in Tables 3
and 4.
Table 3: Decay indexes of the optical light curves.
We succeeded in obtaining dense NIR, optical, and UV light curves
around X-ray flares both in GRB 071112C and GRB 080506.
At the X-ray flare maxima, the X-ray flux increased by a factor
of 3.5 and 15 in GRB 071112C and GRB 080506,
respectively.
On the other hand, the NIR-UV light curves exhibit no significant
variations associated with the X-ray flares in both GRBs. The variation
amplitudes are <![]() in V for GRB 071112C,
and <
in V for GRB 071112C,
and <![]() in
in ![]() for GRB 080506.
for GRB 080506.
Table 4: Decay and spectral index of the X-ray afterglow of GRB 080506.
2.2 XRT spectral analysis
![\begin{figure}
\par\includegraphics[angle=270,width=17cm,clip]{14272fg2.eps}
\vspace*{2mm}
\end{figure}](/articles/aa/full_html/2010/11/aa14272-10/img42.png)
|
Figure 2: SEDs of the NIR-X-ray regime of GRB 071112C. The 6 panels show the SED on a) T+100-T+365 s; b) T+365-T+450 s; c) T+450-T+650 s; d) T+650-T+1270 s; e) T+1270-T+1630 s; and f) T+12542-T+147425 s. The crosses show the X-ray spectra. The solid lines in the figure indicate the 90% fitting error region unabsorbed power-law model of the X-ray spectra. The open circles show observed infrared-UV SED. The doted, dashed, and dash-doted lines indicate the best-fitted power-law models of the NIR-UV SEDs calculated with the extinction model in the MW, LMC, and SMC, respectively. |
| Open with DEXTER | |
In this subsection, we report the result of our analysis on X-ray
spectra obtained with XRT, in particular, about the temporal variation
of the X-ray spectral index (
![]() ).
Based on the light curve analysis shown in the last section,
we defined 4 and 6 phases for GRB 071112C
and GRB 080506, as described in Tables 2
and 4, respectively.
The following analysis
was performed for averaged X-ray spectra of each phase.
The average spectra of each phase were fitted
with an absorbed power-law model with two absorption components.
The first component is the absorption in our galaxy.
According to Dickey & Lockman (1990), the galactic hydrogen column density
is
).
Based on the light curve analysis shown in the last section,
we defined 4 and 6 phases for GRB 071112C
and GRB 080506, as described in Tables 2
and 4, respectively.
The following analysis
was performed for averaged X-ray spectra of each phase.
The average spectra of each phase were fitted
with an absorbed power-law model with two absorption components.
The first component is the absorption in our galaxy.
According to Dickey & Lockman (1990), the galactic hydrogen column density
is
![]() and
and
![]() for the direction of GRB 071112C and GRB 080506, respectively.
We used those
for the direction of GRB 071112C and GRB 080506, respectively.
We used those
![]() to estimate
the galactic absorptions for the GRBs.
The second component is the absorption in the host galaxy.
The column density,
to estimate
the galactic absorptions for the GRBs.
The second component is the absorption in the host galaxy.
The column density,
![]() ,
was a free parameter in our
analysis.
,
was a free parameter in our
analysis.
![]() can be estimated from the absorption model,
which depends on the redshift.
The redshift correction of the observed energy band is, hence,
essential to correct the absorption.
We performed the redshift correction to the energy band
for GRB 071112C using a reported redshift of z=0.82
(Cucchiara et al. 2007; Jakobsson et al. 2007b).
About GRB 080506, the redshift correction was not performed
since the redshift is not determined.
We note that
can be estimated from the absorption model,
which depends on the redshift.
The redshift correction of the observed energy band is, hence,
essential to correct the absorption.
We performed the redshift correction to the energy band
for GRB 071112C using a reported redshift of z=0.82
(Cucchiara et al. 2007; Jakobsson et al. 2007b).
About GRB 080506, the redshift correction was not performed
since the redshift is not determined.
We note that
![]() is independent of the redshift
correction, while
is independent of the redshift
correction, while
![]() depends on it.
Using the absorbed power-law model, we confirmed that the column
density
depends on it.
Using the absorbed power-law model, we confirmed that the column
density
![]() was constant in all phases for each GRB,
while
was constant in all phases for each GRB,
while
![]() changed.
We obtained the temporal variation of
changed.
We obtained the temporal variation of
![]() in 0.3-8.0 keV band
by simultaneously fitting the spectra of all the phases by letting the
in 0.3-8.0 keV band
by simultaneously fitting the spectra of all the phases by letting the
![]() to be common among phases and
to be common among phases and
![]() to be free for each phase.
The obtained
to be free for each phase.
The obtained
![]() are summarized
in Tables 2 and 4,
where the
are summarized
in Tables 2 and 4,
where the ![]() d.o.f. of the fitting is 31/44 and 59/76
for GRB 071112C and GRB 080506, respectively.
As shown in the table, the X-ray spectra in the rising phase of the
X-ray flares became harder than those in the normal decay phases
both in GRB 071112C and GRB 080506.
The column density
d.o.f. of the fitting is 31/44 and 59/76
for GRB 071112C and GRB 080506, respectively.
As shown in the table, the X-ray spectra in the rising phase of the
X-ray flares became harder than those in the normal decay phases
both in GRB 071112C and GRB 080506.
The column density
![]() of GRB 071112C
was estimated to be
of GRB 071112C
was estimated to be
![]() .
.
2.3  -
- relation in the X-ray afterglows
In the standard external shock model, the temporal decay
index, ![]() ,
is related to the spectral slope,
,
is related to the spectral slope, ![]() (e.g. Zhang et al. 2006a).
For example,
(e.g. Zhang et al. 2006a).
For example, ![]() and
and ![]() in the X-ray regime have a relation of
in the X-ray regime have a relation of
![]() in the case that the X-ray
band is between the synchrotron cooling frequency
in the case that the X-ray
band is between the synchrotron cooling frequency
![]() and the typical frequency
and the typical frequency
![]() under a homogeneous circum-burst medium.
The
under a homogeneous circum-burst medium.
The ![]() and
and ![]() during the normal decay phase
of GRB 071112C satisfies this relation.
The electron energy distribution index, p, was estimated to be
p = 2.7, inferred from
during the normal decay phase
of GRB 071112C satisfies this relation.
The electron energy distribution index, p, was estimated to be
p = 2.7, inferred from
![]() and/or
and/or
![]() (Sari et al. 1998; Meszaros & Rees 1997).
This is similar to a typical p in previously observed afterglows
(Liang et al. 2007).
On the other hand, the
(Sari et al. 1998; Meszaros & Rees 1997).
This is similar to a typical p in previously observed afterglows
(Liang et al. 2007).
On the other hand, the
![]() and
and
![]() in
GRB 080506
do not follow the
in
GRB 080506
do not follow the ![]() -
-![]() relation.
relation.
2.4 Spectral energy distribution of GRB 071112C
Figure 2 shows NIR-X-ray SEDs of GRB 071112C. The figure contains SEDs at 6 epochs, that is; (a) the rising phase of the optical afterglow ( T+100-T+365 s); (b) the normal decay phase ( T+ 36-T+450 s); (c) the rising phase of the X-ray flare ( T+450-T+650 s); (d) the decay phase of the X-ray flare ( T+650-T+1270 s); (e) the normal decay phase ( T+1270-T+1630 s); and (f) the post-break phase ( T+12 542-T+147 425 s). The crosses show the X-ray spectrum. The solid lines indicate the 90% confidence region of unabsorbed power-law model of the X-ray spectra. The open circles show the observed NIR-UV fluxes. In all phases except for the rising phase of X-ray flare, the NIR-UV fluxes are much lower than those expected from the extrapolated power-law components of the X-ray spectra. Thus, the NIR-UV fluxes are definitely reduced by the interstellar extinction.
![\begin{figure}
\par\includegraphics[angle=270,width=17cm,clip]{14272fg3.eps}
\end{figure}](/articles/aa/full_html/2010/11/aa14272-10/img53.png)
|
Figure 3: SEDs of the NIR-X-ray regime of GRB 080506. These epochs correspond to the phases defined in Table 4, that is, a) Prompt Emission on T+145-T+200 s; b) Steep Decay on T+200-T+350 s; c) Flare Rise on T+350-T+474 s; d) Flare Peak on T+474-T+503 s; e) Flare Decay on T+503-T+672 s; and f) Normal Decay on T+10 900-T+70 300 s. The solid lines show 90% fitting error region of X-ray spectra that corrected for interstellar extinction. No redshift correction was performed to the energy band. |
| Open with DEXTER | |
We estimated the extinction in the V-band, AV, from ![]() obtained from the X-ray spectral analysis.
The ratio,
obtained from the X-ray spectral analysis.
The ratio,
![]() ,
has been reported in our and nearby
galaxies, that is,
,
has been reported in our and nearby
galaxies, that is,
![]() for Milky Way (MW),
for Milky Way (MW),
![]() for the Large Magellanic Cloud (LMC),
and
for the Large Magellanic Cloud (LMC),
and
![]() for the Small Magellanic Cloud (SMC)
(Weingartner & Draine 2000; Pei 1992).
Using those 3 models,
we corrected the extinction in the V-band.
The conversion from AV to
for the Small Magellanic Cloud (SMC)
(Weingartner & Draine 2000; Pei 1992).
Using those 3 models,
we corrected the extinction in the V-band.
The conversion from AV to
![]() of
the other bands was performed based on Cardelli et al. (1989).
In Fig. 2,
the dotted, dashed, and dash-dotted lines indicate the
best-fitted power-law models for the corrected NIR-UV SEDs with the
MW, LMC, and SMC models, respectively.
In the case that the NIR-UV extinction was corrected
with the LMC or SMC model,
the X-ray flux has an excess over the SED extrapolated
from the NIR-UV regime
in panel (a) of Fig. 2.
Such an X-ray excess is inconsistent with the standard external
shock model.
In the case that the extinction model is the MW model,
the SED should have a break between the optical and UV band
in panel (f),
while such a break is not clearly seen in the observed
NIR-UV SED.
However, the break could be in UV-X-ray SED,
when considering the error of X-ray spectral index.
of
the other bands was performed based on Cardelli et al. (1989).
In Fig. 2,
the dotted, dashed, and dash-dotted lines indicate the
best-fitted power-law models for the corrected NIR-UV SEDs with the
MW, LMC, and SMC models, respectively.
In the case that the NIR-UV extinction was corrected
with the LMC or SMC model,
the X-ray flux has an excess over the SED extrapolated
from the NIR-UV regime
in panel (a) of Fig. 2.
Such an X-ray excess is inconsistent with the standard external
shock model.
In the case that the extinction model is the MW model,
the SED should have a break between the optical and UV band
in panel (f),
while such a break is not clearly seen in the observed
NIR-UV SED.
However, the break could be in UV-X-ray SED,
when considering the error of X-ray spectral index.
In the framework of the GRB external shock model,
NIR-X-ray SEDs can be described with a single power-law model
if the cooling frequency,
![]() ,
is below the NIR band.
Alternatively, SEDs have a break in the case that
,
is below the NIR band.
Alternatively, SEDs have a break in the case that
![]() lies
between the NIR-X-ray bands.
As mentioned above and shown in Fig. 2,
a single power-law model cannot reproduce the observed SED of
the NIR-X-ray bands regardless of the ambiguity of the
extinction. Therefore, the standard external shock model can
explain the observed SED only when
lies
between the NIR-X-ray bands.
As mentioned above and shown in Fig. 2,
a single power-law model cannot reproduce the observed SED of
the NIR-X-ray bands regardless of the ambiguity of the
extinction. Therefore, the standard external shock model can
explain the observed SED only when
![]() lies between the
NIR-X-ray bands. Then, the SED should have a break between the
NIR-X-ray bands. This break actually appears in the case that
lies between the
NIR-X-ray bands. Then, the SED should have a break between the
NIR-X-ray bands. This break actually appears in the case that
![]() in the host galaxy of GRB 071112C is
between the values of the MW and LMC models.
in the host galaxy of GRB 071112C is
between the values of the MW and LMC models.
2.5 Spectral energy distribution of GRB 080506
These epochs correspond to the phases defined in Table 4, that is, (a) the prompt emission phase ( T+145-T+200 s), (b) the steep decay phase ( T+200-T+350 s), (c) the flare rise phase ( T+350-T+474 s), (d) the flare peak phase ( T+474-T+503 s), (e) the flare decay phase ( T+503-T+672 s), and (f) the normal decay phase ( T+10 900-T+70 300 s). As can be seen in the figure, the spectral slope of X-rays clearly changed, while no significant change was detected in the optical-NIR range during the X-ray flare phase from panel (c) to (e).
As well as the case of GRB 071112C, the NIR-UV fluxes are much
lower than those expected from the X-ray spectra indicated by
the solid line in the figure. Thus, the observed NIR-UV fluxes
were definitely reduced by the interstellar extinction in
the host galaxy also in the case of GRB 080506.
Since the lack of a measured redshift prevents us from determining
![]() based on the X-ray spectrum,
we cannot apply the same approach for the absorption correction
to GRB 080506, as in GRB 071112C.
based on the X-ray spectrum,
we cannot apply the same approach for the absorption correction
to GRB 080506, as in GRB 071112C.
In the framework of the external shock model,
the condition of
![]() means
that
means
that
![]() is below the optical frequency, and hence,
an optical-X-ray SED should be described with a single power-law, namely
is below the optical frequency, and hence,
an optical-X-ray SED should be described with a single power-law, namely
![]() .
In the case of GRB 080506, the observed
.
In the case of GRB 080506, the observed
![]() was in
agreement with
was in
agreement with
![]() within errors after T+1.5 ks.
Hence, the standard external shock model predicts
within errors after T+1.5 ks.
Hence, the standard external shock model predicts
![]() in GRB 080506 after T+1.5 ks.
We calculated
in GRB 080506 after T+1.5 ks.
We calculated
![]() shown by dotted line in panel (f) of
Fig. 3,
using the NIR-UV data after T+1.5 ks in which
the galactic extinction was corrected (Schlegel et al. 1998).
This is, however, significantly different from
shown by dotted line in panel (f) of
Fig. 3,
using the NIR-UV data after T+1.5 ks in which
the galactic extinction was corrected (Schlegel et al. 1998).
This is, however, significantly different from
![]() in the normal decay phase, as shown in Table 4.
This is possibly due to a significant reddening
of the optical afterglow
in the host galaxy of the GRB.
in the normal decay phase, as shown in Table 4.
This is possibly due to a significant reddening
of the optical afterglow
in the host galaxy of the GRB.
Then, we can estimate the extinction in the host galaxy in the
NIR-UV range,
assuming a single power-law SED between the NIR-X-ray range.
We defined the extinction, ![]() ,
as
,
as
![]() ,
where
,
where
![]() is the flux extrapolated from the X-ray power-law
spectrum,
is the flux extrapolated from the X-ray power-law
spectrum,
![]() where
where ![]() the observed X-ray band(
the observed X-ray band(
![]() )
flux.
)
flux.
![]() is the observed NIR-UV fluxes.
Figure 4 shows the
obtained extinction curve. The extinction
is the observed NIR-UV fluxes.
Figure 4 shows the
obtained extinction curve. The extinction ![]() was normalized
at AV.
The extinction curves in the MW is also
shown for comparison in
Figs. 4 (Cardelli et al. 1989).
In general, the extinction is larger
in the UV region rather than the NIR one.
In the case of GRB 080506, however, the extinction
is larger in the NIR than in the UV region.
This result is problematic for the standard extinction model with
dusts (Cardelli et al. 1989). Thus, the extraordinary extinction
curve in Fig. 4 indicates
was normalized
at AV.
The extinction curves in the MW is also
shown for comparison in
Figs. 4 (Cardelli et al. 1989).
In general, the extinction is larger
in the UV region rather than the NIR one.
In the case of GRB 080506, however, the extinction
is larger in the NIR than in the UV region.
This result is problematic for the standard extinction model with
dusts (Cardelli et al. 1989). Thus, the extraordinary extinction
curve in Fig. 4 indicates
![]() in the normal decay phase
of GRB 080506, while
in the normal decay phase
of GRB 080506, while
![]() .
In the case that we correct the flux with a general extinction
law, the SED definitely
has a break between the NIR and X-ray bands since the observed
.
In the case that we correct the flux with a general extinction
law, the SED definitely
has a break between the NIR and X-ray bands since the observed
![]() is smaller than
is smaller than
![]() .
As well as the
.
As well as the
![]() relation reported in Sect. 3.3, the
condition in GRB 080506 is inconsistent with the standard external
shock model.
relation reported in Sect. 3.3, the
condition in GRB 080506 is inconsistent with the standard external
shock model.
![\begin{figure}
\par\includegraphics[angle=270,width=8.8cm,clip]{14272fg4.eps}
\end{figure}](/articles/aa/full_html/2010/11/aa14272-10/img74.png)
|
Figure 4: Extinction curves (normalized at the V band) for the host galaxy of GRB 080506 estimated with a simple power-law SED extrapolated from the X-ray region. The bar and filled circles show the curves for GRB 080506 and MW. |
| Open with DEXTER | |
3 Discussion
In this section, we discuss whether the X-ray flare originates in the external or internal shocks.
If they arise from external shocks, optical and NIR flares should be contemporaneously detected during the X-ray flares (Fan et al. 2005). In addition, the spectral index in the optical band should also change (e.g. Zhang et al. 2006a). Our observations unambiguously show no optical variation associated with the X-ray flares. The lack of optical variations is consistent with previously reported observations (e.g. Butler & Kocevski 2007; Krimm et al. 2007; Burrows et al. 2005). The optical spectral index also unchanged during the X-ray flares in both GRB 071112C and 080506. Therefore, the optical behavior during these X-ray flares is inconsistent with the prediction from the standard external shock model. On the other hand, the late internal shock model can explain the X-ray flare even if no contemporaneous flares are observed in the optical and NIR bands (Burrows et al. 2005). In fact, the lack of the NIR-optical variations in both GRB 071112C and GRB 080506 is consistent with this model.
In the following, we propose an alternative model for the X-ray flare. We consider two components of the external shocks; one originates in the main shell which produces the normal afterglow, and the other originates in a delayed shell which is responsible for the X-ray flare. The observed sharp decay of the X-ray flare can be explained by this scenario because the decay slope of the emission from the delayed shell can be apparently steep in the time frame of the normal afterglow (Yamazaki et al. 2006; Zhang et al. 2006b). The delayed shell could generate a prominent X-ray emission under the condition that it passes a region containing enough interstellar medium. Such a condition is probably achieved, for example, if the opening angle of the delayed jet is larger than that of the main jet, or if the axis of the delayed jet is off to that of the main jet. These conditions were originally proposed to explain ``X-ray flashes'', which are analogous to GRBs except for their softer emission and less energetics (Yamazaki et al. 2004; Lamb et al. 2005; Yamazaki et al. 2002; Li 2006; Yamazaki et al. 2003). Piro et al. (2005) and Galli & Piro (2006) have proposed models for the X-ray flare, in which the delayed shell interacts with the reverse shock region of the preceding jet.
In our model, we assume that the temporal evolution of the emission
from the delayed shell is the same as that of the main shell,
following the standard external shock model (Sari et al. 1998).
For the decay phase of the X-ray flare,
we assumed that the spectrum of delayed shell overlaps that of the main
shell.
We denote the maximum and cooling frequencies of the synchrotron emission
as
![]() and
and
![]() for the main shell, and
for the main shell, and
![]() and
and
![]() for the delayed shell.
Then, we investigated several conditions of
for the delayed shell.
Then, we investigated several conditions of
![]() and
and
![]() ,
which satisfy the observed amplitudes of variations and
electron energy distribution index.
,
which satisfy the observed amplitudes of variations and
electron energy distribution index.
Table 5:
![]() estimated for possible cases on
estimated for possible cases on
![]() and
and
![]() in the two-component external shock model.
in the two-component external shock model.
![\begin{figure}
\par\includegraphics[width=14cm,clip]{14272fg5.eps}
\vspace*{1.5mm}
\end{figure}](/articles/aa/full_html/2010/11/aa14272-10/img112.png)
|
Figure 5:
Allowed region of
|
| Open with DEXTER | |
We have mentioned in Sects. 2.4 and 2.5
that for both events we analyzed,
the SEDs of the normal afterglow component are
expected to have a break between the NIR and X-ray bands.
This break means that
![]() lies in this bands.
There is no spectral break
in the observed NIR-optical SEDs and X-ray spectra.
Therefore,
lies in this bands.
There is no spectral break
in the observed NIR-optical SEDs and X-ray spectra.
Therefore,
![]() are constrained as
are constrained as
![]() Hz
and
Hz
and
![]() Hz
for GRB 071112C and GRB 080506, respectively.
The above frequencies are those in the observer's frame.
Because we focus on the ratio of the frequency in the
following discussion, the redshift correction to the
energy band is not important.
Hz
for GRB 071112C and GRB 080506, respectively.
The above frequencies are those in the observer's frame.
Because we focus on the ratio of the frequency in the
following discussion, the redshift correction to the
energy band is not important.
The cooling frequency of the normal afterglow
![]() ,
is also constrained using the observed amplitudes
of the X-ray flares.
In this procedure, we consider ten cases depending
on the relationship among
,
is also constrained using the observed amplitudes
of the X-ray flares.
In this procedure, we consider ten cases depending
on the relationship among
![]() ,
,
![]() ,
and the observation frequencies of
,
and the observation frequencies of
![]() and
and
![]() .
As listed in Table 5,
possible conditions are divided
into five cases in the slow cooling regime (
.
As listed in Table 5,
possible conditions are divided
into five cases in the slow cooling regime (
![]() )
and five cases in the fast cooling regime (
)
and five cases in the fast cooling regime (
![]() ).
Since we discuss the SED of the decay phase of the X-ray flare,
the conditions are limited to those ten cases;
the conditions of
).
Since we discuss the SED of the decay phase of the X-ray flare,
the conditions are limited to those ten cases;
the conditions of
![]() and
and
![]() are required for the decay phase in
the slow and fast cooling regime, respectively.
The cases for the slow and fast cooling regimes are indicated
by the characters ``S'' and ``F'', respectively.
are required for the decay phase in
the slow and fast cooling regime, respectively.
The cases for the slow and fast cooling regimes are indicated
by the characters ``S'' and ``F'', respectively.
For example, in case S1 in Table 5,
the X-ray and optical flux densities of the normal decay component,
![]() and
and
![]() are related as;
are related as;
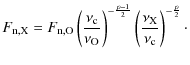
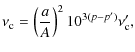
Here we assumed an SED predicted by the standard external shock model (Sari et al. 1998). Similarly, the optical and X-ray flux densities of the X-ray flare component,
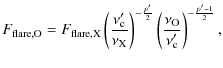
where
Using Eqs. (1)-(4), we obtain
where we take
Similar to case S1,
![]() in the other nine cases are also evaluated.
Table 5 shows the results.
Upper limits of
in the other nine cases are also evaluated.
Table 5 shows the results.
Upper limits of
![]() are given in the table
if it is independent of
are given in the table
if it is independent of
![]() and
and
![]() or if it is a function of either of them
(cases S1, S2, S4, F1, F2, and F4).
If
or if it is a function of either of them
(cases S1, S2, S4, F1, F2, and F4).
If
![]() depends
on both
depends
on both
![]() and
and
![]() (cases S3 and F3),
then in the
(cases S3 and F3),
then in the
![]() plane
we search for allowed regions to satisfy the conditions of
plane
we search for allowed regions to satisfy the conditions of
![]() Hz
and
Hz
and
![]() Hz
for GRB 071112C and GRB 080506, respectively.
Figure 5 shows the results.
The left and right panels of Fig. 5 are
for GRB 071112C and GRB 080506, respectively.
The blue solid and dotted lines indicate the assumed conditions
for
Hz
for GRB 071112C and GRB 080506, respectively.
Figure 5 shows the results.
The left and right panels of Fig. 5 are
for GRB 071112C and GRB 080506, respectively.
The blue solid and dotted lines indicate the assumed conditions
for
![]() and
and
![]() .
The red and gray shaded regions indicate the allowed region
for
.
The red and gray shaded regions indicate the allowed region
for
![]() in cases F3 and S3, respectively.
Thus, both cases F3 and S3 can explain the observation with
the two-component external shock model for only GRB 071112C.
On the other hand, there is no allowed region in the
case of GRB 080506, as can be seen in the right panel
of Fig. 5.
The ``check'' symbols are given in Table 5
in the case that there are allowed values of parameters
that can reproduce the observed SED variations.
For both GRBs, there are several cases in which the observations
can be explained by our model.
in cases F3 and S3, respectively.
Thus, both cases F3 and S3 can explain the observation with
the two-component external shock model for only GRB 071112C.
On the other hand, there is no allowed region in the
case of GRB 080506, as can be seen in the right panel
of Fig. 5.
The ``check'' symbols are given in Table 5
in the case that there are allowed values of parameters
that can reproduce the observed SED variations.
For both GRBs, there are several cases in which the observations
can be explained by our model.
Table 6: Observational parameters used in the two-component external shock model.
Note that all parameters needed for the above discussion are
the variation amplitudes during the X-ray flares in the optical and
X-ray ranges, a and A,
and electron energy distribution index, p and ![]() .
Thus, the discussion was independent of the uncertainty in
the correction of the dust extinction in the GRB host galaxies.
.
Thus, the discussion was independent of the uncertainty in
the correction of the dust extinction in the GRB host galaxies.
4 Conclusion
We have observed GRB 071112C and GRB 080506 before the start of X-ray flares. In conjunction with published X-ray and optical data, we analyzed densely sampled light curves of the early afterglows and SEDs of the NIR-X-ray range. We found that the SEDs in the normal decay phase had a break between the UV and soft X-ray regions. No significant variation in the optical-NIR range was detected contemporaneous to the X-ray flares. The lack of the optical-NIR variation suggests that the late internal shock is a reasonable origin for the X-ray flare. In addition, we found that two-component external shock model can also explain the observed variations of SEDs during the X-ray flares. AcknowledgementsThe authors thank the referee for careful reading and many useful comments. The authors also thank the Swift team for development of hardware/software and operation. SN is supported by Research Fellowships of the Japan Society for the Promotion of Science for Young Scientists.
References
- Baumgartner, W. H., Burrows, D. N., Chester, M. M., et al. 2008, GRB Coordinates Network, 7685, 1 [NASA ADS] [Google Scholar]
- Burenin, R., Khamitov, I., Pavlinsky, M., et al. 2007, GRB Coordinates Network, 7066, 1 [Google Scholar]
- Burrows, D. N., Romano, P., Falcone, A., et al. 2005, Science, 309, 1833 [NASA ADS] [CrossRef] [PubMed] [Google Scholar]
- Butler, N. R., & Kocevski, D. 2007, ApJ, 663, 407 [NASA ADS] [CrossRef] [Google Scholar]
- Cardelli, J. A., Clayton, G. C., & Mathis, J. S. 1989, ApJ, 345, 245 [NASA ADS] [CrossRef] [Google Scholar]
- Chandra, P., & Frail, D. A. 2007, GRB Coordinates Network, 7096, 1 [NASA ADS] [Google Scholar]
- Chandra, P., & Frail, D. A. 2008, GRB Coordinates Network, 7698, 1 [NASA ADS] [Google Scholar]
- Chen, S. L., Li, A., & Wei, D. M. 2006, ApJ, 647, L13 [NASA ADS] [CrossRef] [Google Scholar]
- Chen, I. C., Huang, K. Y., & Urata, Y. 2007a, GRB Coordinates Network, 7067, 1 [NASA ADS] [Google Scholar]
- Chen, I. C., Huang, K. Y., & Urata, Y. 2007b, GRB Coordinates Network, 7083, 1 [NASA ADS] [Google Scholar]
- Chincarini, G., Moretti, A., Romano, P., et al. 2007, ApJ, 671, 1903 [NASA ADS] [CrossRef] [Google Scholar]
- Chincarini, G., Mao, J., Margutti, R., et al. 2010, MNRAS, submitted[arXiv:1004.0901] [Google Scholar]
- Costa, E., Frontera, F., Heise, J., et al. 1997, Nature, 387, 783 [Google Scholar]
- Cucchiara, A., Fox, D. B., Berger, E., & Perri, M. 2007, GRB Coordinates Network, 7086, 1 [NASA ADS] [Google Scholar]
- de Postigo Ugarte, A., Thoene, C. C., Fynbo, J. P. U., Leitet, E., & Trinchant, L. M. 2008, GRB Coordinates Network, 7690, 1 [NASA ADS] [Google Scholar]
- Della Valle, M., Malesani, D., Benetti, S., et al. 2003, A&A, 406, L33 [NASA ADS] [CrossRef] [EDP Sciences] [Google Scholar]
- Dickey, J. M., & Lockman, F. J. 1990, ARA&A, 28, 215 [NASA ADS] [CrossRef] [MathSciNet] [Google Scholar]
- Dintinjana, B., Maticic, S., Mikuz, H., & Skvarc, J. 2007, GRB Coordinates Network, 7078, 1 [Google Scholar]
- Falcone, A. D., Morris, D., Racusin, J., et al. 2007, ApJ, 671, 1921 [NASA ADS] [CrossRef] [Google Scholar]
- Fan, Y. Z., Zhang, B., & Wei, D. M. 2005, ApJ, 628, L25 [NASA ADS] [CrossRef] [Google Scholar]
- Frail, D. A., Kulkarni, S. R., Nicastro, L., Feroci, M., & Taylor, G. B. 1997, Nature, 389, 261 [NASA ADS] [CrossRef] [Google Scholar]
- Galli, A., & Piro, L. 2006, A&A, 455, 413 [NASA ADS] [CrossRef] [EDP Sciences] [Google Scholar]
- Greco, G., Terra, F., Bartolini, C., et al. 2007, GRB Coordinates Network, 7089, 1 [Google Scholar]
- Hjorth, J., Sollerman, J., Møller, P., et al. 2003, Nature, 423, 847 [NASA ADS] [CrossRef] [PubMed] [Google Scholar]
- Huang, K. Y., Schwamb, M. E., Wang, J. H., Wen, C. Y., & Survey, T. A. O. 2008, GRB Coordinates Network, 7334, 1 [NASA ADS] [Google Scholar]
- Ioka, K., Kobayashi, S., & Zhang, B. 2005, ApJ, 631, 429 [NASA ADS] [CrossRef] [Google Scholar]
- Ishimura, T., Shimokawabe, T., Mori, Y., et al. 2007, GRB Coordinates Network, 7087, 1 [Google Scholar]
- Jakobsson, P., Fynbo, J. P. U., Malesani, D., et al. 2007a, GRB Coordinates Network, 7088, 1 [Google Scholar]
- Jakobsson, P., Fynbo, J. P. U., Vreeswijk, P. M., Malesani, D., & Sollerman, J. 2007b, GRB Coordinates Network, 7076, 1 [Google Scholar]
- Kann, D. A., Klose, S., & Zeh, A. 2006, ApJ, 641, 993 [NASA ADS] [CrossRef] [Google Scholar]
- Kann, D. A., Hoegner, C., & Ertel, S. 2008a, GRB Coordinates Network, 7696, 1 [NASA ADS] [Google Scholar]
- Kann, D. A., Hoegner, C., & Ertel, S. 2008b, GRB Coordinates Network, 7688, 1 [NASA ADS] [Google Scholar]
- Kawabata, K. S., Sasada, M., Uemura, M., et al. 2008, GRB Coordinates Network, 7686, 1 [NASA ADS] [Google Scholar]
- Klotz, A., Boer, M., & Atteia, J. L. 2007, GRB Coordinates Network, 7065, 1 [Google Scholar]
- Kocka, M., Nekola, M., Strobl, J., et al. 2008, GRB Coordinates Network, 7689, 1 [NASA ADS] [Google Scholar]
- Krimm, H. A., Granot, J., Marshall, F. E., et al. 2007, ApJ, 665, 554 [NASA ADS] [CrossRef] [Google Scholar]
- Lamb, D. Q., Donaghy, T. Q., & Graziani, C. 2005, ApJ, 620, 355 [NASA ADS] [CrossRef] [Google Scholar]
- Li, L.-X. 2006, MNRAS, 372, 1357 [NASA ADS] [CrossRef] [Google Scholar]
- Liang, E.-W., Zhang, B.-B., & Zhang, B. 2007, ApJ, 670, 565 [NASA ADS] [CrossRef] [Google Scholar]
- Maeno, S., Naito, H., Narusawa, S., & Iizuka, R. 2008, GRB Coordinates Network, 7709, 1 [NASA ADS] [Google Scholar]
- Malesani, D., Tagliaferri, G., Chincarini, G., et al. 2004, ApJ, 609, L5 [NASA ADS] [CrossRef] [Google Scholar]
- McLean, K., Barthelmy, S. D., Baumgartner, W., et al. 2008, GRB Coordinates Network, 7692, 1 [NASA ADS] [Google Scholar]
- Meszaros, P., & Rees, M. J. 1997, ApJ, 482, L29 [Google Scholar]
- Minezaki, T., Price, P. A., Yoshii, Y., & Cowie, L. L. 2007, GRB Coordinates Network, 7135, 1 [Google Scholar]
- Nugent, P., & Bloom, J. S. 2007, GRB Coordinates Network, 7069, 1 [NASA ADS] [Google Scholar]
- Oates, S. R., & Baumgartner, W. 2008, GRB Coordinates Network, 7693, 1 [NASA ADS] [Google Scholar]
- Oates, S. R., & Stratta, G. 2007, GRB Coordinates Network, 7080, 1 [Google Scholar]
- Osborne, J. P., Beardmore, A. P., Evans, P. A., & Goad, M. R. 2008, GRB Coordinates Network, 7687, 1 [NASA ADS] [Google Scholar]
- Paciesas, W. S., Meegan, C. A., Pendleton, G. N., et al. 1999, ApJS, 122, 465 [NASA ADS] [CrossRef] [Google Scholar]
- Pei, Y. C. 1992, ApJ, 395, 130 [NASA ADS] [CrossRef] [Google Scholar]
- Perri, M., Stratta, G., Barthelmy, S. D., et al. 2007, GRB Coordinates Network, 7059, 1 [Google Scholar]
- Piran, T. 1999, Phys. Rep., 314, 575 [Google Scholar]
- Piro, L., De Pasquale, M., Soffitta, P., et al. 2005, ApJ, 623, 314 [NASA ADS] [CrossRef] [Google Scholar]
- Rees, M. J., & Meszaros, P. 1998, ApJ, 496, L1 [NASA ADS] [CrossRef] [Google Scholar]
- Romano, P., Campana, S., Chincarini, G., et al. 2006, A&A, 456, 917 [NASA ADS] [CrossRef] [EDP Sciences] [Google Scholar]
- Sahu, D. K., Anupama, G. C., & Misra, K. 2008, GRB Coordinates Network, 7700, 1 [NASA ADS] [Google Scholar]
- Sari, R., Piran, T., & Narayan, R. 1998, ApJ, 497, L17 [NASA ADS] [CrossRef] [Google Scholar]
- Sbarufatti, B., Mangano, V., La Parola, V., & Baumgartner, W. H. 2008, GRB Coordinates Network, 7694, 1 [NASA ADS] [Google Scholar]
- Schady, P., Mason, K. O., Page, M. J., et al. 2007, MNRAS, 377, 273 [NASA ADS] [CrossRef] [Google Scholar]
- Schlegel, D. J., Finkbeiner, D. P., & Davis, M. 1998, ApJ, 500, 525 [NASA ADS] [CrossRef] [Google Scholar]
- Soderberg, A. M., Kulkarni, S. R., Fox, D. B., et al. 2005, ApJ, 627, 877 [NASA ADS] [CrossRef] [Google Scholar]
- Sposetti, S. 2007, GRB Coordinates Network, 7090, 1 [Google Scholar]
- Stanek, K. Z., Matheson, T., Garnavich, P. M., et al. 2003, ApJ, 591, L17 [NASA ADS] [CrossRef] [Google Scholar]
- Stanek, K. Z., Dai, X., Prieto, J. L., et al. 2007, ApJ, 654, L21 [NASA ADS] [CrossRef] [Google Scholar]
- Starling, R. L. C., Wijers, R. A. M. J., Wiersema, K., et al. 2007, ApJ, 661, 787 [NASA ADS] [CrossRef] [Google Scholar]
- Stratta, G., Fiore, F., Antonelli, L. A., Piro, L., & De Pasquale, M. 2004, ApJ, 608, 846 [NASA ADS] [CrossRef] [Google Scholar]
- Stratta, G., Perri, M., & Burrows, D. N. 2007, GRB Coordinates Network, 7079, 1 [NASA ADS] [Google Scholar]
- Uemura, M., Sasada, M., Arai, A., & Uehara, T. 2007a, GRB Coordinates Network, 7062, 1 [NASA ADS] [Google Scholar]
- Uemura, M., Sasada, M., Arai, A., & Uehara, T. 2007b, GRB Coordinates Network, 7094, 1 [Google Scholar]
- Updike, A. C., Hartmann, D. H., & Rumstay, K. S. 2007, GRB Coordinates Network, 7084, 1 [NASA ADS] [Google Scholar]
- van der Horst, A. J., & Wijers, R. A. M. J. 2007, GRB Coordinates Network, 7092, 1 [NASA ADS] [Google Scholar]
- van Paradijs, J., Groot, P. J., Galama, T., et al. 1997, Nature, 386, 686 [NASA ADS] [CrossRef] [Google Scholar]
- Vaughan, S., Goad, M. R., Beardmore, A. P., et al. 2006, ApJ, 638, 920 [NASA ADS] [CrossRef] [Google Scholar]
- Wang, X., & Loeb, A. 2000, ApJ, 535, 788 [NASA ADS] [CrossRef] [Google Scholar]
- Watanabe, M., Nakaya, H., Yamamuro, Y., et al. 2005, PASP, 117, 870 [NASA ADS] [CrossRef] [Google Scholar]
- Watson, D., Hjorth, J., Fynbo, J. P. U., et al. 2007, ApJ, 660, L101 [NASA ADS] [CrossRef] [Google Scholar]
- Weingartner, J. C., & Draine, B. T. 2000, in BAAS, 32, 1466 [Google Scholar]
- Yamazaki, R., Ioka, K., & Nakamura, T. 2002, ApJ, 571, L31 [NASA ADS] [CrossRef] [Google Scholar]
- Yamazaki, R., Ioka, K., & Nakamura, T. 2003, ApJ, 593, 941 [NASA ADS] [CrossRef] [Google Scholar]
- Yamazaki, R., Ioka, K., & Nakamura, T. 2004, ApJ, 606, L33 [NASA ADS] [CrossRef] [Google Scholar]
- Yamazaki, R., Toma, K., Ioka, K., & Nakamura, T. 2006, MNRAS, 369, 311 [NASA ADS] [CrossRef] [Google Scholar]
- Yoshida, M., Yanagisawa, K., Shimizu, Y., Toda, H., & Kawai, N. 2007, GRB Coordinates Network, 7091, 1 [Google Scholar]
- Yuan, F., Rykoff, E. S., Rujopakarn, W., & Swan, H. 2007, GRB Coordinates Network, 7061, 1 [Google Scholar]
- Zhang, B., & Mészáros, P. 2004, Int. J. Mod. Phys. A, 19, 2385 [NASA ADS] [CrossRef] [Google Scholar]
- Zhang, B., Fan, Y. Z., Dyks, J., et al. 2006a, ApJ, 642, 354 [NASA ADS] [CrossRef] [Google Scholar]
- Zhang, B., Fan, Y. Z., Dyks, J., et al. 2006b, ApJ, 642, 354 [NASA ADS] [CrossRef] [Google Scholar]
All Tables
Table 1: Kanata optical photometry of GRB 080506.
Table 2: Decay and spectral index of the X-ray afterglow of GRB 071112C.
Table 3: Decay indexes of the optical light curves.
Table 4: Decay and spectral index of the X-ray afterglow of GRB 080506.
Table 5:
![]() estimated for possible cases on
estimated for possible cases on
![]() and
and
![]() in the two-component external shock model.
in the two-component external shock model.
Table 6: Observational parameters used in the two-component external shock model.
All Figures
|
|
Figure 1:
X-ray and NIR-UV light curves of
afterglows of GRB 071112C ( left) and GRB 080506 ( right).
The flux density of the NIR-UV
afterglows are shifted by 2 in XRT;
100.5 in uvw1- (Oates & Stratta 2007);
100.0 in U- (Oates & Stratta 2007);
10-0.5 in B- (Oates & Stratta 2007);
10-1.0 in |
| Open with DEXTER | |
| In the text | |
|
|
Figure 2: SEDs of the NIR-X-ray regime of GRB 071112C. The 6 panels show the SED on a) T+100-T+365 s; b) T+365-T+450 s; c) T+450-T+650 s; d) T+650-T+1270 s; e) T+1270-T+1630 s; and f) T+12542-T+147425 s. The crosses show the X-ray spectra. The solid lines in the figure indicate the 90% fitting error region unabsorbed power-law model of the X-ray spectra. The open circles show observed infrared-UV SED. The doted, dashed, and dash-doted lines indicate the best-fitted power-law models of the NIR-UV SEDs calculated with the extinction model in the MW, LMC, and SMC, respectively. |
| Open with DEXTER | |
| In the text | |
|
|
Figure 3: SEDs of the NIR-X-ray regime of GRB 080506. These epochs correspond to the phases defined in Table 4, that is, a) Prompt Emission on T+145-T+200 s; b) Steep Decay on T+200-T+350 s; c) Flare Rise on T+350-T+474 s; d) Flare Peak on T+474-T+503 s; e) Flare Decay on T+503-T+672 s; and f) Normal Decay on T+10 900-T+70 300 s. The solid lines show 90% fitting error region of X-ray spectra that corrected for interstellar extinction. No redshift correction was performed to the energy band. |
| Open with DEXTER | |
| In the text | |
|
|
Figure 4: Extinction curves (normalized at the V band) for the host galaxy of GRB 080506 estimated with a simple power-law SED extrapolated from the X-ray region. The bar and filled circles show the curves for GRB 080506 and MW. |
| Open with DEXTER | |
| In the text | |
|
|
Figure 5:
Allowed region of
|
| Open with DEXTER | |
| In the text | |
Copyright ESO 2010
Current usage metrics show cumulative count of Article Views (full-text article views including HTML views, PDF and ePub downloads, according to the available data) and Abstracts Views on Vision4Press platform.
Data correspond to usage on the plateform after 2015. The current usage metrics is available 48-96 hours after online publication and is updated daily on week days.
Initial download of the metrics may take a while.