| Issue |
A&A
Volume 515, June 2010
|
|
|---|---|---|
| Article Number | A47 | |
| Number of page(s) | 9 | |
| Section | Extragalactic astronomy | |
| DOI | https://doi.org/10.1051/0004-6361/200913673 | |
| Published online | 08 June 2010 | |
A characterization of the NGC 4051 soft X-ray spectrum as observed by XMM-Newton
A. A. Nucita1 - M. Guainazzi1 - A. L. Longinotti2 - M. Santos-Lleo1 - Y. Maruccia3 - S. Bianchi4
1 - XMM-Newton Science Operations Centre, ESAC, ESA, PO Box 78, 28691 Villanueva de la
![]() ,
Madrid, Spain
,
Madrid, Spain
2 -
MIT Kavli Institute for Astrophysics and Space Research 77 Massachusetts Avenue, NE80-6011 Cambridge, MA 02139, USA
3 -
Dipartimento di Fisica, Università del Salento, and INFN, Sezione di Lecce, CP 193, 73100 Lecce, Italy
4 -
Dipartimento di Fisica, Università degli Studi Roma Tre, via della Vasca Navale 84, 00146 Roma, Italy
Received 16 November 2009 / Accepted 2 March 2010
Abstract
Context. Soft X-ray high resolution spectroscopy of obscured
AGNs shows a complex soft X-ray spectrum dominated by emission lines of
He and H-like transitions of elements from carbon to neon, as well as
L-shell transitions due to iron ions.
Aims. In this paper we characterize the XMM-Newton RGS
spectrum of the Seyfert 1 galaxy NGC 4051 observed during a low flux
state and infer the physical properties of the emitting and absorbing
gas in the soft X-ray regime.
Methods. X-ray high-resolution spectroscopy offers a powerful
diagnostic tool because the observed spectral features strongly depend
on the physical properties of matter (ionization parameter U, electron density ![]() ,
hydrogen column density
,
hydrogen column density ![]() ),
which in turn are tightly related to the location and size of the X-ray
emitting clouds. We carried out a phenomenological study to identify
the atomic transitions detected in the spectra. This study suggests
that the spectrum is dominated by emission from a photoionized plasma.
Then we used the photoionization code Cloudy to produce synthetic
models for the emission line component and the warm absorber observed
during phases of high intrinsic luminosity.
),
which in turn are tightly related to the location and size of the X-ray
emitting clouds. We carried out a phenomenological study to identify
the atomic transitions detected in the spectra. This study suggests
that the spectrum is dominated by emission from a photoionized plasma.
Then we used the photoionization code Cloudy to produce synthetic
models for the emission line component and the warm absorber observed
during phases of high intrinsic luminosity.
Results. The low state spectrum cannot be described by a single
photoionization component. A multi-ionization phase gas with an
ionization parameter in the range of
![]() and a column density
and a column density
![]() cm-2 is required, while the electron density
cm-2 is required, while the electron density ![]() remains unconstrained. A warm absorber medium is required by the fit with the parameters
remains unconstrained. A warm absorber medium is required by the fit with the parameters
![]() ,
,
![]() and
and
![]() .
The model is consistent with an X-ray emitting region at a distance
.
The model is consistent with an X-ray emitting region at a distance ![]()
![]() pc from the central engine.
pc from the central engine.
Key words: galaxies: Seyfert - galaxies: individual: NGC 4051 - techniques: spectroscopic
1 Introduction
It is commonly accepted that the center of active galaxies (Active
Galactic Nuclei -AGNs) hosts a massive black hole (with a mass in the
range 106-109 ![]() )
accreting the surrounding material via the formation of a disk. How the
energy released from the central engine interacts with the local
environment and contributes to the history of the host galaxy is one of
the crucial question of present astrophysical research.
In this respect, while the mechanisms of energy output in the form of
radiation and relativistic jets are quite well understood, it also
seems that the outflowing winds have an important role in the overall
energy budget.
Although the origin of these winds is still controversial, at our
present level of understanding the narrow-line regions, the inner part
of an obscuring torus (Blustin et al. 2005) and the black hole accretion disk (Elvis 2000) are all possible locations.
)
accreting the surrounding material via the formation of a disk. How the
energy released from the central engine interacts with the local
environment and contributes to the history of the host galaxy is one of
the crucial question of present astrophysical research.
In this respect, while the mechanisms of energy output in the form of
radiation and relativistic jets are quite well understood, it also
seems that the outflowing winds have an important role in the overall
energy budget.
Although the origin of these winds is still controversial, at our
present level of understanding the narrow-line regions, the inner part
of an obscuring torus (Blustin et al. 2005) and the black hole accretion disk (Elvis 2000) are all possible locations.
X-ray obscured AGNs (with an intrinsic column density
![]() cm-2) are not completely dark in the soft X-ray band. High resolution XMM-Newton
and Chandra observations revealed a complex spectrum dominated by
emission lines from He- and H-like transitions of elements from carbon
to neon as well as by L-shell transitions of Fe XVII to Fe XXI ions (Sako et al. 2000 a; Kinkhabwala et al. 2002; Sambruna et al. 2001; Armentrout et al. 2007). This gas, which shows the signature of a photoionization process (Kinkhabwala et al. 2002; Guainazzi & Bianchi 2007), is sometimes referred to as a warm mirror.
cm-2) are not completely dark in the soft X-ray band. High resolution XMM-Newton
and Chandra observations revealed a complex spectrum dominated by
emission lines from He- and H-like transitions of elements from carbon
to neon as well as by L-shell transitions of Fe XVII to Fe XXI ions (Sako et al. 2000 a; Kinkhabwala et al. 2002; Sambruna et al. 2001; Armentrout et al. 2007). This gas, which shows the signature of a photoionization process (Kinkhabwala et al. 2002; Guainazzi & Bianchi 2007), is sometimes referred to as a warm mirror.
In unobscured AGNs a modification of the output energy spectrum may
also occur as a consequence of absorption by a warm ionized gas along
the line of sight. The properties of these so called warm absorbers can
be summarized as follows: i) average ionization parameter in the range
![]() -3; ii) total column density in the range
-3; ii) total column density in the range
![]() -22 cm-2; iii) outflow velocities of hundred of km s-1 (see e.g. Blustin et al. 2005, but also Steenbrugge et al. 2009). Evidence of a multi-phase warm absorber gas was also recently reported for Mrk 841 (Longinotti et al. 2010).
-22 cm-2; iii) outflow velocities of hundred of km s-1 (see e.g. Blustin et al. 2005, but also Steenbrugge et al. 2009). Evidence of a multi-phase warm absorber gas was also recently reported for Mrk 841 (Longinotti et al. 2010).
In general, detecting warm mirror signatures is easier in sources in low flux states, because the emission features are not outshone by the continuum radiation. This was the case for the Seyfert 1 galaxy Mrk 335, whose soft X-ray spectrum resembled the spectra of obscured AGNs when the source was observed at low state (Longinotti et al. 2008), but does not show any evidence of a warm absorber in the high flux state (Longinotti et al. 2007).
The overall properties of the warm mirror (even if it is poorly constrained) and the warm absorber (as described above) are similar so that there is the possibility that they represent the same physical system. Conversely, the interplay between the warm absorber and warm mirror regimes is best studied in sources that display both components.
The source NGC 4051, a narrow-line Seyfert galaxy at the
redshift of 0.00234, was at the center of many past investigations in
the X-ray band because it offers a unique laboratory where to test
present theories and models about the physics of AGNs. The X-ray
emission is characterized by rapid variations (Lamer et al. 2003; Ponti et al. 2006) sometimes showing periods of low activity (see Lawrence et al. 1987 and Uttley et al. 1999). Its power spectral distribution (PSD) in high state resembles the behavior of a galactic black hole system (McHardy et al. 2004). At high X-ray flux, the spectrum of the galaxy is characterized by a power law with photon index
![]() -2
which becomes harder above 7 keV where a reflection component from
cold matter has been observed. On long time-scales, the X-ray light
curve of NGC 4051 shows low state flux periods of several months during
which the spectrum in the energy range 2-10 keV becomes harder (
-2
which becomes harder above 7 keV where a reflection component from
cold matter has been observed. On long time-scales, the X-ray light
curve of NGC 4051 shows low state flux periods of several months during
which the spectrum in the energy range 2-10 keV becomes harder (
![]() )
and shows a strong iron
)
and shows a strong iron ![]() line (as found by Guainazzi et al. 1998 in Beppo-SAX data). A soft `X-ray excess is also evident.
line (as found by Guainazzi et al. 1998 in Beppo-SAX data). A soft `X-ray excess is also evident.
As reported by Ogle et al. (2004),
the high state X-ray spectrum of NGC 4051 in the soft band is a
combination of continuum and emission line components. Curvature in the
spectrum cannot be explained with simple models, i.e. a single power
law or a black body, because an ionized absorber-emitter has to be
taken into account as well. In this context, Krongold et al. (2007)
showed that the evolution in time of the properties of the warm
absorber can constrain the physical parameters of the absorbing gas. In
particular they find that at least two different ionization components
are required with matter densities of ![]() 106 cm-3 and
106 cm-3 and ![]() 107 cm-3,
thus placing the warm absorber in the vicinity of the accretion-disk.
Dynamical arguments permit us to infer that the warm absorber gas
originates in a radiation-driven high-velocity outflow in accretion
disk instabilities (Krongold et al. 2007).
107 cm-3,
thus placing the warm absorber in the vicinity of the accretion-disk.
Dynamical arguments permit us to infer that the warm absorber gas
originates in a radiation-driven high-velocity outflow in accretion
disk instabilities (Krongold et al. 2007).
On the other hand, as shown by Pounds et al. (2004),
the low state flux spectrum of NGC 4051 is dominated by narrow emission
lines and radiative recombination continua (RRC) from hydrogenic and
He-like carbon, oxygen, neon and nitrogen. To be specific, a fit to the
identified RRCs yields a mean temperature for the emitting gas of
![]() K,
which favors a scenario invoking a photoionization process. In this
case, the soft X-ray spectrum of NFG 4051 in low state is similar to
that observed for the prototype Seyfert 2 galaxy NGC 1068 (see Kinkhabwala et al. 2002).
K,
which favors a scenario invoking a photoionization process. In this
case, the soft X-ray spectrum of NFG 4051 in low state is similar to
that observed for the prototype Seyfert 2 galaxy NGC 1068 (see Kinkhabwala et al. 2002).
Below we do not repeat the analysis of the EPIC data but refer to Pounds et al. (2004)
for more details on the main results obtained in the energy band
0.3-10 keV. We only say that a comparison between the EPIC PN data
for the 2001 and 2002 observations shows that the high state
observation flux level is a factor ![]() 5
greater with respect to the low state. Furthermore, the spectrum shows
a gradual flattening of the continuum slope from 3 keV up to
6.4 keV. It was also noted that when the fit to the
0.3-10 keV band continuum is extrapolated down in the soft X-ray
(0.3-3 keV) a strong excess appears in both the two observations,
and as is clear from the RGS spectrum, it can be explained by a
blending effect of fine structures (emission lines).
5
greater with respect to the low state. Furthermore, the spectrum shows
a gradual flattening of the continuum slope from 3 keV up to
6.4 keV. It was also noted that when the fit to the
0.3-10 keV band continuum is extrapolated down in the soft X-ray
(0.3-3 keV) a strong excess appears in both the two observations,
and as is clear from the RGS spectrum, it can be explained by a
blending effect of fine structures (emission lines).
Here we first conducted a phenomenological study of the emission lines identified in the spectrum of NGC 4051 and compare our results with those known in literature. We further compared the RGS emission line spectrum with synthetic spectra generated with the photoionization code Cloudy 8 (Ferland et al. 1998). For this purpose we followed a similar approach as in Armentrout et al. (2007) (to which we refer for more details) on NGC 4151.
The paper is structured as follows: in Sect. 2 we briefly describe the reduction of the XMM-Newton data set and describe our phenomenological analysis of the soft X-ray spectrum of NGC 4051. In Sects. 3 and 4 we give details on the Cloudy model developed and address some conclusions.
![\begin{figure}
\par\includegraphics[angle=90,width=13cm,clip]{13673f1.ps} %
\end{figure}](/articles/aa/full_html/2010/07/aa13673-09/img22.png)
|
Figure 1: Fluxed RGS spectrum of
NGC 4051 (low state). The first order spectra of the two RGS cameras
were combined and the resulting spectrum smoothed with a triangular
kernel. The identified lines are labeled with the corresponding ion
transition name and vertical dashed lines (the big dips at |
| Open with DEXTER | |
2 A phenomenological study of the low state of NGC 4051: data reduction and line identification
The source NGC 4051 (
![]() and
and
![]() )
was observed by the XMM-Newton satellite on two occasions: on May 2001 for
)
was observed by the XMM-Newton satellite on two occasions: on May 2001 for ![]() 122 ks and on November 2002 for
122 ks and on November 2002 for ![]() 52 ks. While the former observation coincided with a period where the central engine was bright (with luminosity of
52 ks. While the former observation coincided with a period where the central engine was bright (with luminosity of
![]() erg s-1 in the 0.3-10 keV, Pounds et al. 2004), the latter corresponded to a low state X-ray flux (corresponding to a luminosity of
erg s-1 in the 0.3-10 keV, Pounds et al. 2004), the latter corresponded to a low state X-ray flux (corresponding to a luminosity of
![]() erg s-1 in the 0.3-10 keV, Pounds et al. 2004) due to a low nuclear activity. This observation was conducted
erg s-1 in the 0.3-10 keV, Pounds et al. 2004) due to a low nuclear activity. This observation was conducted ![]() 20 days after the onset of the low state (Pounds et al. 2004).
Below we focus on the low state data analysis, because the warm
absorber observed at high state was already well studied with physical
models (Ogle et al. 2004; Krongold et al. 2007; Steenbrugge et al. 2009).
On the contrary, no attempt has yet been made to model the warm mirror
in the low state with a self consistent physical model.
20 days after the onset of the low state (Pounds et al. 2004).
Below we focus on the low state data analysis, because the warm
absorber observed at high state was already well studied with physical
models (Ogle et al. 2004; Krongold et al. 2007; Steenbrugge et al. 2009).
On the contrary, no attempt has yet been made to model the warm mirror
in the low state with a self consistent physical model.
The ODF files (OM, MOS, PN and RGS) were processed with the XMM-Science Analysis System (SAS version 8). Hence the raw data were reduced using SAS tasks with standard settings and the most update calibration files to produce the source and background spectra as well as the corresponding response matrices for the RGS cameras.
We used XSPEC 12.5.1 (Arnaud et al. 2007) for our quantitative analysis and adopted the cosmological parameters H0=70 km s-1 Mpc-1,
![]() and
and
![]() .
.
To study the soft X-ray spectra of NGC 4051 in more detail, we then examined the first order spectra obtained by the XMM-Newton gratings. The spectral resolution of RGS in the first order spectrum is
![]() mÅ and the calibration in wavelength is accurate up to 8 mÅ corresponding to
mÅ and the calibration in wavelength is accurate up to 8 mÅ corresponding to
![]() km s-1 and
km s-1 and
![]() km s-1 at 35 Å (XMM-Newton Users Handbook 2009). Below we use the unbinned RGS 1 and RGS 2 spectra for the quantitative analysis. In Fig. 1, we show the fluxed RGS spectrum in the wavelength range 5-38 Å.
km s-1 at 35 Å (XMM-Newton Users Handbook 2009). Below we use the unbinned RGS 1 and RGS 2 spectra for the quantitative analysis. In Fig. 1, we show the fluxed RGS spectrum in the wavelength range 5-38 Å.
As can be clearly seen, the 2002 RGS spectrum of NGC 4051 shows
an unresolved continuum with a predominance of emission lines (see for
comparison the RGS spectrum of NGC 1068 presented in Kinkhabwala et al. 2002).
By contrast, the high state RGS spectra of the same source show a
higher continuum flux level with a pronounced curvature around ![]() 15 Å and several absorption features (Pounds et al. 2004) typical of a warm absorber. Interestingly, the N VI, O VII and Ne IX forbidden lines are seen in both observations with the same flux level (Pounds et al. 2004).
15 Å and several absorption features (Pounds et al. 2004) typical of a warm absorber. Interestingly, the N VI, O VII and Ne IX forbidden lines are seen in both observations with the same flux level (Pounds et al. 2004).
The phenomenological spectral analysis follows the local fits method described in Guainazzi & Bianchi (2007). In particular, the unbinned spectra are divided in intervals of ![]() 100 channels
wide and Gaussian profiles are used to account for all identified
emission lines, with the line centroid energy as the only free
parameter of the fit.
100 channels
wide and Gaussian profiles are used to account for all identified
emission lines, with the line centroid energy as the only free
parameter of the fit.
Analogously, free-bound transitions (i.e. Radiative
Recombination Continua) were also modeled as Gaussian profiles with
free line width. Best-fit values of these widths are reported in
Table 2 together with their errors. The local continuum was modeled as a power law with a fixed photon index
![]() and free normalization. For line triplets and for emission lines close
to free-bound transitions, the relative distance between the central
energies was frozen to the value predicted by atomic physics.
and free normalization. For line triplets and for emission lines close
to free-bound transitions, the relative distance between the central
energies was frozen to the value predicted by atomic physics.
We used the C-statistic as the estimator of the goodness of the performed fit (Cash 1979). For any line under investigation, the emission feature was considered detected
if, when repeating the fit without any Gaussian profile, we obtained a
value of the C-statistic which differed from the previous one by at
least 2.3, corresponding to the 68![]() confidence level (or, equivalently, 1
confidence level (or, equivalently, 1![]() for one interesting parameter; Arnaud et al. 2007).
for one interesting parameter; Arnaud et al. 2007).
The results of the phenomenological fit to the emission lines are reported in Table 1.
We recall that the fluxes of the identified emission lines were
estimated integrating over the Gaussian line profiles with which the
emission features are modeled. This operation resulted in flux values
somehow higher (up to a factor of ![]() 1.5) than those reported in Pounds et al. (2004)
even if the corresponding measured equivalent widths are fully
consistent with the values quoted in the above mentioned paper. The
origin of the discrepancy remains unknown.
1.5) than those reported in Pounds et al. (2004)
even if the corresponding measured equivalent widths are fully
consistent with the values quoted in the above mentioned paper. The
origin of the discrepancy remains unknown.
Here we give the best-fit parameters for the transitions identified in the soft X-ray spectrum of NGC 4051.
For those lines that were not identified (i.e.
![]() ), but which are part still of triplet features, we give the upper limits to the corresponding flux value.
We detected no evidence for either inflows or outflows, with an upper limit on the velocity of
), but which are part still of triplet features, we give the upper limits to the corresponding flux value.
We detected no evidence for either inflows or outflows, with an upper limit on the velocity of ![]() 200 km s-1, consistent with that estimated by Pounds et al. (2004).
This was calculated from the full width half maximum of the
distribution of residual velocity as derived from the difference
between the expected
and the measured laboratory wavelengths (see Fig. 2 and also Table 1).
200 km s-1, consistent with that estimated by Pounds et al. (2004).
This was calculated from the full width half maximum of the
distribution of residual velocity as derived from the difference
between the expected
and the measured laboratory wavelengths (see Fig. 2 and also Table 1).
Table 1: Best-fit parameters for the transitions identified in the soft X-ray spectrum of NGC 4051.
Table 2: The same as in Table 1 but for the identified RRCs.
2.1 Radiative recombination continua (RRC)
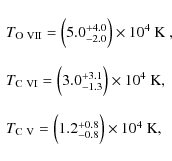
The electron temperature ![]() can be inferred by studying the profiles of the radiative recombination
continua (RRC). In the RGS spectrum of NGC 4051 the RRCs detected with
can be inferred by studying the profiles of the radiative recombination
continua (RRC). In the RGS spectrum of NGC 4051 the RRCs detected with
![]() correspond to O VII, C V and C VI (see Table 2 for details). Expressing the temperature widths in eV to
correspond to O VII, C V and C VI (see Table 2 for details). Expressing the temperature widths in eV to
![]() (Liedhal 1999), we estimate them to be
(Liedhal 1999), we estimate them to be
|
(1) |
respectively, so that the average gas temperature is
In this phenomenological analysis, we used Gaussian profiles to fit the RRC features, which are in principle asymmetric. Still we verified that the use of a more appropriate model, as e.g. redge in XSPEC, gives consistent results.
![\begin{figure}
\par\includegraphics[width=9cm,clip]{13673f2.eps}
\end{figure}](/articles/aa/full_html/2010/07/aa13673-09/img94.png)
|
Figure 2: Distribution of residual velocity for all lines in Table 1 with respect to the cosmological one. Note that the observed shifts are consistent with the cosmological ones, i.e. no outflow or inflow is observed. The solid line represents the Gaussian best-fit to the data. |
| Open with DEXTER | |
![\begin{figure}
\par\includegraphics[width=9cm,clip]{13673f3.eps}
\end{figure}](/articles/aa/full_html/2010/07/aa13673-09/img95.png)
|
Figure 3: Zoom around the O VII triplet lines in the low flux state. The emission lines correspond to the f, i and r components, respectively. Only an upper limit to the resonance line r can be obtained (see text). The solid line represents the best-fit obtained with a power law + Gaussian lines model (details in text). |
| Open with DEXTER | |
2.2 He-like triplet diagnostic
We detected the most intense lines of He-like ions in the range 5-35 Å. The transitions between the n=2 shell and the n=1 ground state shell as the resonance line (r: 1s2 1S0-1s2p 1P1), the two inter-combination lines (i: 1s21S0-1s2p 3P2,1, often blended) and the forbidden line (f: 1s21S0-1s2s3S1) were detected. As demonstrated by Porquet & Dubau (2000) the relative emission strength of the r, i and f lines are good indicators of the physical conditions of density and temperature of the gas. Using standard notation we defined the ratios R=f/i, L=r/i and G=(f+i)/r (Porter & Ferland. 2007). Figure 3 shows the triplet of the O VII complex (forbidden, inter-combination and resonance lines) locally fitted by a power law and three Gaussian. In this case, following the phenomenological fit approach described in the previous section, we only had a measurement for the fluxes of the f and i components (see Table 1).
With the flux measurements quoted in Table 1, the previous relations give
![]() ,
,
![]() and
and
![]() .
Analogously, for the NVI triplet we get
.
Analogously, for the NVI triplet we get
![]() ,
,
![]() and
and ![]() (poorly constrained because we only got an upper limit to the r line flux value), respectively. For Ne IX we had a lower limit only on the
(poorly constrained because we only got an upper limit to the r line flux value), respectively. For Ne IX we had a lower limit only on the
![]() ratio, while the ratio of the O VIII Ly-
ratio, while the ratio of the O VIII Ly-![]() to the O VII forbidden intensity lines results in
to the O VII forbidden intensity lines results in
![]() .
These line ratios are consistent with the results by Pounds et al. (2004).
.
These line ratios are consistent with the results by Pounds et al. (2004).
2.3 Results of the phenomenological study: evidence of photoionized gas
The results obtained from the phenomenological study allow us to
highlight some considerations on the physical conditions of the X-ray
emitting gas in NGC 4051. Indeed, according to the study of Porquet & Dubau (2000),
a value of the G ratio higher than 4 is a strong indication of a
photoionized gas. An estimate of the gas electron density ![]() can be done when the other two line ratios L and R are taken into account. In the particular case of the O VII triplet line ratios quoted above, the electron density is constrained to be
can be done when the other two line ratios L and R are taken into account. In the particular case of the O VII triplet line ratios quoted above, the electron density is constrained to be
![]() cm-3 for a pure photoionized gas (Porquet & Dubau 2000).
Note however that the line intensities obtained from the
phenomenological study described above do not account for a warm
absorber, which is not taken into account in the model.
cm-3 for a pure photoionized gas (Porquet & Dubau 2000).
Note however that the line intensities obtained from the
phenomenological study described above do not account for a warm
absorber, which is not taken into account in the model.
An additional constraint on the electron density value can be obtained noting that the XMM-Newton observation of NGC 4051 in its low state occurred ![]() 20 days after the source entered this regime.
Because the O VII triplet line intensity is consistent with that measured during high flux states (Pounds et al. 2004), it is believed that the recombination time of the O VII
is larger than 20 days,thus implying (for a gas temperature of
20 days after the source entered this regime.
Because the O VII triplet line intensity is consistent with that measured during high flux states (Pounds et al. 2004), it is believed that the recombination time of the O VII
is larger than 20 days,thus implying (for a gas temperature of ![]() 104 K) a more stringent constraint on the electron density of
104 K) a more stringent constraint on the electron density of
![]() cm-3 (Pounds et al. 2004).
cm-3 (Pounds et al. 2004).
3 Fitting the spectra with the photoionization code Cloudy
3.1 General properties of the model
The results of the phenomenological analysis in Sect. 2 show that the bulk of the spectrum, measured by the RGS during the X-ray low state in NGC 4051, is dominated by photoionization as already suggested by other authors (see e.g. Pounds et al. 2004).
In this section we use the photoionization code Cloudy (Ferland et al. 1998) for modeling the overall spectrum of NGC 4051 in its low state assuming a plane parallel geometry with the central engine shining on the inner face of the cloud with a flux density depending on the ionization parameter U.
The spectrum produced by a photoionized nebula critically depends on
the spectral energy distribution (SED) of the ionizing continuum. Below
we adopt the AGN SED as in Korista et al. (1997b).
In a typical AGN the observed continuum can be well represented by a
SED characterized by several components: a big blue bump with
temperature
![]() K (1 Ryd), a power law with a low energy exponential cut-off in the infrared region at
K (1 Ryd), a power law with a low energy exponential cut-off in the infrared region at
![]() Ryd; in the X-ray band (1.36 eV-100 keV) the SED is
well approximated by a power law with an exponential cut-off for
energies lower than 1 Ryd; finally, for energies greater than
100 keV an exponential fall as
Ryd; in the X-ray band (1.36 eV-100 keV) the SED is
well approximated by a power law with an exponential cut-off for
energies lower than 1 Ryd; finally, for energies greater than
100 keV an exponential fall as
![]() is usually assumed . We also included in the modeling the cosmic
microwave background so that the incident continuum has a non-zero
intensity for long wavelengths. Hence the AGN spectrum is described by
the law
is usually assumed . We also included in the modeling the cosmic
microwave background so that the incident continuum has a non-zero
intensity for long wavelengths. Hence the AGN spectrum is described by
the law
|
(2) |
where
To determine
![]() and
and
![]() ,
we used the Epic data corresponding to the NGC 4051 high state
observation. The resulting 0.2-10 keV energy band spectrum was
fitted with a photoelectrically absorbed power law model within XSPEC,
thus allowing us to measure
,
we used the Epic data corresponding to the NGC 4051 high state
observation. The resulting 0.2-10 keV energy band spectrum was
fitted with a photoelectrically absorbed power law model within XSPEC,
thus allowing us to measure
![]() and
and
![]() erg s-1 cm-2 Hz-1, respectively.
erg s-1 cm-2 Hz-1, respectively.
From the OM instrument we estimated the aperture photometry of the
target in the UVM2 filter (centered at 2310 Å) obtaining a flux
density of
![]() erg s-1 cm-2 Å-1. From the flux densities at 2 keV and 2500 Å, the X-UV flux density ratio results in
erg s-1 cm-2 Å-1. From the flux densities at 2 keV and 2500 Å, the X-UV flux density ratio results in
![]() .
.
Once the AGN SED (erg s-1 cm-2 Hz-1) is known, it is straightforward to show that the number of hydrogen-ionizing photons Q![]() , the electron density
, the electron density ![]() and the dimensionless ionization parameter U are related by
and the dimensionless ionization parameter U are related by
![]() with r
the distance between the central engine and the innermost illuminated
layer of the clouds. Here we require that integrating over the SED
(between 13.6 eV and 13.6 keV) we get the ionizing luminosity
with r
the distance between the central engine and the innermost illuminated
layer of the clouds. Here we require that integrating over the SED
(between 13.6 eV and 13.6 keV) we get the ionizing luminosity
![]() erg s-1 (Ogle et al. 2004). In Fig. 4 we compare the SED used in this paper (solid line) with that given in Ogle et al. (2004). We recall that the dimensionless ionization parameter U
does not depend on the flux below 13.6 eV. The two spectral energy
distributions give rise to comparable integrated fluxes in the
0.3-10 keV energy band (within a few percent).
erg s-1 (Ogle et al. 2004). In Fig. 4 we compare the SED used in this paper (solid line) with that given in Ogle et al. (2004). We recall that the dimensionless ionization parameter U
does not depend on the flux below 13.6 eV. The two spectral energy
distributions give rise to comparable integrated fluxes in the
0.3-10 keV energy band (within a few percent).
Note also that through the well known definitions of the ionizing luminosity
![]() ,
of the number of ionizing photons Q (Ferland et al. 1998) and the used SED
,
of the number of ionizing photons Q (Ferland et al. 1998) and the used SED ![]() ,
it is possible to estimate a useful conversion relation between the dimensionless ionization parameter U and the ionization parameter
,
it is possible to estimate a useful conversion relation between the dimensionless ionization parameter U and the ionization parameter ![]() as given in Tarter et al. (1969), i.e.
as given in Tarter et al. (1969), i.e.
![]() erg cm s-1.
erg cm s-1.
![\begin{figure}
\par\includegraphics[width=9cm,clip]{13673f4.eps}\vspace*{-2mm}
\end{figure}](/articles/aa/full_html/2010/07/aa13673-09/img127.png)
|
Figure 4: SED used in the paper (solid line). For comparison we also give (dashed line) the SED given in Ogle et al. (2004). This was taken from the NED database and is likely to contain contamination from the hosting galaxy. |
| Open with DEXTER | |
3.2 Fit to the RGS spectrum
Assuming the standard AGN continuum described above, we generated a
grid of reflected spectra from a photoionized nebula, varying the
ionization parameter ![]() ,
the electron density
,
the electron density
![]() and the total column density
and the total column density
![]() .
The free parameters spanned the ranges
.
The free parameters spanned the ranges
![]() ;
;
![]() and
and
![]() in steps of 0.1 dex, respectively.
in steps of 0.1 dex, respectively.
Initially we extracted the line intensities from these simulations for
all lines detected in the soft spectrum of NGC 4051. Hence, we tried to
determine the best model that can describe the RGS line spectrum in the
whole 5-35 Å band. Following the procedure described in Longinotti et al. (2008), we calculated the value of the merit function for each grid model
|
(3) |
where Io is the intensity of each of the identified lines (with statistical error
Minimizing the merit function quoted above gives a best-fit model (
![]() with degrees of freedom
with degrees of freedom ![]() )
corresponding to the parameter values
)
corresponding to the parameter values
![]() ,
,
![]() and
and
![]() .
A quantitative measure of the fit goodness for the used model is given by the Chi-square Probability Function
.
A quantitative measure of the fit goodness for the used model is given by the Chi-square Probability Function
![]() as defined in Press et al. (2004). If the single phase component model is
the true representation of the data, the probability to obtain the observed
as defined in Press et al. (2004). If the single phase component model is
the true representation of the data, the probability to obtain the observed ![]() value is as high as
value is as high as
![]() .
In this case, the model consisting of a single ionization state can be statistically rejected.
.
In this case, the model consisting of a single ionization state can be statistically rejected.
We therefore investigated more complex models, including an additional warm mirror and one warm absorber covering the combination of emitting components. For this approach to be fruitful the constraints provided by the continuum shape are crucial. Below we will fit the whole RGS spectrum globally.
3.3 Global fit to the RGS spectrum
We generated additive and multiplicative fits tables (with the same
grid of parameters as before) to account for both the emission and
absorption features observed in the RGS spectrum, and imported them
within XSPEC as described in Porter et al. (2006). Our final model can be described by the formula
![]() .
Here, mtab and atab
indicate the warm absorber component and the reflected component part
of the spectrum depending on the electron density, hydrogen column
density and ionization parameter, respectively. In the model, the
redshift of each component is fixed to the cosmological value due to
the lack of measurable velocity shifts from the phenomenological
analysis (Fig. 2), while
all the other parameters are free to vary. In the fit procedure we
fixed the column density of neutral hydrogen to the average value
observed in the Galaxy along the line of sight to NGC 4051, i.e.
.
Here, mtab and atab
indicate the warm absorber component and the reflected component part
of the spectrum depending on the electron density, hydrogen column
density and ionization parameter, respectively. In the model, the
redshift of each component is fixed to the cosmological value due to
the lack of measurable velocity shifts from the phenomenological
analysis (Fig. 2), while
all the other parameters are free to vary. In the fit procedure we
fixed the column density of neutral hydrogen to the average value
observed in the Galaxy along the line of sight to NGC 4051, i.e.
![]() cm-2 (Dickey & Lockman 1990).
cm-2 (Dickey & Lockman 1990).
The fit does not formally depend on values of
![]() cm-3,
which is expected because the ratios of the He-like triplets are
insensitive to the electron density in this region of the space
parameter (Porquet & Dubau 2000). Given the constraint on this parameter derived from the source time variability, we fixed its value to 105 cm-3 hereafter.
cm-3,
which is expected because the ratios of the He-like triplets are
insensitive to the electron density in this region of the space
parameter (Porquet & Dubau 2000). Given the constraint on this parameter derived from the source time variability, we fixed its value to 105 cm-3 hereafter.
We recursively increased the number of Cloudy additive components until this operation resulted in a statistically significant improvement of the fit quality. We found that two emission and one absorption components are required to fit the data. In particular, the final model corresponds to a value of the C-statistic of 6300 with 5178 d.o.f. and the model parameters are given in Table 4. Conversely, when the warm absorber component is not taken into account the fit visibly worsens and converges to a C-statistic value of 9452 with 5182 d.o.f. In this case, the line intensities corresponding to the He-like transitions are not correctly estimated, with specifically the recombination line of the O VII triplet well over-estimated (see Fig. 5).
![\begin{figure}
\par\includegraphics[angle=-90,width=9cm,clip]{13673f5.ps}\vspace*{-2mm}
\end{figure}](/articles/aa/full_html/2010/07/aa13673-09/img148.png)
|
Figure 5: Comparison of a model with two emission components (solid line) with the observed RGS spectrum (zoom around the O VII triplet). |
| Open with DEXTER | |
We then extracted the line fluxes predicted by the best-fit model and compared them with the observations. In Fig. 6, we show with filled squares the intensities of all observed (see Table 1) and simulated (triangles) lines once normalized to the O VIII Ly-![]() flux. The lower panel of the same figure shows the residuals between
observation and theory. Note that the simulation underestimates the
contribution of the Fe XVII transitions, because the Cloudy database is inaccurate for the corresponding
atomic parameters (see e.g. Bianchi et al. 2010). The normalized intensities of the observed lines as well as the Cloudy predictions are also reported in Table 3 for clarity with the missing value of the Fe XVII transition.
flux. The lower panel of the same figure shows the residuals between
observation and theory. Note that the simulation underestimates the
contribution of the Fe XVII transitions, because the Cloudy database is inaccurate for the corresponding
atomic parameters (see e.g. Bianchi et al. 2010). The normalized intensities of the observed lines as well as the Cloudy predictions are also reported in Table 3 for clarity with the missing value of the Fe XVII transition.
![\begin{figure}
\par\includegraphics[width=8.8cm,clip]{13673f6.eps}\vspace*{-2mm}
\end{figure}](/articles/aa/full_html/2010/07/aa13673-09/img149.png)
|
Figure 6:
Intensities of the observed (filled squares) and simulated (triangles)
lines corresponding to the best-fit and normalized to the O VIII Ly- |
| Open with DEXTER | |
Table 3:
Intensities of the observed lines and of those simulated by Cloudy corresponding to the best-fit and normalized to the O VIII Ly-![]() flux (see text and Fig. 6 for more details).
flux (see text and Fig. 6 for more details).
In Table 4 we give the relevant quantities estimated from the fit procedure (i.e. ![]() ,
,
![]() and U) together with their respective errors at the 90
and U) together with their respective errors at the 90![]() confidence level for one interesting parameter. The 5-35 Å low-state spectrum of NGC 4051 is plotted in Fig. 7
with the best-fit Cloudy model superimposed on the observed RGS 1
(red) and RGS 2 (black) data and residuals in the lower part of
each panel.
confidence level for one interesting parameter. The 5-35 Å low-state spectrum of NGC 4051 is plotted in Fig. 7
with the best-fit Cloudy model superimposed on the observed RGS 1
(red) and RGS 2 (black) data and residuals in the lower part of
each panel.
Note that to estimate the covering factor of the source, we
extracted the luminosity of the most prominent emission line, O VII (f),
as predicted by Cloudy. For the two reflection components included in
our model, we simulated the expected spectrum the SED described in
Sect. 3.1 and fixing the electron density ![]() and hydrogen column density
and hydrogen column density ![]() to the best-fit values given in Table 4. In addition, the SED was normalized to the ionizing luminosity
to the best-fit values given in Table 4. In addition, the SED was normalized to the ionizing luminosity
![]() erg s-1 (Ogle et al. 2004).
Hence we fixed the distance from the source to the inner shell of the
cloud to the lower values reported in Table 4 for each of the
reflection components, i.e.
erg s-1 (Ogle et al. 2004).
Hence we fixed the distance from the source to the inner shell of the
cloud to the lower values reported in Table 4 for each of the
reflection components, i.e.
![]() pc and
pc and
![]() pc for the low and high
component, respectively. After we defined the luminosity of the source,
the emission line luminosities were predicted by Cloudy (see e.g. Ferland 2008).
pc for the low and high
component, respectively. After we defined the luminosity of the source,
the emission line luminosities were predicted by Cloudy (see e.g. Ferland 2008).
With a redshift of 0.00234, the expected total intensity of the O VII (f) line is ![]()
![]() erg s-1 cm-2. Assuming a filling factor of unity, the ratio of the observed O VII (f) intensity (see Table 1) to the Cloudy expected value gives an estimate of the covering factor value, which turns out to be
erg s-1 cm-2. Assuming a filling factor of unity, the ratio of the observed O VII (f) intensity (see Table 1) to the Cloudy expected value gives an estimate of the covering factor value, which turns out to be ![]() 0.14.
0.14.
![\begin{figure}
\par\subfigure[]{\includegraphics[width=7.8cm,clip]{13673f7a.eps}...
...dth=6cm,angle=-90,clip]{13673f7f.ps} }\vspace*{-2mm}
\vspace*{-3mm}
\end{figure}](/articles/aa/full_html/2010/07/aa13673-09/img161.png)
|
Figure 7: The 5-35 Å RGS 1 (red data points) and RGS 2 (black data points) spectra are shown together with the best-fit Cloudy model described in the text and corresponding to the physical parameters reported in Table 4. |
| Open with DEXTER | |
4 Discussion
Most of the information on the physics and geometry of gas in AGNs is
inferred by means of optical spectroscopy and imaging techniques with
which it was shown that the AGN central high energy emission is the
main source of ionizing photons with an occasional contribution from
collisionally ionized plasma. In the last years X-rays observations
acquired an important role in AGN studies particularly since Chandra
showed the existence, at least for Seyfert 2 galaxies, of extended
(a few kpc) X-ray emission (Bianchi et al. 2006)
similarly to what was observed in the optical band.
High resolution spectroscopy in the soft X-ray band (0.2-2 keV)
confirms the overall scenario, and photoionization seems to be
the dominant ionization mechanism which results in a spectrum
characterized by recombination lines from He- and H-like transitions of
C to Si elements and by Fe-L transitions. In this respect, X-ray
high-resolution spectroscopy offers a powerful diagnostic tool because
the observed spectral features strongly depend on the physical
properties of matter (ionization parameter U, electron density ![]() ,
hydrogen column density
,
hydrogen column density ![]() as well as size and location of the emitting clouds).
as well as size and location of the emitting clouds).
The Seyfert 1 object NGC 4051 shows a very rich emission line X-ray
spectrum when observed in low-flux state. According to the analysis we
conducted on the XMM-Newton RGS data, the observed soft X-ray features originate in a low-density photoionized gas.
In order to constrain the physical properties of the photoionized gas, we simulated synthetic spectra via the Cloudy software (Ferland et al. 1998)
and compared them to the RGS data with standard minimization
techniques. We found that to describe the overall soft X-ray spectrum,
at least a three-phase gas is required (two emission components and one
warm absorbing component). Referring to the emission components
respectively as low and high ionization components, our fit procedure gave us their physical properties. For the low component we have
![]() ,
and
,
and
![]() and for the high component we have
and for the high component we have
![]() ,
and
,
and
![]() .
Using Cloudy we get for the electron density
.
Using Cloudy we get for the electron density ![]() an upper limit of
an upper limit of
![]() ,
which reduces to
,
which reduces to
![]() when the recombination time scale of O VII
is taken into account. Even if the warm absorber gas seems to be
required by our fit procedure, its parameters are poorly constrained.
Thus it is characterized by
when the recombination time scale of O VII
is taken into account. Even if the warm absorber gas seems to be
required by our fit procedure, its parameters are poorly constrained.
Thus it is characterized by
![]() ,
,
![]() ,
and
,
and
![]() .
.
Table 4: Best-fit parameters for the three components of the adopted Cloudy model used to fit the RGS data.
This technique was successfully applied before to the Seyfert 1 Mrk 335 and the Seyfert 2/starburst galaxy NGC 1365 (Guainazzi et al. 2009; Longinotti et al. 2008).
The main difference is that NGC 4051 is characterized by a strong
warm absorber component in the high flux state that is still affecting
the spectrum even when the nuclear flux is attenuated. Indeed, we found
out in our analysis of the low flux state data that the effect of the
line of sight medium is not negligible, particularly not in the
modeling of the resonance line of the O VII triplet (see Fig. 5)
which is close to several absorption features. For example, the
resonance line could be weakened by the same line in absorption![]() (see e.g. Krongold et al. 2007).
Nonetheless, the physical parameters of the warm absorber cannot be
well-constrained by the analysis of the low flux state data (see Table
4).
(see e.g. Krongold et al. 2007).
Nonetheless, the physical parameters of the warm absorber cannot be
well-constrained by the analysis of the low flux state data (see Table
4).
The average distance r of each of the photoionized
plasma-emitting components from the nuclear source can be estimated by
the definition of the ionization parameter U after normalizing to the ionization luminosity
![]() .
However, our results are insensitive to values of the electron density
.
However, our results are insensitive to values of the electron density ![]() lower than 105 cm-3. In this limit, we can only determine a lower limit of the X-ray-emitting gas location (Table 4).
lower than 105 cm-3. In this limit, we can only determine a lower limit of the X-ray-emitting gas location (Table 4).
![\begin{figure}
\par\mbox{\subfigure[]{\includegraphics[width=7.8cm,clip]{13673f8...
...}
\subfigure[]{\includegraphics[width=7.8cm,clip]{13673f8b.eps} }}\end{figure}](/articles/aa/full_html/2010/07/aa13673-09/img184.png)
|
Figure 8: The cartoon shows qualitatively the location of the X-ray emitting and absorbing material (see text for details). |
| Open with DEXTER | |
The analysis carried out in this paper allowed us to identify two
ionization states for the line emitting gas and one warm absorber
medium. It is interesting to note that
- The X-ray emitting region can be placed at a distance of
 pc.
pc.
This is also naturally expected as a consequence of projection effects: as shown by Schmitt et al. (2003), who studied a sample of 60 Seyfert galaxies with the Hubble Space Telescope, the Seyfert 1 narrow-line regions objects are more circular and compact than those in the Seyfert 2 galaxies, with the Seyfert 2 subsample characterized by more elongated shapes. This agrees well with the unified picture according to which the conical narrow-line region of a Seyfert 1 galaxy is observed close to the axis of symmetry, while that of a Seyfert 2 galaxy is observed from an orthogonal line of sight.
Furthermore, the scale-length found in this paper is consistent
with the inner radius of the torus in NGC 4051 as determined by Blustin et al. (2005), i.e.
![]() pc.
pc.
- The NGC 4051 low state warm absorber is poorly constrained but
its existence is nevertheless required by the fit. In particular, we
found a lower limit of the warm absorber distance
 0.02 pc, i.e. at least a factor 10 larger than that measured in the high state flux (Krongold et al. 2007).
They specifically found that the warm absorber consists of two
different ionization components which are located within 3.5 lt-days
(or 0.0029 pc) from the central massive black hole. This result allowed
the authors to exclude an origin in the dusty obscuring torus because
the expected dust sublimation radius![]() is at least one order of magnitude larger. Hence the authors suggested
a model in which the black hole accretion disk is at the origin of a
X-ray absorber wind, which forms a conical structure moving upward.
is at least one order of magnitude larger. Hence the authors suggested
a model in which the black hole accretion disk is at the origin of a
X-ray absorber wind, which forms a conical structure moving upward.
If this is the correct picture, when the continuum source is switched off, the compact warm absorber might not be observed anymore during the low state flux of NGC 4051. Our analysis showed instead the existence of a more exterior X-ray absorber, which absorbs the soft X-ray photons emitted from sources (as for example the inner surface of the conical structure proposed by Krongold et al. 2007) located (in projection) at scales larger than the torus and/or the narrow-line regions. Remarkably, this could indicate the existence of a diffuse warm material filling the wind-generated cone.
Figure 8 gives a
qualitative representation of the model.
During the high state flux (left panel) a two ionization component warm
absorber (here labeled as II) lying within a few l-days (![]() 0.003 pc) from the accreting black hole was identified by Krongold et al. (2007). Ogle et al. (2004) found that the NGC 4051 X-ray narrow-line regions can be placed at a distance of r>0.02 pc, while the optical narrow-line regions are on the scale of tenth of parsec (Christopoulou et al. 1997).
During the low state flux (right panel), the interior warm absorber
might not be observed anymore since the central engine is switched off.
A more exterior warm absorber (labeled as I) could now absorb the
X-ray photons emitted from sources located on the scale larger than the
torus and/or the narrow-line regions.
0.003 pc) from the accreting black hole was identified by Krongold et al. (2007). Ogle et al. (2004) found that the NGC 4051 X-ray narrow-line regions can be placed at a distance of r>0.02 pc, while the optical narrow-line regions are on the scale of tenth of parsec (Christopoulou et al. 1997).
During the low state flux (right panel), the interior warm absorber
might not be observed anymore since the central engine is switched off.
A more exterior warm absorber (labeled as I) could now absorb the
X-ray photons emitted from sources located on the scale larger than the
torus and/or the narrow-line regions.
This paper is based on observations from XMM-Newton, an ESA science mission with instruments and contributions directly funded by ESA Member States and NASA. We are grateful to the anonymous referee for the suggestions that improved the paper a lot. A.A.N. is grateful to R. Porter for help with the Cloudy code, to C. Gordon for solving a few issues with the XSPEC package and to Yair Krongold for many fruitful conversations while writing this paper. Our acknowledgements also to Marco Castelli for drawing the cartoon in Fig. 8.
References
- Armentrout, B. K., Kraemer, S. B., & Turner, T. J. 2007, ApJ, 665, 237 [NASA ADS] [CrossRef] [Google Scholar]
- Arnaud, K., Dorman, B., & Gordon, C. 2007, ApJ, An X-ray Spectral Fitting Package - User's Guide for version 12.4.0, Heasarc Astrophysics Science Division [Google Scholar]
- Bianchi, S., Guainazzi, M., & Chiaberge, M. 2006, A&A 448, 499 [NASA ADS] [CrossRef] [EDP Sciences] [Google Scholar]
- Bianchi, S., Chiaberge M., Evans, A. D., et al. 2010, MNRAS, in press [Google Scholar]
- Blustin, A. J., Page, M. J., Fuerst, S. V., et al. 2005, A&A, 431, 111 [NASA ADS] [CrossRef] [EDP Sciences] [Google Scholar]
- Cash, W. 1979, ApJ, 228, 939 [NASA ADS] [CrossRef] [Google Scholar]
- Collinge, M. J., Brandt, W. N., Kaspi, S., et al. 2001, ApJ, 557, 2 [NASA ADS] [CrossRef] [Google Scholar]
- Christopoulou, P. E., Holloway, A. J., Steffen, W., et al. 1997, ApJ, MNRAS, 284, 385 [Google Scholar]
- Dere, K. P. 2001, ApJSS, 134, 331 [NASA ADS] [CrossRef] [Google Scholar]
- Dickey, J. M., & Lockman, F. J. 1990, ARA&A, 28, 215 [NASA ADS] [CrossRef] [MathSciNet] [Google Scholar]
- Elvis, M. 2000, BAAS, 32, 1195 [NASA ADS] [Google Scholar]
- Ferland, G. J., Korista, K. T., Verner, D. A., et al. 1998, PASP, 110, 761 [Google Scholar]
- Ferland, G. J. 2008, Hazy 1, A brief Introduction To Cloudy, Introduction And Commands, available at http://www.nublado.org [Google Scholar]
- Guainazzi, M., & Bianchi, S. 2007, MNRAS, 374, 1290 [NASA ADS] [CrossRef] [Google Scholar]
- Guainazzi, M., Nicastro, F., Fiore, F., et al. 1998, MNRAS, 301, 1 [Google Scholar]
- Guainazzi, M., Risaliti, G., Nucita, A. A., et al. 2009, A&A, 505, 589 [NASA ADS] [CrossRef] [EDP Sciences] [Google Scholar]
- Kinkhabwala, A., Sako, M., Behar, E., et al. 2002, ApJ, 575, 732 [NASA ADS] [CrossRef] [Google Scholar]
- Krongold, Y., Nicastro, F., Elvis, M., et al. 2007, ApJ, 659, 1022 [NASA ADS] [CrossRef] [Google Scholar]
- Korista, K., Baldwin, J., Ferland, G., & Verner, D. 1997a, ApJS, 108, 401 [NASA ADS] [CrossRef] [Google Scholar]
- Korista, K., Ferland, G., & Baldwin, J. 1997b, ApJ, 487, 555 [NASA ADS] [CrossRef] [Google Scholar]
- Lamer, G., McHardy, I. M., Uttley, P., & Jahoda, K. 2003, MNRAS, 338, 323 [NASA ADS] [CrossRef] [Google Scholar]
- Lawrence, A., Watson, M. G., Pounds, K. A., & Elvis, M. 1987, Nature, 325, 694 [NASA ADS] [CrossRef] [Google Scholar]
- Liedahl, D. A. 1999, in X-Ray Spectroscopy in Astrophysics, Lectures held at the Astrophysics School X, ed. J. van Paradijs & J. A. M. Bleeker, 520, 189 [Google Scholar]
- Longinotti, A. L., Sim, S. A., Nandra, K., & Cappi, M. M. 2007, MNRAS, 374, 237 [NASA ADS] [CrossRef] [Google Scholar]
- Longinotti, A. L., Nucita, A. A., Santos, Lleo M., & Guainazzi, M. 2008, A&A, 484, L311 [NASA ADS] [CrossRef] [EDP Sciences] [Google Scholar]
- Longinotti, A. L., Costantini, E, Petrucci, P. O., et al. 2010, A&A, 510, 92 [Google Scholar]
- McHardy, I. M., Papadakis, I. E., Uttley, P., et al. 2004, MNRAS, 348, 783 [NASA ADS] [CrossRef] [Google Scholar]
- Ogle, P. M., Mason, K. O., Page, M. J., et al. 2004, ApJ, 606, 151 [NASA ADS] [CrossRef] [Google Scholar]
- Ponti, G., Miniutti, G., Cappi, M., et al. 2006, MNRAS, 368, 903 [NASA ADS] [CrossRef] [Google Scholar]
- Porquet, D., & Dubau, J. 2000, A&AS, 143, 495 [NASA ADS] [CrossRef] [EDP Sciences] [Google Scholar]
- Porter, R. L., Ferland, G. J., Kraemer, S. B., et al. 2006, PASP, 118, 920 [NASA ADS] [CrossRef] [Google Scholar]
- Porter, R., & Ferland, G. 2007, ApJ, 664, 586 [NASA ADS] [CrossRef] [Google Scholar]
- Pounds, K. A., Reeves, J. N., king, A. R. & Page, K. L. 2004, MNRAS, 350, 10 [NASA ADS] [CrossRef] [Google Scholar]
- Press, W. H., Teukolsky, S. A., Vetterling, W. T., & Flannery, B. P. 1999, Numerical Recipes in Fortran 77, The art of Scientific Computing, 2nd edn. (Cambridge University press) [Google Scholar]
- Reynolds, C. S., Fabian, A. C., Nandra, K., et al. 1995, MNRAS, 277, 901 [NASA ADS] [Google Scholar]
- Sako, M., Kahn, S. M., Paerels, F., & Liedahl, D. A. 2000a, ApJ, 542, 684 [Google Scholar]
- Sako, M., Kahn, S. M., Paerels, F., & Liedahl, D. A. 2000b, ApJ, 543, L115 [NASA ADS] [CrossRef] [Google Scholar]
- Sambruna, R. M., Netzer, H., Kaspi, S., et al. 2001, ApJ, 546, 13 [Google Scholar]
- Schmitt, H. R., Donley, J. L., Antonucci, R. R. J., et al. 2003, ApJ, 597, 768 [NASA ADS] [CrossRef] [Google Scholar]
- Steenbrugge, K. C., Fenovcik, M., Kaastra, J. S., et al. 2009, A&A, 496, 107 [NASA ADS] [CrossRef] [EDP Sciences] [Google Scholar]
- Tarter, C. B., Tucker, W. H., & Salpeter, E. E. 1969, ApJ, 156, 943 [NASA ADS] [CrossRef] [Google Scholar]
- Uttley, P., McHardy, I. M., Papadakis, I. E., et al. 1999, Nucl. Phys. B, 69, 490 [Google Scholar]
- Uttley, P., Fruscione, A., McHardy, I., & Lamer, G. 2003, ApJ, 595, 656 [NASA ADS] [CrossRef] [Google Scholar]
- XMM-Newton Users Handbook 2009, ed. Ness J.-U., et al. [Google Scholar]
Footnotes
- ...Q
![[*]](/icons/foot_motif.png)
- The default energy range used by the Cloudy code to
evaluate the number of ionizing photons Q is
1 Ryd-
 Ryd, (Ferland et al. 1998).
- ... absorption
- As noted by Sako
et al. (2000 b) and Kinkhabwala
et al. (2002), the resonance line of the O VII
triplet could be also enhanced by photoexcitation. Note however that
this would also result in a boost of all the higher order resonance
transitions of the H-like and He-like ions (Ly-
 ,
Ly-
,
Ly- ,
He-
and He-),
but this enhancement is not currently observed.
,
He-
and He-),
but this enhancement is not currently observed.
- ... radius
- The torus inner edge has to be at a distance larger than
the dust sublimation radius
 .
In the particular case of NGC 4051, Krongold
et al. (2007) found
.
In the particular case of NGC 4051, Krongold
et al. (2007) found  pc.
pc.
All Tables
Table 1: Best-fit parameters for the transitions identified in the soft X-ray spectrum of NGC 4051.
Table 2: The same as in Table 1 but for the identified RRCs.
Table 3:
Intensities of the observed lines and of those simulated by Cloudy corresponding to the best-fit and normalized to the O VIII Ly-![]() flux (see text and Fig. 6 for more details).
flux (see text and Fig. 6 for more details).
Table 4: Best-fit parameters for the three components of the adopted Cloudy model used to fit the RGS data.
All Figures
|
|
Figure 1: Fluxed RGS spectrum of
NGC 4051 (low state). The first order spectra of the two RGS cameras
were combined and the resulting spectrum smoothed with a triangular
kernel. The identified lines are labeled with the corresponding ion
transition name and vertical dashed lines (the big dips at |
| Open with DEXTER | |
| In the text | |
|
|
Figure 2: Distribution of residual velocity for all lines in Table 1 with respect to the cosmological one. Note that the observed shifts are consistent with the cosmological ones, i.e. no outflow or inflow is observed. The solid line represents the Gaussian best-fit to the data. |
| Open with DEXTER | |
| In the text | |
|
|
Figure 3: Zoom around the O VII triplet lines in the low flux state. The emission lines correspond to the f, i and r components, respectively. Only an upper limit to the resonance line r can be obtained (see text). The solid line represents the best-fit obtained with a power law + Gaussian lines model (details in text). |
| Open with DEXTER | |
| In the text | |
|
|
Figure 4: SED used in the paper (solid line). For comparison we also give (dashed line) the SED given in Ogle et al. (2004). This was taken from the NED database and is likely to contain contamination from the hosting galaxy. |
| Open with DEXTER | |
| In the text | |
|
|
Figure 5: Comparison of a model with two emission components (solid line) with the observed RGS spectrum (zoom around the O VII triplet). |
| Open with DEXTER | |
| In the text | |
|
|
Figure 6:
Intensities of the observed (filled squares) and simulated (triangles)
lines corresponding to the best-fit and normalized to the O VIII Ly- |
| Open with DEXTER | |
| In the text | |
|
|
Figure 7: The 5-35 Å RGS 1 (red data points) and RGS 2 (black data points) spectra are shown together with the best-fit Cloudy model described in the text and corresponding to the physical parameters reported in Table 4. |
| Open with DEXTER | |
| In the text | |
|
|
Figure 8: The cartoon shows qualitatively the location of the X-ray emitting and absorbing material (see text for details). |
| Open with DEXTER | |
| In the text | |
Copyright ESO 2010
Current usage metrics show cumulative count of Article Views (full-text article views including HTML views, PDF and ePub downloads, according to the available data) and Abstracts Views on Vision4Press platform.
Data correspond to usage on the plateform after 2015. The current usage metrics is available 48-96 hours after online publication and is updated daily on week days.
Initial download of the metrics may take a while.