| Issue |
A&A
Volume 514, May 2010
|
|
|---|---|---|
| Article Number | A71 | |
| Number of page(s) | 12 | |
| Section | Cosmology (including clusters of galaxies) | |
| DOI | https://doi.org/10.1051/0004-6361/200913060 | |
| Published online | 21 May 2010 | |
The intracluster magnetic field power spectrum in Abell 665
V. Vacca1,2 - M. Murgia2,3 - F. Govoni2 - L. Feretti3 - G. Giovannini3,4 - E. Orrù5 - A. Bonafede3,4
1 - Dipartimento di Fisica,
Università degli studi di Cagliari, Cittadella Universitaria, 09042 Monserrato (CA), Italy
2 -
INAF - Osservatorio Astronomico di Cagliari,
Poggio dei Pini, Strada 54, 09012 Capoterra (CA), Italy
3 -
INAF - Istituto di Radioastronomia,
via Gobetti 101, 40129 Bologna, Italy
4 -
Dipartimento di Astronomia,
Univ. Bologna, via Ranzani 1, 40127 Bologna, Italy
5 -
Institute for Astro- and Particle Physics, University of Innsbruck, Technikerstr. 25, 6020 Innsbruck, Austria
Received 4 August 2009 / Accepted 30 December 2009
Abstract
Aims. The goal of this work is to investigate the power
spectrum of the magnetic field associated with the giant radio halo in
the galaxy cluster A665.
Methods. For this, we present new deep Very Large Array total
intensity and polarization observations at 1.4 GHz. We simulated
Gaussian random three-dimensional turbulent magnetic field models to
reproduce the observed radio halo emission. By comparing observed and
synthetic radio halo images we constrained the strength and structure
of the intracluster magnetic field. We assumed that the magnetic field
power spectrum is a power law with a Kolmogorov index and we imposed a
local equipartition of energy density between relativistic particles
and field.
Results. Under these assumptions, we find that the radio halo
emission in A665 is consistent with a central magnetic field strength
of about 1.3 ![]() G.
To explain the azimuthally averaged radio brightness profile, the
magnetic field energy density should decrease following the thermal gas
density, leading to an averaged magnetic field strength over the
central 1 Mpc3 of about 0.75
G.
To explain the azimuthally averaged radio brightness profile, the
magnetic field energy density should decrease following the thermal gas
density, leading to an averaged magnetic field strength over the
central 1 Mpc3 of about 0.75 ![]() G.
From the observed brightness fluctuations of the radio halo, we infer
that the outer scale of the magnetic field power spectrum is
G.
From the observed brightness fluctuations of the radio halo, we infer
that the outer scale of the magnetic field power spectrum is ![]() 450 kpc, and the corresponding magnetic field auto-correlation length is
450 kpc, and the corresponding magnetic field auto-correlation length is ![]() 100 kpc.
100 kpc.
Key words: galaxies: cluster: general - galaxies: cluster: individual: A665 - large-scale structure of Universe - magnetic fields
1 Introduction
In the hierarchical model of structure formation, clusters of galaxies undergo several merger events during their lifetimes. Shocks and the turbulence associated with a major cluster merger event are thought to accelerate particles and compress magnetic field in the intracluster medium (e.g. Roettiger et al. 1999).
Table 1: Details of the VLA observations of Abell 665.
The existence of relativistic particles and a
magnetic field is expected to lead to large-scale diffuse
emission, which is not associated with
individual host galaxies but is a general property of the intracluster medium.
Radio observations reveal the presence of sources known as halos.
Radio halos are faint (![]() 1
1 ![]() Jy arcsec-2 at 1.4 GHz),
steep-spectrum
Jy arcsec-2 at 1.4 GHz),
steep-spectrum![]() (
(
![]() )
synchrotron sources located at the center of galaxy clusters
(e.g. Feretti & Giovannini 2008; Ferrari et al. 2008).
As recently shown by Cassano et al. (2007) and Murgia et al. (2009), these diffuse radio sources can have quite different
length scales, but the largest halos are the most luminous, in such a way that all these sources may have
similar synchrotron emissivity.
)
synchrotron sources located at the center of galaxy clusters
(e.g. Feretti & Giovannini 2008; Ferrari et al. 2008).
As recently shown by Cassano et al. (2007) and Murgia et al. (2009), these diffuse radio sources can have quite different
length scales, but the largest halos are the most luminous, in such a way that all these sources may have
similar synchrotron emissivity.
About 30 radio halos nowadays are known, and all of them are found to be strictly related to intense merger activity (e.g. Schuecker et al. 2001; Buote 2001; Govoni et al. 2001). Indeed, the most luminous radio halos are mainly associated to hot and massive clusters. Cluster merger events are expected to release a significant amount of energy in the intracluster medium. This energy is injected on large spatial scales, and then turbulent cascades may be generated (e.g. Brunetti & Lazarian 2007).
In the past years, progress has been made by analyzing
the state of turbulence of the intracluster medium. Signature of turbulence
have been found by analyzing the gas pressure of the Coma cluster,
where the pressure fluctuations are consistent with a Kolmogorov power spectrum (Schuecker et al. 2004).
Turbulence in the intracluster medium has also been studied in the radio band through Faraday rotation
measures.
Recent results show that the magnetic field power spectrum
can be estimated if very detailed rotation-measure images
of cluster radio galaxies are available
(Enßlin & Vogt 2003; Murgia et al. 2004;
Vogt & Enßlin 2005; Govoni et al. 2006; Guidetti et al. 2008;
Laing et al. 2008). Typically, rotation measure images of cluster radio galaxies
permit investigating the fluctuations of the intracluster magnetic field
below a spatial scale of about
![]() kpc. On the other hand, radio halo
images reveal that the intracluster magnetic field is spread over Mpc scales.
Thus, it would be important to investigate the magnetic field turbulence
over such a large volume of space.
In fact, although radio halos are typically unpolarized, in
A2255 (Govoni et al. 2005) and MACS J0717.5+3745 (Bonafede et al. 2009),
a polarized signal associated to the radio halo has also been detected. These
observations indicate that, at least in these clusters, the intracluster magnetic
fields can be ordered on scales of a hundred kpc.
kpc. On the other hand, radio halo
images reveal that the intracluster magnetic field is spread over Mpc scales.
Thus, it would be important to investigate the magnetic field turbulence
over such a large volume of space.
In fact, although radio halos are typically unpolarized, in
A2255 (Govoni et al. 2005) and MACS J0717.5+3745 (Bonafede et al. 2009),
a polarized signal associated to the radio halo has also been detected. These
observations indicate that, at least in these clusters, the intracluster magnetic
fields can be ordered on scales of a hundred kpc.
In this paper we present a study of the magnetic field power spectrum in the galaxy cluster A665, which contains a known radio halo. Following Tribble (1991) and Murgia et al. (2004), we propose to study the cluster magnetic field strength and structure on the basis of the radio halo properties. Indeed, information on the cluster magnetic field can be derived from detailed images of the radio halo, since the halo brightness fluctuations and the polarization level are strictly related to the intracluster magnetic-field power spectrum. For example, lack of polarization and a smooth and regular surface brightness may indicate that the cluster magnetic field is tangled on smaller scales than the resolution of the radio images, while a disturbed radio morphology and the presence of polarization could be related to a magnetic field ordered on larger scales than the observing beam (Govoni et al. 2005).
We investigate the total intensity and the polarization properties of the A665 radio halo by means of a new deep VLA observation at 1.4 GHz in C configuration and previously published data at 1.4 GHz in D array (Giovannini & Feretti 2000). The power spectrum of the intracluster magnetic field fluctuations is constrained by comparing the data with the expectations of simulated random 3-dimensional magnetic field models characterized by different power spectra.
The structure of this paper is as follows. In Sect. 2 we give a brief description of the cluster of galaxies A665. In Sect. 3 we present the radio observations and describe the data reduction. In Sect. 4 we develop the magnetic field modeling. In Sect. 5 we report the simulation results and the radio halo analysis. In Sect. 6 we analyze the depolarization of the discrete radio sources. Finally, in Sect. 7 we summarize our conclusions.
Throughout this paper we adopted a ![]() CDM cosmology with H0=71 km s-1 Mpc-1,
CDM cosmology with H0=71 km s-1 Mpc-1,
![]() ,
and
,
and
![]() .
At the distance of A665 (
z = 0.1829, Gómez et al. 2000),
1
.
At the distance of A665 (
z = 0.1829, Gómez et al. 2000),
1
![]() corresponds to 3.04 kpc.
corresponds to 3.04 kpc.
2 The cluster of galaxies Abell 665
![\begin{figure}
\par\includegraphics[width=13.4cm]{fig1_13060.ps} \vspace*{1.5mm}
\vspace*{4mm}
\end{figure}](/articles/aa/full_html/2010/06/aa13060-09/img21.png)
|
Figure 1:
a) Total intensity radio contours of A665 at 1.4 GHz (VLA in D configuration) with an
FWHM of
|
| Open with DEXTER | |
The cluster of galaxies A665 is well known to contain an extended diffuse radio halo first observed
by Moffet & Birkinshaw (1989) and successively confirmed by Jones & Saunders (1996). At an angular resolution
of about 1![]() ,
the radio halo is asymmetric because it is elongated in the southeast-northwest direction (Giovannini &
Feretti 2000).
,
the radio halo is asymmetric because it is elongated in the southeast-northwest direction (Giovannini &
Feretti 2000).
The total halo flux density at 1.4 GHz is
![]() mJy, while at 0.327 GHz the flux
density is
mJy, while at 0.327 GHz the flux
density is ![]() mJy. This results in an averaged spectral index of
mJy. This results in an averaged spectral index of
![]() (Feretti et al. 2004). Like all clusters containing a radio halo, A665 shows signatures of a major merger.
Optical (e.g. Gómez et al. 2000) and X-ray (e.g. Hughes
& Birkinshaw 1994) studies have revealed a disturbed dynamical state.
(Feretti et al. 2004). Like all clusters containing a radio halo, A665 shows signatures of a major merger.
Optical (e.g. Gómez et al. 2000) and X-ray (e.g. Hughes
& Birkinshaw 1994) studies have revealed a disturbed dynamical state.
Chandra satellite data have provided a detailed gas temperature map revealing a shock region with a temperature jump from 8 keV to 15 keV, located near the southern boundary of the radio halo (Markevitch & Vikhlinin 2001; Govoni et al. 2004). The radio morphology seems to follow the X-ray elongation, trailing the shock wave direction. A spectral analysis of Chandra data by Million & Allen (2009) indicates the possibility of nonthermal (or quasi-thermal) X-ray emission, likely due to inverse Compton scatter between relativistic electrons responsible for radio halo emission and cosmic microwave background photons.
3 Radio observations and data reduction
We present a new deep, polarization sensitive, full-synthesis observation of A665 at 1.4 GHz obtained using the Very Large Array (VLA) in C configuration. The details of the observation are summarized in Table 1. The data reduced following standard procedures using the NRAO's Astronomical Image Processing System (AIPS) package.
The nearby phase calibrator 0834+555 was observed
over a wide range in parallactic angle
to separate the source polarization properties
from the feed parameters. The radio source 3C 286 was used both as
primary flux density calibrator and as reference for the absolute polarization angles.
Radio interferences were carefully excised, and several cycles of self-calibration and CLEAN were applied
to remove residual phase variations.
A circular beam of 15
![]() was used to restore
the final images of total intensity I and Stokes parameters
Q and U. Images of polarized intensity
was used to restore
the final images of total intensity I and Stokes parameters
Q and U. Images of polarized intensity
![]() (corrected for the positive bias)
and fractional polarization FPOL=P/I were derived from the I, Q, and U images.
The I image has an rms noise level of
(corrected for the positive bias)
and fractional polarization FPOL=P/I were derived from the I, Q, and U images.
The I image has an rms noise level of
![]()
![]() Jy/beam, while
the P image has an rms noise level of
Jy/beam, while
the P image has an rms noise level of
![]()
![]() Jy/beam.
Jy/beam.
In order to improve uv-coverage and sensitivity to the diffuse emission
but still keeping a good angular resolution, we combined the new C configuration data with
the D configuration data by Giovannini & Feretti (2000), see Table 1. The D configuration data were been calibrated in phase and amplitude
by using the sources 0841+708 and 3C 48, respectively.
A circular beam of 55
![]() was applied to restore
the final total intensity image I, which has a noise level of 60
was applied to restore
the final total intensity image I, which has a noise level of 60 ![]() Jy/beam. The combined C+D data were then self-calibrated
to produce a final total intensity image. This image was restored with a circular beam of 25
Jy/beam. The combined C+D data were then self-calibrated
to produce a final total intensity image. This image was restored with a circular beam of 25
![]() and has
a noise level of 45
and has
a noise level of 45 ![]() Jy/beam. Since the D configuration data were
not polarization sensitive, no Q and U images were produced with the combined
C+D data set. The total intensity images at different resolution of the radio emission in A665 are shown in Fig. 1.
Jy/beam. Since the D configuration data were
not polarization sensitive, no Q and U images were produced with the combined
C+D data set. The total intensity images at different resolution of the radio emission in A665 are shown in Fig. 1.
The central regions of the galaxy cluster are permeated by a low-surface brightness radio halo which is surrounded by many discrete radio sources. The full extent of the radio halo is readily visible in the D configuration image shown in Fig. 1a. However, the comparatively low resolution of this image does not permit easily distinguishing the contribution of the discrete radio sources from the diffuse radio halo.
The new C configuration image at a resolution of 15
![]() is shown in Fig. 1b.
Here we can clearly separate the halo emission from the discrete radio sources. In particular,
there are a few embedded sources in the central regions, and at least part of the
northwestern elongation of the halo seen at lower resolution comes from a blending of several
discrete sources distributed, in projection, along an arc-like structure.
At the sensitivity level of our C configuration observation, we did not detect polarized emission
from the radio halo. Since the innermost regions of the halo have an average brightness of
is shown in Fig. 1b.
Here we can clearly separate the halo emission from the discrete radio sources. In particular,
there are a few embedded sources in the central regions, and at least part of the
northwestern elongation of the halo seen at lower resolution comes from a blending of several
discrete sources distributed, in projection, along an arc-like structure.
At the sensitivity level of our C configuration observation, we did not detect polarized emission
from the radio halo. Since the innermost regions of the halo have an average brightness of ![]() 100
100 ![]() Jy/beam,
we can derive a 1
Jy/beam,
we can derive a 1![]() upper limit to the fractional polarization of
upper limit to the fractional polarization of
![]() .
The polarization of the discrete sources in the field of view is discussed in Sect. 6.
.
The polarization of the discrete sources in the field of view is discussed in Sect. 6.
Finally, in Fig. 1c we present the C+D configuration image at a resolution of 25
![]() (corresponding to 75 kpc at the cluster distance). The radio iso-contours
(corresponding to 75 kpc at the cluster distance). The radio iso-contours![]() are overlaid on the adaptively smoothed Chandra X-ray image in
the 0.8-4 keV band (Govoni et al. 2004). The X-ray and radio peaks do not overlap precisely.
The distance between them is about 45
are overlaid on the adaptively smoothed Chandra X-ray image in
the 0.8-4 keV band (Govoni et al. 2004). The X-ray and radio peaks do not overlap precisely.
The distance between them is about 45
![]() .
The radio halo emission peaks at
.
The radio halo emission peaks at
![]() and
and
![]() ,
while the X-ray peak coordinates are
,
while the X-ray peak coordinates are
![]() and
and
![]() .
.
4 Magnetic field modeling
The halo brightness fluctuations and the polarization level can be related to the intracluster magnetic-field power spectrum. Following the approaches proposed by Tribble (1991) and Murgia et al. (2004), we analyzed the radio images presented in the previous section to constrain the intracluster magnetic field in A665. We proceeded in two steps. First, we performed a 2-dimensional analysis to determine the radial scaling of the magnetic field, i.e. the average magnetic field strength at the cluster center and its radial decline. Second, we focused on the radio-halo total intensity and polarization fluctuations with respect to the average radial profiles to determine their power spectrum with the aid of 3-dimensional numerical simulations.
4.1 The radial scaling of the equipartition magnetic field strength
In the following 2-dimensional analysis, we want to infer the average magnetic field strength
at the cluster center and possibly its scaling with the thermal gas density (see also Murgia et al. 2009).
The observed radio halo intensity is directly related to the integral of
the magnetic field and relativistic particle distribution along the line-of-sight.
However, since the synchrotron emissivity traces the product of electron and
magnetic field energy densities, disentangling the two contributions is not
possible from radio observations alone.
In this work we assume that the electron energy spectrum is a power law of the
form
with the energy
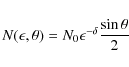
In Eq. (2) we took the isotropy of the electron population into account and we averaged over all the possible directions between the magnetic field and the line-of-sight, i.e. the field is supposed to be completely tangled on an infinitesimally small scale (for a more realistic model see Sect. 4.2). We furthermore assumed that the magnetic field strength scales as a function of the thermal gas density according to
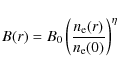
where B0 is the average magnetic field strength at the cluster center, while
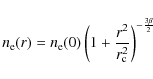
where
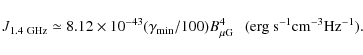
Under these hypotheses, the synchrotron emissivity scales as
Since radio halos are optically thin sources, the radio brightness profile results from the integral along the line-of-sight of the synchrotron emissivity in Eq. (5), which gives
where
In Fig. 2 we show the azimuthally averaged radio-halo
brightness profile obtained from the C+D configuration image at 25
![]() resolution. Each data point represents the
average brightness in concentric annuli of half beam width centered on the X-ray peak, as shown in the inset.
Discrete sources have been masked out and excluded from the statistics.
The observed brightness profile is traced down to a level
of 3
resolution. Each data point represents the
average brightness in concentric annuli of half beam width centered on the X-ray peak, as shown in the inset.
Discrete sources have been masked out and excluded from the statistics.
The observed brightness profile is traced down to a level
of 3
![]() and the best fit of the analytical model in Eq. (6) is showed.
The fit was performed in the image plane as described
in Murgia et al. (2009). To properly take the resolution into account, the
model in Eq. (6) was first calculated in a
2-dimensional image, with the same pixel size and field of view as that
observed, and then convolved with the same beam by means of a fast
Fourier transform. The resulting image is masked exactly in the same regions
as for the observations. Finally, the model is azimuthally averaged with the same
set of annuli as were used to obtain the observed radial profile. All these functions were
performed at each step during the fit procedure. As a result, the values of the central
brightness, I0, and the index
and the best fit of the analytical model in Eq. (6) is showed.
The fit was performed in the image plane as described
in Murgia et al. (2009). To properly take the resolution into account, the
model in Eq. (6) was first calculated in a
2-dimensional image, with the same pixel size and field of view as that
observed, and then convolved with the same beam by means of a fast
Fourier transform. The resulting image is masked exactly in the same regions
as for the observations. Finally, the model is azimuthally averaged with the same
set of annuli as were used to obtain the observed radial profile. All these functions were
performed at each step during the fit procedure. As a result, the values of the central
brightness, I0, and the index ![]() provided by the fit are deconvolved quantities, and
their estimate includes all the uncertainties related to the masked
regions and to the sampling of the radial profile in annuli of finite
width.
provided by the fit are deconvolved quantities, and
their estimate includes all the uncertainties related to the masked
regions and to the sampling of the radial profile in annuli of finite
width.
![\begin{figure}
\par\includegraphics[width=9cm,clip]{fig2_13060.ps}
\end{figure}](/articles/aa/full_html/2010/06/aa13060-09/img66.png)
|
Figure 2: Analytical fit to the observed radio-halo brightness radial profile. Each point represents the azimuthally averaged radio brightness at 1.4 GHz obtained in annuli, as shown in the inset. Discrete sources have been excluded from the statistics. The solid line represents the best fit of the magnetic field model described in the text. The dashed and dot-dashed lines are reference models, see text. |
| Open with DEXTER | |
The best fit of the analytical model yields a central brightness
of
I0=0.76+0.05-0.05 ![]() Jy/arcsec2 and
Jy/arcsec2 and
![]() ,
the corresponding equipartition
magnetic strength at the cluster center is
B0=1.58+0.04-0.04
,
the corresponding equipartition
magnetic strength at the cluster center is
B0=1.58+0.04-0.04 ![]() G. Indeed, the value of
G. Indeed, the value of ![]() we found is very close to the physical situation in which the magnetic field energy density scales as the
thermal gas density:
we found is very close to the physical situation in which the magnetic field energy density scales as the
thermal gas density:
![]() .
.
The brightness profile is very sensitive to the value of ![]() .
To show this, we
fixed the central brightness I0 and we also traced the models corresponding to
.
To show this, we
fixed the central brightness I0 and we also traced the models corresponding to ![]() (the magnetic field is frozen in
the thermal gas) and
(the magnetic field is frozen in
the thermal gas) and ![]() (magnetic field radially decreases according to thermal gas density). The two
cases are represented in Fig. 2, but these two profiles, however,
are too steep for the data.
(magnetic field radially decreases according to thermal gas density). The two
cases are represented in Fig. 2, but these two profiles, however,
are too steep for the data.
4.2 Numerical analysis of the magnetic field fluctuations
The analytic model presented in the previous section provides a good description of the azimuthally averaged
brightness radial profile.
However, significant deviations of the diffuse emission from circular symmetry are observed.
These fluctuations can be related to local fluctuations of the intracluster magnetic field strength and direction
around the average. We characterized the power spectrum of these fluctuations following the
3-dimensional numerical approaches proposed by Tribble (1991) and Murgia et al. (2004).
We simulated a multi-scale random magnetic field in a cubical box. We assumed that the power spectrum
of the magnetic field fluctuations is a power law with index n:

where the wave number k ranges from
![\begin{figure}
\par\includegraphics[width=14.5cm,clip]{fig3_13060.ps}
\end{figure}](/articles/aa/full_html/2010/06/aa13060-09/img77.png)
|
Figure 3:
Example of simulated radio halo. Left and right panels refer to the total and polarized intensity, respectively. Top panels: images at full resolution. Mid panels: images at 15
|
| Open with DEXTER | |
This 3-dimensional random magnetic field model is ``illuminated" with the relativistic
electron distribution in Eq. (1),
to produce total intensity and polarization synthetic images of the
radio halo.
The magnetic field fluctuates in strength and direction from pixel to
pixel in the grid.
The integration of the total intensity straightforward: the
contributions of the pixels in the computational grid are added
together by considering the angle between the local magnetic field
direction and the line-of-sight. Indeed, the total intensity at a given
direction is proportional to the integral along the line-of-sight of
the magnetic field projected on the plane of the sky, ![]() .
.
Table 2: Parameters adopted in the radio halo simulation.
The integration of the polarized intensity is not a simply scalar sum
because of two distinct effects. One is that
the magnetic field has random orientations, and the second is that the
radio wave polarization plane is subject to the Faraday rotation
as it traverses the magnetized intracluster medium. Therefore, the
integration of the polarized intensity is performed as a vectorial sum
in which the intrinsic polarization angle of the radiation coming in
from the pixels located at a depth L is rotated by an amount
where the rotation measure RM is given by
![\begin{displaymath}{\rm RM}_{\rm ~[rad/m^2]}=812\int_{0}^{L_{[{\rm kpc}]}}n_{{\rm e}~[{\rm cm}^{-3}]}B_{\parallel~[\mu G]}{\rm d}l.
\end{displaymath}](/articles/aa/full_html/2010/06/aa13060-09/img89.png)
Here
An example of synthetic A665 radio halo is shown in Fig. 3. A turbulent magnetic field
is simulated in a grid of 10243 pixels with a cell size of 1 kpc/pixel. The magnetic field has a Kolmogorov power spectrum
slope![]() n=11/3 and fluctuates in the range of spatial scales from
n=11/3 and fluctuates in the range of spatial scales from
![]() kpc and
kpc and
![]() kpc (where
kpc (where
![]() ). The central magnetic field strength is
). The central magnetic field strength is
![]()
![]() G and
G and ![]() .
The simulated magnetic field is periodic at
the grid boundaries, so the computational grid has been replicated to reproduce a
field of view of 20482 kpc2 around the galaxy cluster center. Left and right panels refer to the total and polarized intensity,
respectively. Top panels refer to the simulations at full resolution and show all the fine structure of the radio halo. The
expected theoretical fractional polarization for this power spectrum is about 24%.
Middle panels show the images convolved at 15
.
The simulated magnetic field is periodic at
the grid boundaries, so the computational grid has been replicated to reproduce a
field of view of 20482 kpc2 around the galaxy cluster center. Left and right panels refer to the total and polarized intensity,
respectively. Top panels refer to the simulations at full resolution and show all the fine structure of the radio halo. The
expected theoretical fractional polarization for this power spectrum is about 24%.
Middle panels show the images convolved at 15
![]() resolution.
The radio halo appears smoother and the fractional polarization is
reduced to about 7%. Finally, bottom panels show the synthetic
radio images with the same noise level as in the observations. In total
intensity, only the brightest central region of the radio halo are
visible, while in polarized intensity the halo emission falls below the
noise level. This example illustrates how radio halos can be
effectively polarized, but because of their faintness, detecting this
polarized signal is a very hard task with the current radio
interferometers.
resolution.
The radio halo appears smoother and the fractional polarization is
reduced to about 7%. Finally, bottom panels show the synthetic
radio images with the same noise level as in the observations. In total
intensity, only the brightest central region of the radio halo are
visible, while in polarized intensity the halo emission falls below the
noise level. This example illustrates how radio halos can be
effectively polarized, but because of their faintness, detecting this
polarized signal is a very hard task with the current radio
interferometers.
5 Simulations results
To constrain the power spectrum of the magnetic field fluctuations
in A665, we compared the synthetic radio halo images obtained through the numerical
procedure described in Sect. 4 and
the real radio images and polarization limits presented in Sect. 3.
Overall, the 3-dimensional magnetic field and relativistic electron models depend on the eight parameters listed in Table 2. For a power-law magnetic field power spectrum with a radial scaling, we have five parameters:
![]() ,
,
![]() ,
,
![]() ,
,
![]() ,
and n. As pointed out in Murgia et al. (2004),
there are a number of degeneracies between these parameters. In
particular, the most relevant to us is the degeneracies between
,
and n. As pointed out in Murgia et al. (2004),
there are a number of degeneracies between these parameters. In
particular, the most relevant to us is the degeneracies between
![]() and
and ![]() ,
along with the degeneracy between
,
along with the degeneracy between
![]() and n.
Different combinations of these parameters lead to similar radio halo
total intensity and polarization distributions. We decided to
concentrate our analysis on
and n.
Different combinations of these parameters lead to similar radio halo
total intensity and polarization distributions. We decided to
concentrate our analysis on
![]() (by fixing
(by fixing ![]() on the basis of the azimuthally averaged radial profile presented in Sect. 4.1) and on
on the basis of the azimuthally averaged radial profile presented in Sect. 4.1) and on
![]() (by fixing n=11/3 on the basis of the Kolmogorov theory for a turbulent medium).
Moreover, we fixed
(by fixing n=11/3 on the basis of the Kolmogorov theory for a turbulent medium).
Moreover, we fixed
![]() kpc, the minimum allowed by our computational grid. However, we note that a higher
kpc, the minimum allowed by our computational grid. However, we note that a higher
![]() has a negligible impact on the simulation results since, for a
Kolmogorov spectral index, most of the magnetic field power is on
larger scales. The random magnetic field is illuminated with a
population of relativistic electrons with Lorentz factors between
has a negligible impact on the simulation results since, for a
Kolmogorov spectral index, most of the magnetic field power is on
larger scales. The random magnetic field is illuminated with a
population of relativistic electrons with Lorentz factors between
![]() and
and
![]() .
The electrons spectrum is a power law
with index
.
The electrons spectrum is a power law
with index ![]() ,
according to the observed radio-halo spectral index
,
according to the observed radio-halo spectral index
![]() (see Sect. 2),
and its energy density is in local equipartition with the magnetic field energy density.
(see Sect. 2),
and its energy density is in local equipartition with the magnetic field energy density.
Because of the random nature of the intracluster magnetic field, the comparison between synthetic and
observed images requires several simulation runs with different seeds for each given couple of the fitting parameters
![]() and
and
![]() ,
this because the same set of the magnetic field power spectrum parameters
results in a different realization of the same synthetic halo. Indeed, we chose to simulate 10 equally spaced values
of the minimum wave number from
,
this because the same set of the magnetic field power spectrum parameters
results in a different realization of the same synthetic halo. Indeed, we chose to simulate 10 equally spaced values
of the minimum wave number from
![]() kpc-1 to
kpc-1 to
![]() kpc-1.
Correspondingly, the outer scale of the magnetic field fluctuations ranges from
kpc-1.
Correspondingly, the outer scale of the magnetic field fluctuations ranges from
![]() kpc
(the maximum allowed by our computational grid) down to
kpc
(the maximum allowed by our computational grid) down to
![]() kpc (i.e. very close to the linear
resolution of the radio images). For each value of
kpc (i.e. very close to the linear
resolution of the radio images). For each value of
![]() ,
we realized 10 more simulation runs, with different seeds,
in which we determined the value of
,
we realized 10 more simulation runs, with different seeds,
in which we determined the value of
![]() by fitting the synthetic radio halo brightness profile to the
observed one. Indeed, we realized a total of 100 simulations by running the FARADAY code (Murgia et al. 2004) in the
Cybersar-OAC computer cluster.
by fitting the synthetic radio halo brightness profile to the
observed one. Indeed, we realized a total of 100 simulations by running the FARADAY code (Murgia et al. 2004) in the
Cybersar-OAC computer cluster.
![\begin{figure}
\par\includegraphics[width=13.5cm,clip]{fig4_13060.ps}
\end{figure}](/articles/aa/full_html/2010/06/aa13060-09/img104.png)
|
Figure 4:
Observed a) and simulated b), c), d) surface brightness images, with FWHM of 25
|
| Open with DEXTER | |
In Fig. 4 we show the observed radio halo in total emission at 25
![]() resolution (panel a) along with
the synthetic radio-halo images corresponding to three different values
resolution (panel a) along with
the synthetic radio-halo images corresponding to three different values
![]() (panels b, c, and d).
The synthetic images have the same resolution and noise level as the observed one and were obtained with the
procedure described in Sect. 4.2. First glance, the synthetic images look quite similar to
the observed one in terms of total extension and average brightness.
In fact, the top panel of Fig. 4e shows that all three simulations
fit the total intensity radial profile remarkably well at 1.4 GHz of the observed A665 radio-halo image at
25
(panels b, c, and d).
The synthetic images have the same resolution and noise level as the observed one and were obtained with the
procedure described in Sect. 4.2. First glance, the synthetic images look quite similar to
the observed one in terms of total extension and average brightness.
In fact, the top panel of Fig. 4e shows that all three simulations
fit the total intensity radial profile remarkably well at 1.4 GHz of the observed A665 radio-halo image at
25
![]() resolution. The different lines in the bottom panel of Fig. 4e represent the simulated fractional
polarization at different radii from the cluster center as expected at 15
resolution. The different lines in the bottom panel of Fig. 4e represent the simulated fractional
polarization at different radii from the cluster center as expected at 15
![]() resolution before the noise is applied.
The model fractional polarization is consistent with the upper limits derived on the base of the VLA C configuration
observation presented in this work. The best-fit central magnetic field strength for the three simulations is
around
resolution before the noise is applied.
The model fractional polarization is consistent with the upper limits derived on the base of the VLA C configuration
observation presented in this work. The best-fit central magnetic field strength for the three simulations is
around
![]()
![]() G, in good agreement with the value found on the basis of the 2-dimensional
analytical fit in Sect. 4.1.
G, in good agreement with the value found on the basis of the 2-dimensional
analytical fit in Sect. 4.1.
Although the examples of the synthetic halos shown in Fig. 4 visually appear similar to the
observed halo, it is clear that, as
![]() increases and the magnetic field power approaches as larger scales,
the simulated radio halos change shape. In particular, when the outer scale of the magnetic field fluctuations
is close to the observing beam, the halo is smooth and rounded (Fig. 4d). Increasing
increases and the magnetic field power approaches as larger scales,
the simulated radio halos change shape. In particular, when the outer scale of the magnetic field fluctuations
is close to the observing beam, the halo is smooth and rounded (Fig. 4d). Increasing
![]() results in a much distorted radio halo morphology and in a significant offset of the radio halo peak from the
cluster centered (particularly evident in Fig. 4b). The simulated
clusters are centered on the observed X-ray peak.
results in a much distorted radio halo morphology and in a significant offset of the radio halo peak from the
cluster centered (particularly evident in Fig. 4b). The simulated
clusters are centered on the observed X-ray peak.
We indeed tried to evaluate quantitatively the value of
![]() ,
which best reproduce the observed
intensity fluctuations of the radio halo, as originally proposed time ago by Tribble (1991). To do this,
we analyzed the residual images obtained by fitting and then subtracting, the analytical model in Eq. (6) to both the simulated and the observed halo images. Since the analytical model has a perfect circular symmetry,
it is particular well-suited to highlighting the halo fluctuations around the average profile.
,
which best reproduce the observed
intensity fluctuations of the radio halo, as originally proposed time ago by Tribble (1991). To do this,
we analyzed the residual images obtained by fitting and then subtracting, the analytical model in Eq. (6) to both the simulated and the observed halo images. Since the analytical model has a perfect circular symmetry,
it is particular well-suited to highlighting the halo fluctuations around the average profile.
In the top panels of Fig. 5 we show residuals images corresponding to the images
shown in Fig. 4 with the total intensity iso-contours overlapped. The higher
![]() ,
the
higher the residual levels and the larger the fluctuation patches.
,
the
higher the residual levels and the larger the fluctuation patches.
In Fig. 5e the root-mean-square of the residual images, evaluated inside the inner ![]() 200 kpc from the cluster center, is plotted against
200 kpc from the cluster center, is plotted against
![]() .
The solid line and the shaded region represent the mean and
the standard deviation of the mean derived from the simulations, respectively. First of all, the
residuals approach the noise level as
.
The solid line and the shaded region represent the mean and
the standard deviation of the mean derived from the simulations, respectively. First of all, the
residuals approach the noise level as
![]() approaches the observing beam. This result implies that,
if
approaches the observing beam. This result implies that,
if
![]() is smaller than
is smaller than ![]() 100 kpc, the expected rms of the halo intensity fluctuations is already below the
noise level of the observations
100 kpc, the expected rms of the halo intensity fluctuations is already below the
noise level of the observations
![]()
![]() Jy/arcsec2. As the maximum scale of the intracluster magnetic field
power spectrum increases, the rms level
of the radio halo fluctuations increases, reaching a value as high as 0.15
Jy/arcsec2. As the maximum scale of the intracluster magnetic field
power spectrum increases, the rms level
of the radio halo fluctuations increases, reaching a value as high as 0.15 ![]() Jy/arcsec2 for
Jy/arcsec2 for
![]() kpc.
kpc.
By comparing the observed fluctuation rms level of 0.11 ![]() Jy/arcsec2 with the
simulated trend we estimate that the outer scale of the magnetic field fluctuations is
Jy/arcsec2 with the
simulated trend we estimate that the outer scale of the magnetic field fluctuations is
![]() kpc (i.e.
kpc (i.e.
![]() kpc-1).
In Fig. 5f the offset between the X-ray and radio peak is plotted against
kpc-1).
In Fig. 5f the offset between the X-ray and radio peak is plotted against
![]() .
This
indicator has a larger dispersion but is much more direct since it does not involve a specific handling of the observed and
simulated images. As observed in Fig. 4, the offset of the radio peak from the cluster center (here
assumed to be coincident with the X-ray peak) increases with
.
This
indicator has a larger dispersion but is much more direct since it does not involve a specific handling of the observed and
simulated images. As observed in Fig. 4, the offset of the radio peak from the cluster center (here
assumed to be coincident with the X-ray peak) increases with
![]() .
By comparing the observed
offset of 135 kpc with the simulated trend, it turns out that
.
By comparing the observed
offset of 135 kpc with the simulated trend, it turns out that
![]() should be about
should be about
![]() kpc in agreement
with the residual analysis.
kpc in agreement
with the residual analysis.
To summarize, the results of the 3-dimensional simulations indicate that the radio halo emission in A665 is
consistent with a central magnetic field strength of about 1.3 ![]() G.
To explain the azimuthally averaged radio brightness profile, the
magnetic field energy density should decrease following the thermal gas
density, leading to an averaged magnetic field strength over the
central 1 Mpc3
of about 0.75
G.
To explain the azimuthally averaged radio brightness profile, the
magnetic field energy density should decrease following the thermal gas
density, leading to an averaged magnetic field strength over the
central 1 Mpc3
of about 0.75 ![]() G. From the observed brightness fluctuations of the radio halo, we infer that the outer scale
of the magnetic field power spectrum is
G. From the observed brightness fluctuations of the radio halo, we infer that the outer scale
of the magnetic field power spectrum is ![]() 450 kpc, the corresponding magnetic field auto-correlation
length
450 kpc, the corresponding magnetic field auto-correlation
length![]() is
is
![]() 100 kpc.
100 kpc.
![\begin{figure}
\par\includegraphics[width=15.5cm,clip]{fig5_13060.ps}
\end{figure}](/articles/aa/full_html/2010/06/aa13060-09/img112.png)
|
Figure 5:
Observed a) and simulated b), c), d) residuals images, with FWHM of 25
|
| Open with DEXTER | |
6 The depolarization of discrete radio sources
![\begin{figure}
\par\includegraphics[width=15.5cm,clip]{fig6_13060.ps} \vspace*{2.8mm}
\end{figure}](/articles/aa/full_html/2010/06/aa13060-09/img113.png)
|
Figure 6:
Depolarization of the brightest discrete radio sources as a function of
the distance from the cluster center (marked by the cross). The upper
limits are at the |
| Open with DEXTER | |
In this section we investigate the effects of the intracluster magnetic
field in A665 on the polarization properties of the discrete radio
sources belonging to the cluster of galaxies itself or situated in
background to it (see Table 3).
In particular, it is expected that the radio sources whose emission crosses the central region of the cluster
suffer a higher Faraday rotation, hence a higher beam depolarization, with respect to the sources at
larger impact parameters (see e.g. Murgia et al. 2004). In the left panel of Fig. 6, we show a field of view of about
![]() around A665 taken
from a 15
around A665 taken
from a 15
![]() resolution image. All the discrete sources brighter than 500
resolution image. All the discrete sources brighter than 500 ![]() Jy/beam (20
Jy/beam (20
![]() )
are labeled.
This severe cut guarantees a maximum error on the fraction polarization of 0.03.
)
are labeled.
This severe cut guarantees a maximum error on the fraction polarization of 0.03.
For each of these sources we plotted the fractional polarization
against their distance from the cluster center (right panel of
Fig. 6). At large impact parameters,
![]() kpc, the observed
radio sources fractional polarization at 1.4 GHz and 15
kpc, the observed
radio sources fractional polarization at 1.4 GHz and 15
![]() resolution oscillates around 0.1. The plot also
shows a hint that the discrete source seen in projection close to the cluster center is more
depolarized.
resolution oscillates around 0.1. The plot also
shows a hint that the discrete source seen in projection close to the cluster center is more
depolarized.
The continuous line is the expected depolarization trend calculated on the basis of the best magnetic field model derived from the fit of the radio halo image (see Sect. 5). The dashed lines represent the dispersion of the model. The depolarization model assumes that all the considered sources are situated at the cluster mid-plane and that the intrinsic polarization is fully ordered. As intrinsic value we assumed the mean of the fractional polarization of the radio galaxies located at more than 2 Mpc from the cluster center.
Although the relatively large scatter of the data and the simplicity of the model prevent us from deriving other useful constraints to the magnetic field properties in A665, we note that the model prediction broadly agrees with the observed depolarization trend. Studies at possibly higher resolution and sensitivity are required to measure the fractional polarization for many more sources so that this method can be applied successfully.
Table 3: A665 radio galaxies used to study signal depolarization through intracluster medium.
7 Conclusions
In this work we presented a new deep VLA observation at 1.4 GHz of the cluster of galaxies A665. By combining this observation with a previous VLA observation at lower resolution, we studied the intracluster magnetic-field power spectrum by analyzing the radio halo brightness fluctuations, following both an original idea by Tribble (1991) and the numerical approach proposed by Murgia et al. (2004).
Our findings are summarized as follows. We simulated Gaussian random
three-dimensional turbulent magnetic-field models in order to reproduce
the observed radio halo emission. By comparing observed and synthetic
radio halo images, we constrained the strength and structure of the
intracluster magnetic field. We assumed that the magnetic field power
spectrum is a power law with a Kolmogorov index, and we imposed a local
equipartition of energy density between relativistic particles and the
magnetic field. Under these assumptions, we find that the radio halo
emission in A665 is consistent with a central magnetic field strength
of about 1.3 ![]() G.
To explain the azimuthally averaged radio brightness profile, the
magnetic field energy density should decrease following the thermal gas
density,
leading to an averaged magnetic field strength over the central 1 Mpc3 of about 0.75
G.
To explain the azimuthally averaged radio brightness profile, the
magnetic field energy density should decrease following the thermal gas
density,
leading to an averaged magnetic field strength over the central 1 Mpc3 of about 0.75 ![]() G. From the observed
brightness fluctuations of the radio halo, we inferred that the outer scale of the magnetic field power spectrum is
G. From the observed
brightness fluctuations of the radio halo, we inferred that the outer scale of the magnetic field power spectrum is ![]() 450 kpc, the corresponding magnetic field auto-correlation length is 100 kpc. We also
find a hint that the discrete source seen in projection close to the cluster center is more
depolarized. The best-fit magnetic model broadly agrees with the observed depolarization trend.
450 kpc, the corresponding magnetic field auto-correlation length is 100 kpc. We also
find a hint that the discrete source seen in projection close to the cluster center is more
depolarized. The best-fit magnetic model broadly agrees with the observed depolarization trend.
More tightening constraints could be potentially obtained by detecting the radio halo polarization fluctuations, not just total intensity fluctuations. In fact, the ratio of two former quantities, i.e. the fractional polarization, is a very robust indicator of the intracluster magnetic-field power spectrum, because it only marginally depends on the shape of the energy spectrum of the synchrotron electrons and on the equipartition assumption. Therefore, it would be very important to improve the sensitivity of the future observations in order to detect polarized signal in the most radio halos possible. This is a science case for the new generation of instruments in radio astronomy.
AcknowledgementsWe thank the referee for very helpful comments that led to improvements in this work. This work is part of the ``Cybersar'' Project, which is managed by the COSMOLAB Regional Consortium with the financial support of the Italian Ministry of University and Research (MUR), in the context of the ``Piano Operativo Nazionale Ricerca Scientifica, Sviluppo Tecnologico, Alta Formazione (PON 2000-2006)''. The research was partially supported by ASI-INAF I/088/06/0 - High Energy Astrophysics and PRIN-INAF2008. The National Radio Astronomy Observatory (NRAO) is a facility of the National Science Foundation, operated under cooperative agreement by Associated Universities, Inc. We are grateful to Antonietta Fara and Riccardo Pittau for their assistance with the Cybersar-OAC computer cluster.
References
- Beck, R., & Krause, M. 2005, Astron. Nachr., 326, 414 [NASA ADS] [CrossRef] [Google Scholar]
- Bonafede, A., Feretti, L., Giovannini, G., et al. 2009, A&A, 503, 707 [NASA ADS] [CrossRef] [EDP Sciences] [Google Scholar]
- Brunetti, G., Setti, G., & Comastri, A. 1997, A&A, 325, 898 [NASA ADS] [Google Scholar]
- Brunetti, G., & Lazarian, A. 2007, MNRAS, 378, 245 [NASA ADS] [CrossRef] [Google Scholar]
- Buote, D. A. 2001, ApJ, 553, L15 [NASA ADS] [CrossRef] [Google Scholar]
- Cassano, R., Brunetti, G., Setti, et al. 2007, MNRAS, 378, 1565 [NASA ADS] [CrossRef] [Google Scholar]
- Cavaliere, A., & Fusco-Femiano, R. 1976, A&A, 49, 137 [NASA ADS] [Google Scholar]
- Enßlin, T. A., & Vogt, C. 2003, A&A, 401, 835 [NASA ADS] [CrossRef] [EDP Sciences] [Google Scholar]
- Feretti, L., Orrù, E., Brunetti, G., et al. 2004, A&A, 423, 111 [NASA ADS] [CrossRef] [EDP Sciences] [Google Scholar]
- Feretti, L., & Giovannini, G. 2008, Lect. Notes Phys., 740, 143 [NASA ADS] [CrossRef] [Google Scholar]
- Ferrari, C., Govoni, F., Schindler, et al. 2008, Space Sci. Rev., 134, 93 [NASA ADS] [CrossRef] [Google Scholar]
- Giovannini, G., & Feretti, L. 2000, New Astron., 5, 335 [NASA ADS] [CrossRef] [Google Scholar]
- Gómez, P. L., Hughes, J. P., & Birkinshaw, M. 2000, ApJ, 540, 726 [NASA ADS] [CrossRef] [Google Scholar]
- Govoni, F., Enßlin, T. A., Feretti, L., & Giovannini, G. 2001, A&A, 369, 441 [NASA ADS] [CrossRef] [EDP Sciences] [Google Scholar]
- Govoni, F., Markevitch, M., Vikhlinin, A., et al. 2004, ApJ, 605, 695 [NASA ADS] [CrossRef] [Google Scholar]
- Govoni, F., Murgia, M., Feretti, L., et al. 2005, A&A, 430, L5 [NASA ADS] [CrossRef] [EDP Sciences] [Google Scholar]
- Govoni, F., Murgia, M., Feretti, L., et al. 2006, A&A, 460, 425 [NASA ADS] [CrossRef] [EDP Sciences] [Google Scholar]
- Guidetti, D., Murgia, M., Govoni, F., et al. 2008, A&A, 483, 699 [NASA ADS] [CrossRef] [EDP Sciences] [Google Scholar]
- Hughes, J. P., & Birkinshaw, M. 1994, Evolution of the Universe and its Observational Quest, 455 [Google Scholar]
- Jones, M., & Saunders, R. 1996, Roentgenstrahlung from the Universe, 553 [Google Scholar]
- Laing, R. A., Bridle, A. H., Parma, P., & Murgia, M. 2008, MNRAS, 391, 521 [NASA ADS] [CrossRef] [Google Scholar]
- Markevitch, M., & Vikhlinin, A. 2001, ApJ, 563, 95 [NASA ADS] [CrossRef] [Google Scholar]
- Million, E. T., & Allen, S. W. 2009, MNRAS, 399, 1307 [NASA ADS] [CrossRef] [Google Scholar]
- Moffet, A. T., & Birkinshaw, M. 1989, AJ, 98, 1148 [NASA ADS] [CrossRef] [Google Scholar]
- Murgia, M., Govoni, F., Feretti, L., et al. 2004, A&A, 424, 429 [NASA ADS] [CrossRef] [EDP Sciences] [Google Scholar]
- Murgia, M., Govoni, F., Markevitch, M., et al. 2009, A&A, 499, 679 [NASA ADS] [CrossRef] [EDP Sciences] [Google Scholar]
- Pacholczyk, A. G. 1970, Radio astrophysics. Nonthermal processes in galactic and extragalactic sources, Series of Books in Astronomy and Astrophysics (San Francisco: Freeman) [Google Scholar]
- Roettiger, K., Stone, J. M., & Burns, J. O. 1999, ApJ, 518, 594 [NASA ADS] [CrossRef] [Google Scholar]
- Roussel, H., Sadat, R., & Blanchard, A. 2000, A&A, 361, 429 [NASA ADS] [Google Scholar]
- Schuecker, P., Böhringer, H., Reiprich, T. H., & Feretti, L. 2001, A&A, 378, 408 [NASA ADS] [CrossRef] [EDP Sciences] [Google Scholar]
- Schuecker, P., Finoguenov, A., Miniati, F., et al. 2004, A&A, 426, 387 [NASA ADS] [CrossRef] [EDP Sciences] [Google Scholar]
- Tribble, P. C. 1991, MNRAS, 253, 147 [NASA ADS] [Google Scholar]
- Vogt, C., & Enßlin, T. A. 2005, A&A, 434, 67 [NASA ADS] [CrossRef] [EDP Sciences] [Google Scholar]
Footnotes
- ...
steep-spectrum
![[*]](/icons/foot_motif.png)
-
 .
.
- ... iso-contours
- The reader can refer to Fig. 4a for an alternative visualization with contours and color scale of the radio emission at 1.4 GHz.
- ...
condition
- The energy densities of the magnetic field, uB, and cosmic ray particles,
 ,
are exactly equal if the minimum energy condition is calculated by assuming a fixed energy range for the cosmic ray and
,
are exactly equal if the minimum energy condition is calculated by assuming a fixed energy range for the cosmic ray and
 ,
as early noted by Brunetti et al. (1997) and as we did in this work and in Murgia et al. (2009). If, instead, fixed frequency range is used one recovers the classical results that
,
as early noted by Brunetti et al. (1997) and as we did in this work and in Murgia et al. (2009). If, instead, fixed frequency range is used one recovers the classical results that
 (Pacholczyk 1970).
- ...
slope
- Throughout this paper the power spectra are expressed as vectorial forms in k-space.
The one-dimensional forms can be obtained by multiplying by
 and
and  the three and two-dimensional power
spectra respectively.
the three and two-dimensional power
spectra respectively.
- ...
length
- Following Enßlin & Vogt (2003), we define the magnetic field auto-correlation length as
(10)
All Tables
Table 1: Details of the VLA observations of Abell 665.
Table 2: Parameters adopted in the radio halo simulation.
Table 3: A665 radio galaxies used to study signal depolarization through intracluster medium.
All Figures
|
|
Figure 1:
a) Total intensity radio contours of A665 at 1.4 GHz (VLA in D configuration) with an
FWHM of
|
| Open with DEXTER | |
| In the text | |
|
|
Figure 2: Analytical fit to the observed radio-halo brightness radial profile. Each point represents the azimuthally averaged radio brightness at 1.4 GHz obtained in annuli, as shown in the inset. Discrete sources have been excluded from the statistics. The solid line represents the best fit of the magnetic field model described in the text. The dashed and dot-dashed lines are reference models, see text. |
| Open with DEXTER | |
| In the text | |
|
|
Figure 3:
Example of simulated radio halo. Left and right panels refer to the total and polarized intensity, respectively. Top panels: images at full resolution. Mid panels: images at 15
|
| Open with DEXTER | |
| In the text | |
|
|
Figure 4:
Observed a) and simulated b), c), d) surface brightness images, with FWHM of 25
|
| Open with DEXTER | |
| In the text | |
|
|
Figure 5:
Observed a) and simulated b), c), d) residuals images, with FWHM of 25
|
| Open with DEXTER | |
| In the text | |
|
|
Figure 6:
Depolarization of the brightest discrete radio sources as a function of
the distance from the cluster center (marked by the cross). The upper
limits are at the |
| Open with DEXTER | |
| In the text | |
Copyright ESO 2010
Current usage metrics show cumulative count of Article Views (full-text article views including HTML views, PDF and ePub downloads, according to the available data) and Abstracts Views on Vision4Press platform.
Data correspond to usage on the plateform after 2015. The current usage metrics is available 48-96 hours after online publication and is updated daily on week days.
Initial download of the metrics may take a while.