| Issue |
A&A
Volume 503, Number 2, August IV 2009
|
|
|---|---|---|
| Page(s) | 477 - 482 | |
| Section | Interstellar and circumstellar matter | |
| DOI | https://doi.org/10.1051/0004-6361/200912238 | |
| Published online | 23 June 2009 | |
The angular momentum of condensations within elephant trunks
V. Lora1 - A. C. Raga2 - A. Esquivel2
1 - Instituto de Astronomía, Universidad Nacional Autónoma de México, Ap. 70-468,
04510, D.F México
2 - Instituto de Ciencias Nucleares, Universidad Nacional Autónoma de México, Ap. 70-543,
04510, D.F México
Received 31 March 2009 / Accepted 22 May 2009
Abstract
Aims. The radiation from newly born stars photoevaporates their parental neutral cloud, leading to the formation of dense clumps that will eventually form stars.
Methods. We present 3D simulations of the interaction of a neutral cloud with an external ionising radiation field, and compute the angular momenta of these collapsing clumps.
Results. The angular momenta of these collapsing clumps show that they have preferential orientations mostly perpendicular to the direction of the incident ionising photon field. Therefore, the axes of the jet systems that will be eventually ejected (from the
![]()
![]() systems that will form) will be oriented approximately perpendicular to the direction to the photoionising source.
systems that will form) will be oriented approximately perpendicular to the direction to the photoionising source.
Key words: ISM: kinematics and dynamics - ISM: clouds - ISM: HII regions - stars: formation
1 Introduction
The radiation from newly born stars photoionises and erodes the parental cloud, producing structures such as the so-called elephant trunks. At the head of an elephant trunk, the interaction of the shock (driven by the photoevaporation process) with previously existing density perturbations leads to the formation of dense clumps. Some of these clumps might have enough mass to be self-gravitating, and will eventually form young stars that eject bipolar outflows. We describe observed examples of this kind of configuration.Bally & Reipurth (2003) discovered HH objects in the molecular cloud associated with the Pelican Nebula, including HH 555. This outflow emerges from the tip of a long elephant trunk, providing direct evidence of ongoing star formation in this region. The outflow axis of HH 555 is approximately perpendicular to the elephant trunk, which is aligned with the direction to the photoionising source.
Another example of this kind of configuration is the HH 666 outflow in
the Carina nebula. HH 666 also emerges from close to the tip
of an elephant trunk, and its axis is almost perpendicular to the
direction towards ![]() Carinae (Smith et al. 2004).
An HST image of this region (Bally et al. 2007),
shows a second jet emerging from a nearby elephant trunk, with
a direction almost parallel to the HH 666 outflow.
Carinae (Smith et al. 2004).
An HST image of this region (Bally et al. 2007),
shows a second jet emerging from a nearby elephant trunk, with
a direction almost parallel to the HH 666 outflow.
A final example is provided by HH 333. This jet emerges from the tip of an elephant trunk within the complex Trifid nebula (M20). It is a single-sided jet with measured radial velocities (Rosado et al. 1999) and proper motions (Yusef-Zadeh et al. 2005) that indicate it has the kinematical properties of a standard HH jet. Again HH 333 has an outflow direction approximately perpendicular to the direction to the ionising source.
Reach et al. (2009) presented observations of the elephant trunk of globule IC 1396A. They detected outflow activity from a number of young stars in the region. However, it is impossible to determine the outflow axes from these observations.
Even though the number of four outflows (two in the HH 666 region, see above) observed to be emerging from tips of elephant trunks is quite small, their alignment approximately perpendicular to the direction to the ionising photon source might be indicative of a systematic alignment. This alignment implies that the angular momenta of the low mass star+disk systems producing outflows from stellar sources in the tip of elephant trunks are more or less perpendicular to the direction of the ionising photon field (produced by the massive stars giving rise to the photoionised nebulae and elephant trunk structures). These angular momenta presumably preserve the direction of the rotation axes of the dense clumps that collapsed to form the outflow sources.
In the present paper, we explore the interaction between an ionising photon field and an environment with density perturbations. This interaction produces elongated structures reminiscent of elephant trunks, with dense, embedded clumps. In particular, we focus on whether or not these dense clumps have angular momenta preferentially oriented perpendicular to the direction towards the photoionising source.
Mellema et al. (2006) carried out 3D, radiation gasdynamic simulations of an H II region expanding in an ISM with power-law density perturbations. They find that this configuration naturally leads to the formation of dense, radially elongated structures, which resemble elephant trunks. Gahm et al. (2006) also study the role of magnetic fields in the formation of elephant trunks. Finally, Gritschneder et al. (2009) carried out a simulation of an initially plane ionising front travelling into a structured medium.
Our work emulates the approach of Mellema et al. (2006) and Gritschneder et al. (2009). We focus on a small region at the edge of an expanding H II region, and carry out a 3D radiation gasdynamic simulation (including the self-gravity of the gas) of the formation of a dense, neutral structure. We then identify high density clumps within this ``elephant trunk'', and compute their angular momenta. Finally, we study the mass distribution of the clumps, and the distributions of the orientation and magnitude of their angular momenta.
The paper is organized as follows. In Sect. 2, we describe the gasdynamic code and the parameters used for the numerical simulation. The results from the simulation and the clump statistics are presented in Sect. 3. Finally, our results are summarised in Sect. 4.
2 Code and settings
2.1 Code
We carried out a 3D simulation with a code that solves the 3D gasdynamic equations, the Poisson equation for the gravitational field, and a rate equation for neutral hydrogen, including the transfer of ionising photons at the Lyman limit. The gas is initially atomic, and the models do not consider the photodissociation of molecular material because of the presence of a FUV radiation field. This code was described by Raga et al. (2008).We modified the code of Raga et al. (2008) to include the ``two temperature'' equation of state described by Esquivel & Raga (2007, hereafter E07). This equation of state assigns temperatures between 10 K (for neutral gas) and 104 K (for gas with fully ionised H) with a linear dependence on the H ionisation fraction. Therefore, instead of solving an energy equation with the appropriate heating and cooling terms (see Raga et al. 2008), we replace it with this two-temperature equation of state. We also included the self-gravity of the gas. We use a successive over relaxation (SOR) method to solve the Poisson equation for the gravitational potential, and then include the gravitational force in the momentum and energy equations. We do not include a treatment of the diffuse, ionising photon field.
2.2 Settings
The computational domain has a size of
![]() cm
(along the x-, y-, and z-axes, respectively),
which is resolved with a uniform grid of
cm
(along the x-, y-, and z-axes, respectively),
which is resolved with a uniform grid of
![]() grid
points. We impose transmision boundaries in the x-direction and periodic
boundaries along the y and z-directions. The periodic conditions
are imposed in the gasdynamic equations, in Poisson's equation
(for the gravitational field), and in the radiative transfer equations.
grid
points. We impose transmision boundaries in the x-direction and periodic
boundaries along the y and z-directions. The periodic conditions
are imposed in the gasdynamic equations, in Poisson's equation
(for the gravitational field), and in the radiative transfer equations.
We start with an inhomogeneous density structure with a
power-law power-spectrum index of -11/3 (i.e.
![]() ,
where k is the wave-number), as described in Esquivel et al. (2003).
The initial density structure does not have any motion.
To simulate the edge of an H II region, the computational
domain is divided into two portions with a dividing line
at
,
where k is the wave-number), as described in Esquivel et al. (2003).
The initial density structure does not have any motion.
To simulate the edge of an H II region, the computational
domain is divided into two portions with a dividing line
at
![]() cm from the left edge of the domain.
The portion to the left is filled with an ionised medium (with a
temperature of
cm from the left edge of the domain.
The portion to the left is filled with an ionised medium (with a
temperature of
![]() ,
and the portion to the right
is filled with a neutral medium (with a temperature of
,
and the portion to the right
is filled with a neutral medium (with a temperature of
![]() ).
The average density in the neutral medium is a factor of 100 higher
than the one in the ionised medium, and the transition between the two
(also in terms of temperature and ionisation fraction) follows a
).
The average density in the neutral medium is a factor of 100 higher
than the one in the ionised medium, and the transition between the two
(also in terms of temperature and ionisation fraction) follows a ![]() profile with a width of
profile with a width of ![]() 10 pixels. The resulting neutral
structure has a mass of
10 pixels. The resulting neutral
structure has a mass of
![]() .
.
To calculate the gravitational field, we only consider the
gravitational force resulting from the density perturbations.
In other words, we subtract a density
![]() g cm-3(corresponding to the lower density regions in the initial
distribution of neutral material)
from the density used in Poisson's equation. In this way, we
avoid a generalized collapse of the dense slab structure that
fills the computational domain. We also run a simulation
in which the gravitational force was ``turned off''
to illustrate the effect of the self-gravity of the gas.
g cm-3(corresponding to the lower density regions in the initial
distribution of neutral material)
from the density used in Poisson's equation. In this way, we
avoid a generalized collapse of the dense slab structure that
fills the computational domain. We also run a simulation
in which the gravitational force was ``turned off''
to illustrate the effect of the self-gravity of the gas.
A plane-parallel ionising photon field
![]() cm2 s-1is incident on the computational
domain along the x-axis. This photon flux corresponds to a star
with an ionising photon rate
S*=1048 s-1, located at a distance
cm2 s-1is incident on the computational
domain along the x-axis. This photon flux corresponds to a star
with an ionising photon rate
S*=1048 s-1, located at a distance
![]() cm from the edge of the computational domain
in the -x direction.
cm from the edge of the computational domain
in the -x direction.
![\begin{figure}
\par\includegraphics[width=8cm]{12238fg1.eps}
\end{figure}](/articles/aa/full_html/2009/32/aa12238-09/img25.png) |
Figure 1: Time evolution of the xy mid-plane density stratification without self-gravity. The three frames are labeled with the corresponding elapsed times. The density stratifications are shown with the logarithmic greyscale given (in g cm-3) by the top right bar. In the three frames, we also show the contour corresponding to an H ionisation fraction of 50%, which indicates the position of the ionisation front. The x and y-axes are labeled in cm. |
| Open with DEXTER | |
![\begin{figure}
\par\includegraphics[width=8cm]{12238fg2.eps}
\end{figure}](/articles/aa/full_html/2009/32/aa12238-09/img26.png) |
Figure 2: Same as Fig. 1, but for the simulation that includes the self-gravity of the gas. |
| Open with DEXTER | |
| |
Figure 3: Number of neutral clumps as a function of time, obtained for three different density cuttoffs. The results correspond to the simulation that includes self-gravity (see Fig. 2). |
| Open with DEXTER | |
3 Results
We allowed the model to run from the initial conditions described in Sect. 2, to a t=200 kyr evolutionary time. Figure 1 shows the time evolution in the mid-plane density stratification without including the self gravity of the gas. Figure 2 shows the same simulation but adding the force that arises from self-gravity.From both figures, it is evident that the ionisation front becomes highly corrugated with dense condensations at the tip of a number of protruding ``fingers''. At t=100 kyr, the effect of self-gravity is only to produce denser condensations at the tip of the fingers. At t=200 kyr, however, the density structures obtained without (Fig. 1) and with self-gravity (Fig. 2) are quite different. In the self-gravitating simulation, a dense, central structure (detached from the ionisation front and absent in the non-gravitating simulation) is produced.
Given the important differences found when including self-gravity, we present an analysis of clump formation only for the flow obtained from the self-gravitating simulation. Interestingly, if one repeats the analysis for the non-gravitating simulation, similar results are found (these results are not shown in the present paper).
To quantify the number of clumps produced, we calculate following E07 the number of spatially connected neutral structures with
densities above a specified cutoff density
![]() .
In particular,
we choose cutoff values of
.
In particular,
we choose cutoff values of
![]() ,
10-18, 10-19and 10-20 g cm-3.
,
10-18, 10-19and 10-20 g cm-3.
The number of clumps (fragments) obtained for different density cutoffs, is shown as a function of time in Fig. 3. To determine the number of clumps, we consider time intervals of 20 kyr (corresponding to the width of the bins in the histograms of Fig. 3). We then calculate the number of clumps in 8 outputs within each of these time intervals, and then compute an average number of clumps for each time interval.
![\begin{figure}
\par\includegraphics[width=5cm]{12238fg4.eps}
\end{figure}](/articles/aa/full_html/2009/32/aa12238-09/img31.png) |
Figure 4:
Fraction of the clumps (obtained for a cutoff density
|
| Open with DEXTER | |
For the lowest cutoff density (
![]() ), the initial
density distribution has
), the initial
density distribution has ![]() 80 clumps, and the number of clumps
first decreases with time, stabilizes at
80 clumps, and the number of clumps
first decreases with time, stabilizes at ![]() 5 for 40<t<170 kyr,
and then continues to increase a little at t>170 kyr
(see Fig. 3). For the intermediate
cutoff density (
5 for 40<t<170 kyr,
and then continues to increase a little at t>170 kyr
(see Fig. 3). For the intermediate
cutoff density (
![]() ), the initial
distribution has
), the initial
distribution has ![]() 500 clumps and the number of clumps
first decreases and then remains approximately constant as a function
of time (with a value of
500 clumps and the number of clumps
first decreases and then remains approximately constant as a function
of time (with a value of ![]() 20).
20).
The initial density distribution has no clumps with densities above
the highest chosen cutoff density,
![]() g cm-3(see above). Interconnected structures of sufficiently density
only start to appear at
g cm-3(see above). Interconnected structures of sufficiently density
only start to appear at
![]() kyr, and their number grows
monotonically with time, stabilizing at a number of
kyr, and their number grows
monotonically with time, stabilizing at a number of ![]() 20 for
t>110 kyr (see Fig. 3). For each of the detected clumps, we first compute the position of the
centre of mass
20 for
t>110 kyr (see Fig. 3). For each of the detected clumps, we first compute the position of the
centre of mass
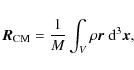
where V is the contiguous volume of the clump and
 |
(2) |
is its mass. We then compute the angular momentum with respect to the centre of mass of each clump
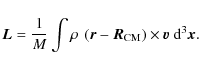
We assume that we observe the computed flow along the z-axis (i.e., that the xy-plane of the computational domain is parallel to the plane of the sky). The angle
(with
In Fig. 4, we show histograms indicating the fraction of clumps (obtained
for a cutoff density
![]() g cm-3)
with different orientations
g cm-3)
with different orientations ![]() ,
for the three different elapsed
times (t=95, 145, and 200 kyr). For early times, we find that
the
,
for the three different elapsed
times (t=95, 145, and 200 kyr). For early times, we find that
the ![]() values of the clumps are randomly distributed (between
values of the clumps are randomly distributed (between
![]() 40 and
40 and ![]() ). For t=200 kyr,
). For t=200 kyr, ![]() 36% of the clumps have
36% of the clumps have
![]() ,
and more than
,
and more than ![]()
![]() of the clumps have
of the clumps have
![]() .
From this result, we conclude that the
dense clumps being formed have angular momenta preferentially
aligned in directions perpendicular to the direction of the incident
ionising photon field (which is parallel to the x-axis).
.
From this result, we conclude that the
dense clumps being formed have angular momenta preferentially
aligned in directions perpendicular to the direction of the incident
ionising photon field (which is parallel to the x-axis).
The bottom panel of Fig. 5 shows the projected orientation ![]() of the
angular momentum as a function of clump mass for all of the
clumps obtained with the
of the
angular momentum as a function of clump mass for all of the
clumps obtained with the
![]() g cm-3cutoff density, for elapsed times t=95 and 200 kyr.
We see that at t=95 kyr most of the clumps (triangles)
have masses
g cm-3cutoff density, for elapsed times t=95 and 200 kyr.
We see that at t=95 kyr most of the clumps (triangles)
have masses
![]()
![]() and angular momenta
with all
and angular momenta
with all ![]() orientations.
For t=200 kyr (crosses, see bottom panel of Fig. 5), we see
that all of the clumps with 1
orientations.
For t=200 kyr (crosses, see bottom panel of Fig. 5), we see
that all of the clumps with 1
![]()
![]() have angular
momenta with orientation
angles
have angular
momenta with orientation
angles
![]() .
The lower mass clumps (with
.
The lower mass clumps (with
![]() )
have angular momenta with
more widely distributed orientations.
)
have angular momenta with
more widely distributed orientations.
![\begin{figure}
\par\includegraphics[width=6cm]{12238fg5.eps}
\end{figure}](/articles/aa/full_html/2009/32/aa12238-09/img53.png) |
Figure 5:
The top panel shows the specific angular momentum (L/M) of each clump
as a function of the clump's mass. The black line shows the angular momentum
associated with the outer orbit of an accretion disc radius of
|
| Open with DEXTER | |
![\begin{figure}
\par\includegraphics[width=5.5cm]{12238fg6.eps}
\end{figure}](/articles/aa/full_html/2009/32/aa12238-09/img54.png) |
Figure 6:
Time evolution in the most massive, neutral clump obtained
from the simulation with self-gravity (see Fig. 2).
The top panel shows the mass, and the central panel shows
the ratio of the clump mass to the Jeans mass as a function of time.
The bottom panel shows the time evolution in
orientation |
| Open with DEXTER | |
![\begin{figure}
\par\includegraphics[width=5.5cm]{12238fg7.eps}
\end{figure}](/articles/aa/full_html/2009/32/aa12238-09/img55.png) |
Figure 7:
Density stratification and flow field in a region
around the centre of mass of the most massive clump at t=200 kyr
(see Fig. 6). The top panel shows the flow on a xy-cut and the bottom
panel the flow on a xz-cut. The origin of the coordinate system
coincides with the centre of mass of the clump (obtained
with a
|
| Open with DEXTER | |
We now evaluate whether or not these specific angular momenta
have values comparable to those observed in young star systems.
Typical T Tauri stars have masses
![]() and
accretion disks with radii
and
accretion disks with radii
![]() AU. The outer Keplerian
orbit of the disk then has a specific angular momentum
AU. The outer Keplerian
orbit of the disk then has a specific angular momentum
![]() km2 s-1. This outer orbit
is determined by the material of the highest angular momentum
in the core from which the star+disk system was formed
(see, e.g., Ulrich 1976).
km2 s-1. This outer orbit
is determined by the material of the highest angular momentum
in the core from which the star+disk system was formed
(see, e.g., Ulrich 1976).
This value of
![]() is
shown with a horizontal line in the top panel of Fig. 5.
It is clear that many of the clumps formed in our
simulation have specific angular momenta that are
substantially higher than deduced from the
radius of disks around T Tauri stars. From this, we
conclude that the angular momenta of the clumps generated in our
simulation are substantial.
is
shown with a horizontal line in the top panel of Fig. 5.
It is clear that many of the clumps formed in our
simulation have specific angular momenta that are
substantially higher than deduced from the
radius of disks around T Tauri stars. From this, we
conclude that the angular momenta of the clumps generated in our
simulation are substantial.
A relevant question is whether the clumps obtained in our simulations
are resolved well enough for the calculations of angular momenta to
be meaningful. As an example, we consider the clumps found
for the
![]() g cm-3 cutoff
density at time t=200 kyr.
The lower mass clumps (see Fig. 5) of
g cm-3 cutoff
density at time t=200 kyr.
The lower mass clumps (see Fig. 5) of
![]()
![]() are resolved with
are resolved with ![]() 5 grid points. The clumps of
5 grid points. The clumps of
![]()
![]() are resolved with
are resolved with ![]() 50 grid points.
The clumps with 1<M<100
50 grid points.
The clumps with 1<M<100 ![]() are resolved with
are resolved with
![]() 500 to 5000 grid points. Therefore, for clumps with
M> 0.1
500 to 5000 grid points. Therefore, for clumps with
M> 0.1 ![]() ,
the resolution of the internal structure
of the clumps (with 50 grid points, corresponding to
,
the resolution of the internal structure
of the clumps (with 50 grid points, corresponding to
![]() 4 grid points along each axis) appears to be
appropriate for obtaining a meaningful estimate of the
angular momentum.
4 grid points along each axis) appears to be
appropriate for obtaining a meaningful estimate of the
angular momentum.
From the number of grid points ![]() within the clumps, we can
estimate the characteristic radii of the clumps to be
within the clumps, we can
estimate the characteristic radii of the clumps to be
![]() ,
where 0.012 pc is the resolution of the computational
cells in our numerical simulation. From the values of
,
where 0.012 pc is the resolution of the computational
cells in our numerical simulation. From the values of ![]() given
in the previous paragraph, we then see that the clumps obtained
from our simulation have characteristic radii
given
in the previous paragraph, we then see that the clumps obtained
from our simulation have characteristic radii
![]() ,
0.02,
0.05, and 0.1 pc, for clump masses of
,
0.02,
0.05, and 0.1 pc, for clump masses of
![]() ,
0.1, 1, and 100
,
0.1, 1, and 100 ![]() ,
respectively.
,
respectively.
Finally, we study the evolution in the most massive, neutral clump (detected
with
![]() g cm-3). As seen in Fig. 6,
this clump has a mass that
grows monotonically from 0.6
g cm-3). As seen in Fig. 6,
this clump has a mass that
grows monotonically from 0.6 ![]() at t=38 kyr, to 60
at t=38 kyr, to 60 ![]() at
t=200 kyr. The orientation angle
at
t=200 kyr. The orientation angle ![]() (on the plane
of the sky) of its angular momentum stabilizes rapidly at
(on the plane
of the sky) of its angular momentum stabilizes rapidly at
![]() for t>70 kyr.
for t>70 kyr.
We compute the Jeans mass of this clump to
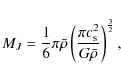 |
(5) |
(see, e.g., E07) where G is Newton's constant,
Figure 7 shows the density and flow velocity distributions in the
xy- and xz-planes, within a (
![]() cm)2 region centred
on the centre of mass of the most massive clump at t=200 kyr. In
the two cuts that are shown, we see that the region with
densities higher than the
cm)2 region centred
on the centre of mass of the most massive clump at t=200 kyr. In
the two cuts that are shown, we see that the region with
densities higher than the
![]() g cm-3density cutoff (which corresponds to a number density of
g cm-3density cutoff (which corresponds to a number density of
![]() cm-3) has a number of density maxima, none
of which coincides with the centre of mass of the structure.
The xz-plane (bottom panel) shows the velocity field that gives
rise to the angular momentum of the clump.
cm-3) has a number of density maxima, none
of which coincides with the centre of mass of the structure.
The xz-plane (bottom panel) shows the velocity field that gives
rise to the angular momentum of the clump.
4 Conclusions
We have presented the results of numerical simulations of a neutral structure
with power-law density perturbations that is photoevaporated by
an incident, plane-parallel, ionising photon field, with and without
the self gravity of the gas. In this interaction,
a number of dense, neutral clumps are produced. Our simulations
are similar to those presented by Gritschneder
et al. (2009). The main difference is that while they started
their simulations in a medium with turbulent motions, our simulations
begin in a stationary medium with density perturbations. In
our simulations, the velocity field that develops is therefore mainly
the result of the interaction with the ionising photon field. Defining
clumps as contiguous structures above a cutoff density
![]() ,
we compute the statistics of the number of clumps as a function of
elapsed time (for different values of
,
we compute the statistics of the number of clumps as a function of
elapsed time (for different values of
![]() ). We then fix
the cutoff density at
). We then fix
the cutoff density at
![]() g cm-3,
to focus on the denser clumps appearing at later elapsed times.
g cm-3,
to focus on the denser clumps appearing at later elapsed times.
For these clumps, we compute the vector angular momenta, from which we obtain the direction of the rotation axes (projected on the plane of the sky) and the specific angular momenta. We find that as a function of evolutionary time we obtain orientations that are aligned increasingly perpendicular to the direction of the incident, ionising photon field.
For the most massive clump, we find that it has a mass that increases across the range
![]() 0.6-60
0.6-60 ![]() (during the
(during the
![]() kyr period),
and that the orientation angle
kyr period),
and that the orientation angle ![]() of its angular momentum eventually
stabilizes at
of its angular momentum eventually
stabilizes at
![]() (i.e., the
direction perpendicular to the direction of the incident photon field). We use
an estimate of the Jeans mass of the clump to show that it is
Jeans unstable throughout the
(i.e., the
direction perpendicular to the direction of the incident photon field). We use
an estimate of the Jeans mass of the clump to show that it is
Jeans unstable throughout the
![]() kyr period. This timespan
is long enough for a low mass star to form within the most massive clump.
However, at the resolution of our simulation (with a grid spacing
of
kyr period. This timespan
is long enough for a low mass star to form within the most massive clump.
However, at the resolution of our simulation (with a grid spacing
of ![]() 800 AU), we naturally do not succeed in form
a star+disk system.
800 AU), we naturally do not succeed in form
a star+disk system.
If we analyse our non-gravitating simulation (see Fig. 1), we obtain qualitatively similar results. Regardless of whether we consider the self-gravity of the gas or not, we produce clumps with angular momenta preferentially aligned perpendicular to the direction of the incident ionising photon field. Even though it is impossible to provide a full explanation of this alignment, it is possible to provide a qualitative explanation. During the interaction of the ionising photon field with a perturbed density structure, a corrugated ionisation front is produced. This ionisation front pushes a shock into the neutral gas, producing a sheared velocity field that is preferentially aligned with the x-axis (i.e., with the direction of the ionising photon field). This sheared velocity field eventually produces vortical motions that are perpendicular to both the x-axis and the direction of the shear. This motion is seen in the xz-plane velocity field around the most massive clump in the t=200 kyr frame shown in the bottom frame of Fig. 7.
We have shown that the dense clumps that form as the result of the photoevaporation of a dense, neutral structure in the ISM have angular momenta preferentially aligned in a direction perpendicular to the external ionising photon field. This result provides a natural explanation of the orientations observed in the HH 555 (Bally & Reipurth 2003), HH 666 (Smith et al. 2004), and HH 333 (Rosado et al. 1999; Yusef-Zadeh et al. 2005) outflows, which emerge from elephant trunks in directions approximately perpendicular to the body of the trunks. Future observations of HH flows emerging from externally photoionised, neutral structures will show whether or not this kind of orientation is a general property of these outflows.
We note again that we have simulated an ionisation front travelling into an initially steady, neutral medium with density perturbations. In this way, our simulations follow the dynamics produced by the propagating ionisation front and associated shock waves, which result in the production of clumps with angular momenta preferentially aligned perpendicular to the direction of the ionising photon source. In the real ISM, a medium with density perturbations also has associated motions, and an initial vorticity field that will influence the angular momenta of clumps that might form (e.g., in the interaction with an ionisation front). If the initial vorticity field is strong enough, it will probably hide the effect of the vorticity generated by the shocks associated with the ionisation front, and the angular momentum alignment effect described in this paper will not be present.
An evaluation of whether or not the vorticity generated
by the ionisation front will be hidden by the initial vorticity field
of the cloud (present before the perturbations associated with the
approaching ionisation front) can be completed on the basis of observations
of the rotation of dense clumps in molecular clouds. For example,
Ohashi et al. (1997) observed the kinematics of a number of NH3 cores
in IRAS 04169+2702 and computed their specific angular momenta. They
find that cores with radii in the
![]() pc range have specific angular
momenta
pc range have specific angular
momenta
![]() km2 s-1 (clumps
with larger radii having specific angular momenta up to an order
of magnitude higher for a
km2 s-1 (clumps
with larger radii having specific angular momenta up to an order
of magnitude higher for a ![]() 1 pc clump radius).
1 pc clump radius).
In our simulation, the clumps with radii in the
![]() pc
range (corresponding to clump masses in the
pc
range (corresponding to clump masses in the
![]()
![]() range,
see Sect. 3), have angular momenta
range,
see Sect. 3), have angular momenta
![]() km2 s-1 (see Fig. 5). Therefore, our clumps have angular momenta
with values ranging from the lower L/M values of the cores observed
by Ohashi et al. (1997), up to a factor of
km2 s-1 (see Fig. 5). Therefore, our clumps have angular momenta
with values ranging from the lower L/M values of the cores observed
by Ohashi et al. (1997), up to a factor of ![]() 10 times higher
than the observed values. This result indicates that if the initial
specific vorticity of the structure in the cloud were comparable to
that of IRAS 04169+2702, the passage of an ionisation front
would generate clumps of considerably higher specific vorticity,
and therefore the angular momentum alignment effect described in this
paper would indeed be present (at least for the more massive, higher
angular momentum clumps).
10 times higher
than the observed values. This result indicates that if the initial
specific vorticity of the structure in the cloud were comparable to
that of IRAS 04169+2702, the passage of an ionisation front
would generate clumps of considerably higher specific vorticity,
and therefore the angular momentum alignment effect described in this
paper would indeed be present (at least for the more massive, higher
angular momentum clumps).
As a final point, we note that in the simulations presented
in this paper we consider only the photoionisation of a neutral structure.
In the case of the interaction of the radiation of an O star with
a molecular cloud, it is unavoidable that the region outside the
ionisation front will be affected by the FUV radiation from the star,
which at least partially photodissociates theinitially molecular
material. Gorti & Hollenbach (2002) computed models of the
photodissociation of dense clumps, and concluded that clumps
with central column densities <
![]() cm-2(for an assumed cold-to-dissociated gas sound speed ratio of
cm-2(for an assumed cold-to-dissociated gas sound speed ratio of ![]() 1/3)
will be rapidly photodissociated, and disappear as local density
enhancements. In our simulations, the clumps that are produced
have central column densities of
1/3)
will be rapidly photodissociated, and disappear as local density
enhancements. In our simulations, the clumps that are produced
have central column densities of ![]()
![]() cm-2 for clump masses of 0.01, 0.1, 1, and 100
cm-2 for clump masses of 0.01, 0.1, 1, and 100 ![]() ,
respectively (these
central column densities are estimated by multiplying the clump radii
given in Sect. 3 by the cutoff density of
,
respectively (these
central column densities are estimated by multiplying the clump radii
given in Sect. 3 by the cutoff density of ![]()
![]() cm-3).
Therefore, in all cases the clumps have high enough column densities
to avoid their dissipation by the incident FUV field.
cm-3).
Therefore, in all cases the clumps have high enough column densities
to avoid their dissipation by the incident FUV field.
From the results of Gorti & Hollenbach (2002), we therefore conclude that the photodissociation caused by the FUV field will not destroy the clumps produced in our simulations. However, the early evolution of the flow (in which high density structures have not yet formed) might indeed be modified by the presence of a FUV field. It will therefore be interesting to carry out a future exploration of the formation of clumps within elephant trunks in the presence of both a photodissociating and a photoionising photon field.
Acknowledgements
We acknowledge support from the CONACyT grant 61547. V.L. acknowledges the CONACyT scholarship 194595 and Stu group. We thank an anonymous referee for helpful suggestions. We thank Malcolm Walmsley for pointing out that the observations of angular momenta of cores are relevant for the present work (giving rise to the four last paragraphs of Sect. 4).
References
- Bally, J., & Reipurth, B. 2003, AJ, 126, 893 [NASA ADS] [CrossRef] (In the text)
- Bally, J., Reipurth, B., & Davis, C. J. 2007, Protostars and Planets V, ed. B. Reipurth, D. Jewitt, & K. Keil (Univ. of Arizona Press), 215 (In the text)
- Esquivel, A., & Raga, A. C. 2007, MNRAS, 377, 383 [NASA ADS] [CrossRef] (E07) (In the text)
- Esquivel, A., Lazarian, A., Pogosyan, D., & Cho, J. 2003, MNRAS, 342, 325 [NASA ADS] [CrossRef] (In the text)
- Gahm, G. F., Carlqvist, P., Johansson, L. B., & Nikolic, S. 2006, A&A, 454, 201 [NASA ADS] [CrossRef] [EDP Sciences] (In the text)
- Gorti, U., & Hollenbach, D. 2002, ApJ, 573, 215 [NASA ADS] [CrossRef] (In the text)
- Gritschneder, M., Naab, T., Walch, S., Burkert, A., & Heitsch, F. 2009, ApJ, 694, L26 [NASA ADS] [CrossRef] (In the text)
- Mellema, G., Arthur, S. J., Henney, W. J., et al. 2006, ApJ, 647, 397 [NASA ADS] [CrossRef] (In the text)
- Ohashi, N., Hayashi, M., Ho, P. T. P., et al. 1997, ApJ, 488, 317 [NASA ADS] [CrossRef] (In the text)
- Raga, A. C., Henney, W., Vasconcelos, J., et al. 2008, MNRAS, in press (In the text)
- Reach, W. T., Faied, D., Rho, J., et al. 2009, ApJ, 690, 683 [NASA ADS] [CrossRef] (In the text)
- Rosado, M., Esteban, C., Lefloch, B., Cernicharo, J., & García López, R. J. 1999, AJ, 118, 2962 [NASA ADS] [CrossRef] (In the text)
- Smith, N., Bally, J., & Brooks, K. 2003, AJ, 127, 2793 [NASA ADS] [CrossRef]
- Ulrich, R. K. 1976, ApJ, 210, 377 [NASA ADS] [CrossRef] (In the text)
- Yusef-Zadeh, F., Biretta, J., & Wardle, M. 2005, ApJ, 624, 246 [NASA ADS] [CrossRef] (In the text)
All Figures
| |
Figure 1: Time evolution of the xy mid-plane density stratification without self-gravity. The three frames are labeled with the corresponding elapsed times. The density stratifications are shown with the logarithmic greyscale given (in g cm-3) by the top right bar. In the three frames, we also show the contour corresponding to an H ionisation fraction of 50%, which indicates the position of the ionisation front. The x and y-axes are labeled in cm. |
| Open with DEXTER | |
| In the text | |
| |
Figure 2: Same as Fig. 1, but for the simulation that includes the self-gravity of the gas. |
| Open with DEXTER | |
| In the text | |
| |
Figure 3: Number of neutral clumps as a function of time, obtained for three different density cuttoffs. The results correspond to the simulation that includes self-gravity (see Fig. 2). |
| Open with DEXTER | |
| In the text | |
| |
Figure 4:
Fraction of the clumps (obtained for a cutoff density
|
| Open with DEXTER | |
| In the text | |
| |
Figure 5:
The top panel shows the specific angular momentum (L/M) of each clump
as a function of the clump's mass. The black line shows the angular momentum
associated with the outer orbit of an accretion disc radius of
|
| Open with DEXTER | |
| In the text | |
| |
Figure 6:
Time evolution in the most massive, neutral clump obtained
from the simulation with self-gravity (see Fig. 2).
The top panel shows the mass, and the central panel shows
the ratio of the clump mass to the Jeans mass as a function of time.
The bottom panel shows the time evolution in
orientation |
| Open with DEXTER | |
| In the text | |
| |
Figure 7:
Density stratification and flow field in a region
around the centre of mass of the most massive clump at t=200 kyr
(see Fig. 6). The top panel shows the flow on a xy-cut and the bottom
panel the flow on a xz-cut. The origin of the coordinate system
coincides with the centre of mass of the clump (obtained
with a
|
| Open with DEXTER | |
| In the text | |
Copyright ESO 2009
Current usage metrics show cumulative count of Article Views (full-text article views including HTML views, PDF and ePub downloads, according to the available data) and Abstracts Views on Vision4Press platform.
Data correspond to usage on the plateform after 2015. The current usage metrics is available 48-96 hours after online publication and is updated daily on week days.
Initial download of the metrics may take a while.