| Issue |
A&A
Volume 504, Number 3, September IV 2009
|
|
|---|---|---|
| Page(s) | 1011 - 1019 | |
| Section | Stellar atmospheres | |
| DOI | https://doi.org/10.1051/0004-6361/200912038 | |
| Published online | 22 July 2009 | |
Lithium and magnetic fields in giant stars
HD 232 862: a magnetic and lithium-rich
giant![[*]](/icons/foot_motif.png)
A. Lèbre1 - A. Palacios1 - J. D. do Nascimento Jr.2 - R. Konstantinova-Antova3 - D. Kolev3 - M. Aurière4 - P. de Laverny5 - J. R. De Medeiros2
1 - Groupe de Recherche en Astronomie et Astrophysique du
Languedoc, UMR5024, Université Montpellier II, CNRS, Place E.
Bataillon, 34095 Montpellier, France
2 - Departamento de
Física, Universidade Federal do Rio
Grande do Norte, 59072-970
Natal, RN, Brazil
3 -
Institute of Astronomy, Bulgarian Academy of Sciences,
72 Tsarigradsko shose, 1784 Sofia, Bulgaria
4 -
Laboratoire d'Astrophysique de Toulouse-Tarbes, Université de Toulouse,
CNRS, Observatoire Midi-Pyrénées, 57 avenue d'Azereix, 65008 Tarbes, France
5 -
Cassiopée UMR 6202,
Université de Nice Sophia Antipolis, CNRS,
Observatoire de la Côte d'Azur,
BP 4229, 06304 Nice, France
Received 11 March 2009 / Accepted 29 June 2009
Abstract
Aims. We report the detection of an unusually high lithium content in HD 232 862, a field giant classified as a G8II star, and hosting a magnetic field.
Methods. With the spectropolarimeters ESPaDOnS at CFHT and NARVAL at TBL, we collected high resolution and high signal-to-noise spectra of three giants: HD 232 862, KU Peg and HD 21 018. From spectral synthesis we inferred stellar parameters and measured lithium abundances that we compared to predictions from evolutionary models.
We also analysed Stokes V signatures, looking for a magnetic field on these giants.
Results. HD 232 862, presents a very high abundance of lithium (
ALi = 2.45 ![]() 0.25 dex), far in excess of the theoretically value expected at this spectral type and for this luminosity class (i.e., G8II). The evolutionary stage of HD 232 862 was determined, and it suggests a mass in the lower part of the [1.0 M
0.25 dex), far in excess of the theoretically value expected at this spectral type and for this luminosity class (i.e., G8II). The evolutionary stage of HD 232 862 was determined, and it suggests a mass in the lower part of the [1.0 M![]() , 3.5 M
, 3.5 M![]() ] mass interval, likely 1.5-2.0 M
] mass interval, likely 1.5-2.0 M![]() , at the bottom of the red giant branch. Also, a time variable Stokes V signature was detected in the data of HD 232 862 and KU Peg, pointing to the presence of a magnetic field at the surface of these two rapidly rotating active stars.
, at the bottom of the red giant branch. Also, a time variable Stokes V signature was detected in the data of HD 232 862 and KU Peg, pointing to the presence of a magnetic field at the surface of these two rapidly rotating active stars.
Key words: stars: abundances - stars: evolution - stars: magnetic fields - stars: individual: HD 232 862 - stars: individual: KU Peg
1 Introduction
Lithium-rich giant stars represent a puzzle for stellar astrophysics. They are essentially late G or K type stars with Li abundances far in excess with respect to the values predicted by standard theory. In standard theory, the fragile element lithium is expected to be destroyed in all but the outermost layers of a main sequence (MS) star. On the ascent of the red giant branch (RGB), the convective envelope deepens (in mass) during the so-called first dredge-up episode. The preserved lithium of the envelope is then diluted into deeper Li-free regions, reducing its surface abundance by a large factor (Iben 1965,1966a,b,1991).
The discovery by Wallerstein & Sneden (1982) of the first K giant with a nearly cosmic Li abundance ( ALi = 3.0 dex) has challenged the standard scenario of Li dilution along stellar evolution. Since then, an increasing number of such stars has appeared in the literature (e.g., Brown et al. 1989; Gratton & D'Antona 1989; de la Reza et al. 1996; Kraft et al. 1999; Reddy & Lambert 2005; Monaco & Bonifacio 2008; Roederer et al. 2008). Although most of these Li-rich giants were found to be slow rotators (De Medeiros et al. 1996a,b), the report of moderate to fast rotating Li-rich giants (i.e., with vsin i > 8 km s-1; Fekel & Balachandra 1993; Fekel et al. 1996; Drake et al. 2002; Reddy et al. 2002; de Laverny et al. 2003) points to a link between rotation and high Li content (de Laverny et al. 2003).
The Li-rich phenomenon has been observed in very few (less than 5%) red giant stars in the field, in globular and open clusters (Charbonnel & Balachandran 2000; Hill & Pasquini 2000; Pilachowski et al. 2000), and it has thus been suggested to be associated with a very short-lived episode of surface Li enrichment. The root cause for this enrichment has been hypothesized following two main directions. The first one concerns external processes, like the contamination of the upper layers of the star by the debris of nova ejecta or by the accretion of material in the form of planets or a brown dwarf (Alexander 1967; Brown et al. 1989; Gratton & D'Antona 1989; Siess & Livio 1999; Denissenkov & Weiss 2000; Reddy et al. 2002). The second one is related to internal processes, either preserving the initial Li from being completely diluted during the first dredge-up, or leading to the production of fresh lithium via the Cameron & Fowler (1971) mechanism (Fekel & Balachandran 1993; de la Reza et al. 1996; Sackmann & Boothroyd 1999; Charbonnel & Balachandran 2000; Palacios et al. 2001).
This last scenario appears to be the most favoured by the additional abundance constraints available for the Li-rich giants concerning boron and beryllium that are not enhanced contrary to what would be expected if Li enrichment was due to planet or brown dwarfs being engulfed (see Castilho et al. 1999; Melo et al. 2005; de la Reza 2006). Charbonnel & Balachandran (2000) have identified the evolutionary status of low-mass Li-rich giants, and after discarding those undergoing Li dilution via the first dredge-up episode, these peculiar stars lie at the RGB bump. They all present a normal carbon isotopic ratio, contrary to stars beyond the bump which usually (96% of them) present over-depleted 12C and low 12C/13C. These authors suggest that the small statistics of Li-rich objects and their precise location at the bump indicate a short-lived production episode occurring at the point where the mean molecular-weight barrier separating the convective envelope from the hydrogen-burning shell (HBS) is erased.
Another puzzling aspect concerns the class of luminosity of these Li-rich stars, essentially giants of luminosity class III. To date, there is no clear report of Li-rich stars among the field subgiants, namely the luminosity class IV stars (De Medeiros et al. 1997; Lèbre et al. 1999; Randich et al. 1999). In open clusters however, Canto Martins et al. (2006) have reported the detection of an exceptionally high Li abundance for a binary subgiant in M67. They have explored two hypotheses to explain such a high Li content: binarity and related tidal effects on one hand, and atomic diffusion on another hand. Among the field bright giant stars, namely the luminosity class II stars, there is also no clear report of Li-rich objects (Luck & Wepfer 1995; Lèbre et al. 2006).
In this paper, we report on spectropolarimetric observations of three late-G type field giants: HD 232 862, KU Peg (= HD 218 153) and HD 21 018. Sample stars and observational data are described in Sect. 2. Our initial aim was to investigate lithium abundance in these objects. The methodology we used to derive stellar parameters and to measure Li abundance is described in Sect. 3. However, the use of instruments such as spectropolarimeters also enabled us to explore the presence of surface magnetic fields. In Sect. 4, we describe the first direct detections of a magnetic field at the surfaces of HD 232 862 and KU Peg. In Sect. 5, the lithium content is discussed, considering the evolutionary status of the objects. Our conclusions are presented in Sect. 6.
2 Sample stars and observational data
2.1 HD 232 862
In the SIMBAD database, HD 232 862 is presented as a star with a
G8 spectral type and a luminosity class II, namely a bright giant
star, with a mass range from about 2.5 to 9 M![]() . Very few
publications have been devoted to this object, and among them
several deal with its binary status (see Sect. 2.4). Among
the few available measurements, one can only find IUE spectra, and
photometric and CORAVEL data. Unfortunately no Hipparcos parallax
is available for this star.
. Very few
publications have been devoted to this object, and among them
several deal with its binary status (see Sect. 2.4). Among
the few available measurements, one can only find IUE spectra, and
photometric and CORAVEL data. Unfortunately no Hipparcos parallax
is available for this star.
Photometric observations of HD 232 862 were carried out with the
computer-controlled single-channel electrophotometer at the 60 cm
Cassegrain telescope at the Belogradchik Observatory (Bulgaria),
during five nights (February 21 & 22, 1998 and January 5-7,
1999). The equipment is described by Antov & Konstantinova-Antova
(1995). From these five nights of measurements, the
following mean UBV estimations were obtained:
B - V = 0.87 ![]() 0.02; U - B = 0.41
0.02; U - B = 0.41 ![]() 0.05;
V = 9.60
0.05;
V = 9.60 ![]() 0.04. Because the two components of this binary
system (see Sect. 2.3) were likely in the diaphragm of the
electrophotometer, the U - B index is bluer than expected for a
G8III or a G8II star (U - B = 0.69, for a G8III star). From these
photometric data, we have estimated the effective temperature from
the
Teff - B - V calibration by Flower (1996). As a
first guess to compute synthetic spectra (see Sect. 3),
we have used
Teff = 5120
0.04. Because the two components of this binary
system (see Sect. 2.3) were likely in the diaphragm of the
electrophotometer, the U - B index is bluer than expected for a
G8III or a G8II star (U - B = 0.69, for a G8III star). From these
photometric data, we have estimated the effective temperature from
the
Teff - B - V calibration by Flower (1996). As a
first guess to compute synthetic spectra (see Sect. 3),
we have used
Teff = 5120 ![]() 40 K.
40 K.
According to Bell & Gustafsson (1989), this value is in good agreement with a G8 spectral type (and a B - V index of 0.87), but with a luminosity class III rather than II.
From CORAVEL measurements (De Medeiros & Mayor 1999), HD 232 862 has a rather constant radial velocity and a rotational velocity (vsin i) of 20.6 km s-1, a value considered as very high for its spectral type and its luminosity class (G8II). Indeed, as reported by De Medeiros et al. (1996a,b), the mean rotational velocity of late-G bright giants ranges from 3.2 km s-1at G5II to 2.1 km s-1at G9II. Hence we cannot exclude a mis-classification of this object among the luminosity class II, and the estimation of its mass (see Sect. 5) also seems to confirm this fact.
HD 232 862 is also reported as a X-ray source in the ROSAT data basis. It shows interesting features in the ultraviolet from IUE observations, pointing to a coronal and chromospheric activity. Indeed, on the basis of UV line fluxes measured from IUE SWP 42306 on a 240 nm exposure at low dispersion taken on August 22, 1991, one can observe a large number of strong lines that originate from the high ionization states of N, Si and C. These features have also been reported in the spectra of chromospherically active giants (e.g., KU Peg, see below).
2.2 KU Peg and HD 21 018
After the detection of an important Li feature and a magnetic field signature in the spectrum of HD 232 862, observations on two other field giants were collected with similar instrumentation (spectropolarimetry, see below) for comparative purposes. Two rapidly rotating stars were selected from the De Mederiros & Mayor (1999) catalogue. KU Peg and HD 21 018 present spectral types, and hence expected stellar parameters, similar to HD 232 862. KU Peg was selected for the stellar activity aspect and surface magnetic field search, while HD 21 018 was observed for Li content and evolutionary aspects.
The G8II bright giant KU Peg (= HD 218 153) is one of the most
chromospherically active stars, only the peculiar FK Comae star
being significantly more active (De Medeiros
et al. 1992). It is a rapidly rotating star (vsin i =
27.6
km s-1) and Strassmeier & Hall (1988) have
interpreted its photometric period (![]() 24 days) as the stellar
rotation period. De Medeiros & Lèbre (1992) produced a
spectroscopic study of KU Peg in the lithium line (670.7 nm)
region. They reported no sign of a significant LiI feature in this
rapidly rotating giant. This is in good agreement with the
evolutionary status of KU Peg and the expected ongoing Li dilution
occurring through the first dredge-up episode at the bottom of the
RGB.
24 days) as the stellar
rotation period. De Medeiros & Lèbre (1992) produced a
spectroscopic study of KU Peg in the lithium line (670.7 nm)
region. They reported no sign of a significant LiI feature in this
rapidly rotating giant. This is in good agreement with the
evolutionary status of KU Peg and the expected ongoing Li dilution
occurring through the first dredge-up episode at the bottom of the
RGB.
More recently, Weber et al. (2005), by comparing Doppler images of KU Peg to differential-rotation models (Kitchatinov & Rüdiger 2004), claimed that this rapidly rotating active star could host a weak magnetic field (less than 100 G). To date, however, direct detection of such a magnetic field in KU Peg is still lacking.
The G5III giant HD 21 018 (= HR 1 023) is known as a rapidly
rotating Li-rich giant (Hartoog 1978; Barrado y
Navascues et al. 1998). According to Charbonnel &
Balachandran (2000) and Dennissenkov et al.
(2006), this high Li content could be explained by
the evolutionary status of the star: an intermediate-mass
(>2.5 M![]() ) star on its way from MS to RGB.
) star on its way from MS to RGB.
Table 1 presents the list of the three giants involved into this work, together with useful parameters. V magnitude (V) and spectral type are taken from the SIMBAD database. vsin i and vrad values (in km s-1), and B - V are taken from the catalogue of De Medeiros & Mayor (1999).
Table 1: List of the program stars.
2.3 Spectropolarimetric observations
Spectropolarimetric observations of HD 232 862 were collected in December 2006 with the new generation of spectropolarimeter, ESPaDOnS, installed at the CFH Telescope (CFHT, a 4 m class telescope) in Mauna Kea (Hawaii, USA). The ESPaDOnS instrument consists of a cross-dispersion echelle spectrograph and a polarimetric module (Donati 2004; Donati et al. 2006). Spectropolarimetric data on the two other giants, KU Peg and HD 21 018, were collected in September 2007 with the ESpaDOnS'twin, NARVAL (Aurière 2003), installed at Télescope Bernard Lyot (TBL, a 2 m class telescope) at Pic du Midi (France).
For all observations (with ESPaDOnS and with NARVAL), the polarimetric mode has been used. It enables a very large coverage of the spectral region (from 375 nm to 1050 nm) and provides a spectral resolution of about 65 000. The observations were all carried out in the circular polarization mode in order to collect simultaneous information in Stokes V and I parameters. One observation consists of a sequence of four consecutive exposures taken with different waveplate configurations. Data reduction (including bias and flat field correction, order extraction, wavelength calibration and normalization to the continuum) was performed with the Libre-ESpRIT routines (adapted from the software package ESpRIT, see Donati et al. 1997). This software was available online at CFHT and at TBL during the observing runs, as well as other tools (see Sect. 4).
HD 232 862 was observed each night, from the 7th to the 10th of December 2006. In the 2007 September run, with NARVAL, KU Peg was observed during two consecutive nights, while HD 21 018 was observed only once because no magnetic detection was found from its Stokes V profile (see Sect. 4). The log of all our spectropolarimetric observations (ESPaDOnS and NARVAL) is presented in Table 2. Julian date (+2 454 000.000) is always considered at mid-exposure (i.e., at the beginning of the third subexposure). The total exposure time of a complete V sequence (i.e., cumulating four subexposures) is given (in s). The maximum signal-to-noise ratio (S/N) - on I spectrum - is reported (per velocity bin of 2.6 km s-1, near 730 nm).
Table 2: Log of our spectropolarimetric ESPaDOnS and NARVAL observations.
2.4 Binary status of HD 232 862
HD 232 862 (= cou2357) has been resolved as a visually tight binary by Couteau (1988). This star was measured four times in the interval 1988.04-1997.10: twice by Couteau (1988) and Gili & Couteau (1997) and twice by Heintz (1990,1998). These authors measured it as being composed of two tenth magnitude stars separated by about 0.75-0.85
The components of COU2357 were easily separated on the guiding
camera of ESPaDOnS during our subarcsec seeing observations at
CFHT. We thus put the giant star in the 1.58
![]() hole and
guided visually on the other star whose image was completely out
of the hole. We roughly estimated the distance between the two
components to be less than 2
hole and
guided visually on the other star whose image was completely out
of the hole. We roughly estimated the distance between the two
components to be less than 2
![]() which may suggest a much
larger displacement of the components during the last decade than
in the previous one (possible elliptical orbit). The giant star
was also significantly brighter than its companion in the guiding
CCD camera. This may suggest a secondary star hotter than the
giant star. Because of the rather small separation between the
components of this binary, we consider that the CORAVEL
observations (and more generally 2 m class telescope observations)
involved both stars, as well as previous photometric observations.
Because of the certainly very long period of the binary and a low
associated differential radial velocity, CORAVEL could not detect
the binary nature of HD 232 862. Our ESPaDOnS observations thus
appear as the first spectra of the giant star alone.
which may suggest a much
larger displacement of the components during the last decade than
in the previous one (possible elliptical orbit). The giant star
was also significantly brighter than its companion in the guiding
CCD camera. This may suggest a secondary star hotter than the
giant star. Because of the rather small separation between the
components of this binary, we consider that the CORAVEL
observations (and more generally 2 m class telescope observations)
involved both stars, as well as previous photometric observations.
Because of the certainly very long period of the binary and a low
associated differential radial velocity, CORAVEL could not detect
the binary nature of HD 232 862. Our ESPaDOnS observations thus
appear as the first spectra of the giant star alone.
3 Stellar parameters and lithium abundance
We made use of synthetic spectra to derive stellar parameters and lithium abundances of our three program stars. The MARCS stellar atmosphere models (Gustafsson et al. 2008) and the spectral synthesis tool TURBOSPECTRUM (described in Alvarez & Plez 1998) were used. Solar abundances were taken from Grevesse & Sauval (1998). Using a first guess on stellar model parameters ( Teff = 5000 K; log g = 2.0 and [Fe/H] = 0.0) and a microturbulence velocity always set to 2.0 km s-1, we computed synthetic spectra. We used a grid of MARCS models presenting a step in Teff of 250 K and a step in log g of 0.5 dex, while specific abundances as well as metallicity ([Fe/H]) could be adjusted precisely. We convolved the resulting synthetic spectra by a Gaussian profile, in order to reproduce the instrumental profile of ESPaDOnS and NARVAL, and by a rotational profile so as to take into account the vsin i of each object (see Table 1).
To derive stellar parameters and to measure lithium abundances,
under a local thermodynamic equilibrium (LTE) hypothesis, the
spectral synthesis was performed through the Balmer lines
(H![]() and H
and H![]() ) and the Li line (around 6710 Å)
regions. For this Li region, we made used of the specific atomic
line list described in Canto Martins et al.
(2006), initially issued from VALD (Kupka
et al. 1999; Ryabchikova et al. 1999) with
corrected oscillator strength values (log gf) for several
lines, and using several molecular line lists: TiO
(Plez 1998), VO (Alvarez & Plez 1998), CN
and CH (Hill et al. 2002).
) and the Li line (around 6710 Å)
regions. For this Li region, we made used of the specific atomic
line list described in Canto Martins et al.
(2006), initially issued from VALD (Kupka
et al. 1999; Ryabchikova et al. 1999) with
corrected oscillator strength values (log gf) for several
lines, and using several molecular line lists: TiO
(Plez 1998), VO (Alvarez & Plez 1998), CN
and CH (Hill et al. 2002).
Table 3: Stellar parameters and lithium abundances for our sample stars, as derived from synthetic spectra.
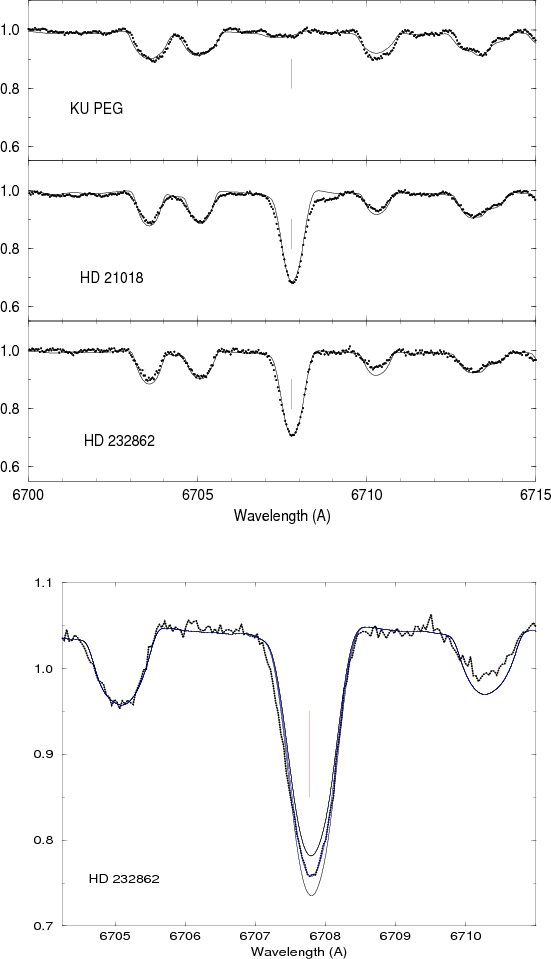 |
Figure 1:
Spectral synthesis of our program stars (upper pannel):
observations (dotted line) in the Li line region (around
6707.8 Å, indicated with the vertical thin line) and their
associated synthetic spectra (full line) computed with the stellar
parameters reported in Table 3, the rotational velocity
values (see Table 1), and a microturbulence velocity sets
to 2.0
|
| Open with DEXTER | |
We progressively modified the stellar parameters of synthetic spectra until a good agreement was achieved through fits to the observational spectra. Table 3 presents the stellar parameters and LTE lithium abundances we derived using synthetic spectra displayed in Fig. 1 around the Li line region. The total error on the Li abundance was estimated by computing the quadratic sum of errors on individual parameters. For HD 232 862 and KU Peg, as several observations were available, we investigated the Li equivalent widths for each individual spectrum and found them to be in very good agreement, considering the S/Nfor each observation. Hence the spectra displayed in Fig. 1 refer to the observations taken on December 10, 2006 (HD 232 862) and on September 05, 2007 (KU Peg).
Among our program stars, two objects present a high Li content: HD 21 018, and our main target, HD 232 862. As already reported by De Medeiros & Lèbre (1992), the spectra of KU Peg show no sign of a significant Li feature.
The rapidly rotating giant star HD 21 018 exhibits a very high Li
content:
ALi = 2.8 ![]() 0.25 dex. Previous spectroscopic studies
devoted to HD 21 018 have already mentioned this fact. Hartoog
(1978) derived stellar parameters for HD 21 018 in
very good agreement with our determinations (
Teff = 5200 K and
log g = 3.0) and was the first to report its high Li content (
ALi = 2.93). Barrado y Navascues et al. (1998) reported a
much higher value for the Li abundance
(
ALi = 3.35
0.25 dex. Previous spectroscopic studies
devoted to HD 21 018 have already mentioned this fact. Hartoog
(1978) derived stellar parameters for HD 21 018 in
very good agreement with our determinations (
Teff = 5200 K and
log g = 3.0) and was the first to report its high Li content (
ALi = 2.93). Barrado y Navascues et al. (1998) reported a
much higher value for the Li abundance
(
ALi = 3.35 ![]() 0.4 dex), while adopting similar stellar
parameters (
Teff = 5154 K). These two previous spectroscopic
studies devoted to HD 21 018 used a similar method (based on
curves of growth) to derive the Li abundance from a Li + Fe
blended feature presenting the same equivalent width
(221-222 mÅ) in both works. Besides the use of spectral
synthesis, our present Li abundance measurement in HD 21 018
takes into account a better determination of vsin i and it
remains - within error bars - compatible with previous
determinations.
0.4 dex), while adopting similar stellar
parameters (
Teff = 5154 K). These two previous spectroscopic
studies devoted to HD 21 018 used a similar method (based on
curves of growth) to derive the Li abundance from a Li + Fe
blended feature presenting the same equivalent width
(221-222 mÅ) in both works. Besides the use of spectral
synthesis, our present Li abundance measurement in HD 21 018
takes into account a better determination of vsin i and it
remains - within error bars - compatible with previous
determinations.
A surprising result here is the high Li content we derived for HD
232 862:
ALi = 2.45 ![]() 0.25 dex. It is far in excess of the
expected value for this spectral type (G8), and also quite
peculiar for a bright giant. Indeed, for the relevant range of
mass and evolutionary stage, surface lithium is expected to be
diluted in the convective envelope.
0.25 dex. It is far in excess of the
expected value for this spectral type (G8), and also quite
peculiar for a bright giant. Indeed, for the relevant range of
mass and evolutionary stage, surface lithium is expected to be
diluted in the convective envelope.
While there is no Hipparcos parallax available for HD 232 862, a complementary chemical study focused on CNO products and the 12C/13C ratio would help to clarify its evolutionary status. Unfortunately, the rotational velocity of HD 232 862 (vsin i = 20.6 km s-1) is among the highest measured for this class of objects (De Medeiros & Mayor 1999). It turns out that it was not possible to assess its 12C/13C isotopic ratio even from very good ESPaDOnS spectra (we vainly tried from features around 4200 Å and 8000 Å).
4 Surface magnetic field detections
4.1 Methodology
As observations were collected with the spectropolarimeters ESPaDOnS and NARVAL (see Sect. 2), it was also possible to detect the presence of a magnetic field at the stellar surface. Stokes V profiles enable one to detect circular polarization on lines, which is related to the longitudinal Zeeman effect produced by the presence of a magnetic field in the stellar photosphere (Landstreet 1992).
The extraction of polarization echelle spectra was performed using the Libre-ESpRIT software (see Donati et al. 1997 for a full description of the original software package ESpRIT). To better study the Stokes V parameter profile, a least square deconvolution (LSD) process was performed on the data immediately after each observation. The LSD tool (Donati et al. 1997; Shorlin et al. 2002) allows the extraction of mean circularly polarized and unpolarized profiles in a process similar to a cross-correlation method. This technique - involving several thousands of spectral lines - offers the opportunity to considerably enhance the sensitivity of Zeeman detection, when compared to a single line analysis. When a Zeeman Stokes V signature is detected (cases of HD 232 862 and KU Peg, see further), a null spectrum N (obtained by the standard procedure described in Donati et al. 1997) can be explored. It can help to confirm the detection of a clear Zeeman Stokes V signature when a feature is present only in V and not in N, and well located within the line profile velocity interval. Hence, the LSD analysis also provides a criterion for the detection of Zeeman Stokes V signatures and a detection probability: definite detection or marginal detection or no detection at all. When a definite detection is established, the longitudinal magnetic field Bl is computed using the first order moment method (Rees & Semel 1979; Donati et al. 1997).
4.2 HD 232 862
Four circularly polarized spectra were recorded with ESPaDOnS on HD 232 862, from December 7, 2006 to December 10, 2006 (see Table 2 in Sect. 2). To perform the LSD analysis, a specific mask involving a line list (with about 12 000 lines) computed from an ATLAS9 model atmosphere (from Kurucz 2005) with log g = 3.0 dex and Teff = 5000 K was used.
Figure 2 presents LSD profiles (December 7th, 2006 observation) and its definite magnetic field detection. The panel displays correlation profiles: Stokes I profile (lower plot, solid line), Stokes V profile (upper plot, dotted line) and the null spectrum diagnostic N (intermediate plot, dotted line). In order to distinguish the Zeeman signature from the noise, the V and N profiles have been vertically offset (respectively by 1.1 and 1.0), expanded by a factor 25, and smoothed (solid lines).
![\begin{figure}
\par\includegraphics[height=7.5cm,width=5.5cm,angle=270]{12038fig2.ps}\end{figure}](/articles/aa/full_html/2009/36/aa12038-09/img12.png) |
Figure 2:
HD 232 862: Least square deconvolved Zeeman signature
extracted from ESPaDOnS spectropolarimetric observation (December
07, 2006). A specific mask ( |
| Open with DEXTER | |
![\begin{figure}
\includegraphics[height=8.5cm,width=6.5cm,angle=270]{12038fig3.ps}\end{figure}](/articles/aa/full_html/2009/36/aa12038-09/img14.png) |
Figure 3:
HD 232 862: Time variation of Stokes V profiles
obtained from the LSD method (with a specific mask composed of
about 12 000 lines and computed with
T |
| Open with DEXTER | |
Figure 3 presents the Stokes V profiles of HD 232 862 for the four consecutive observational dates (from December 7th to 10th, 2006). A magnetic field is thus detected unambiguously in each observation of HD 232 862. The Stokes V profile appears to be variable in time and also very complex, presenting several sign reversals throughout the line profile. The complex aspect and variability of the detected magnetic signatures strongly suggest that the parent field structure may have a dynamo origin and a complex topology, likely with field topology variations on a rotational period that still needs to be determined.
The Bl values (and 1![]() accuracy) are indicated
in each Stokes V profile of Fig. 3 and
summarized in Table 4. For HD 232 862, the Bl values are strongly variable along the 4-day timescale. This
result is indeed one of the first direct field detections in an
active late giant. Konstantinova-Antova et al. (2008)
and Aurière et al. (2008) have reported direct
detection of the presence and variability of a magnetic field in
active single giants, using similar instrumentation (NARVAL at
TBL) and techniques (LSD analysis). They also reported Bl value variations. A magnetic field has also been detected from
spectropolarimetric techniques in very fast rotators: a FK Com
type giant (Petit et al. 2004) and in RS CVn type giants
(Berdyugina et al. 2006). The magnetic field in HD
232 862 appears rather strong, but its complexity and rapid
variations point to a dynamo process origin in a rapid rotator
rather than to the descendant of an Ap star, as in the case of EK
Eri (Aurière et al. 2008). More spectropolarimetric
observations are needed in a monitoring mode, in order to
ascertain the periodicity of the Zeeman Stokes V profiles
variation, and to study the associated change in the field
topology of HD 232 862.
accuracy) are indicated
in each Stokes V profile of Fig. 3 and
summarized in Table 4. For HD 232 862, the Bl values are strongly variable along the 4-day timescale. This
result is indeed one of the first direct field detections in an
active late giant. Konstantinova-Antova et al. (2008)
and Aurière et al. (2008) have reported direct
detection of the presence and variability of a magnetic field in
active single giants, using similar instrumentation (NARVAL at
TBL) and techniques (LSD analysis). They also reported Bl value variations. A magnetic field has also been detected from
spectropolarimetric techniques in very fast rotators: a FK Com
type giant (Petit et al. 2004) and in RS CVn type giants
(Berdyugina et al. 2006). The magnetic field in HD
232 862 appears rather strong, but its complexity and rapid
variations point to a dynamo process origin in a rapid rotator
rather than to the descendant of an Ap star, as in the case of EK
Eri (Aurière et al. 2008). More spectropolarimetric
observations are needed in a monitoring mode, in order to
ascertain the periodicity of the Zeeman Stokes V profiles
variation, and to study the associated change in the field
topology of HD 232 862.
Table 4:
B![]() values (in G) for the magnetic
field estimated in each individual observations of HD 232 862 and
KU Peg.
values (in G) for the magnetic
field estimated in each individual observations of HD 232 862 and
KU Peg.
![\begin{figure}
\par\includegraphics[height=7.5cm,width=5.5cm,angle=270]{12038fig4.ps}\end{figure}](/articles/aa/full_html/2009/36/aa12038-09/img17.png) |
Figure 4: KU Peg: Least square deconvolved Zeeman signature extracted from NARVAL spectropolarimetric observation (September 05, 2007) (same as Fig. 2). |
| Open with DEXTER | |
![\begin{figure}
\par\includegraphics[height=8.5cm,width=4.5cm,angle=270]{12038fig5.ps} %
\end{figure}](/articles/aa/full_html/2009/36/aa12038-09/img18.png) |
Figure 5:
KU Peg: Time variation of Stokes V profiles obtained from
the LSD method (with a specific mask composed of about 12 000
lines and computed with
T |
| Open with DEXTER | |
![\begin{figure}
\par\includegraphics[height=7.5cm,,width=5.5cm,angle=270]{12038fig6.ps} %
\end{figure}](/articles/aa/full_html/2009/36/aa12038-09/img19.png) |
Figure 6:
HD 21 018: Least square deconvolved Zeeman profile
performed in the spectropolarimetric observation of September 05,
2007. A specific mask (composed of about 12 000 lines) and
computed with
T |
| Open with DEXTER | |
4.3 KU Peg
Two circularly polarized spectra were recorded with NARVAL at TBL on the active star KU Peg on September 4 and 5, 2007 (see Table 2 in Sect. 2). As for HD 232 862 observations, a LSD analysis was performed on these data, just after the exposure, each time giving definite magnetic field detections. The LSD quick look performed on the observation of the 2007 September 5th is displayed in Fig. 4. Again, the specific mask ( Teff = 5000 K and log g = 3.0 dex) involved in the analysis of HD 232 862 was used to compute the correlation profiles. Figure 5 presents these two LSD profiles and their definite magnetic field detections. Variation on the Zeeman Stokes V profiles is also present in KU Peg data. The longitudinal magnetic field Bl has also been estimated (see Table 4). It ranges from 3 to 9 G, and appears, at this phase, weaker than the one estimated for HD 232 862. This weak value is consistent with the theoretical prediction by Kitchatinov & Rüdiger (2004) for KU Peg. More spectropolarimetric observations are needed to confirm this first direct detection of a magnetic field in this chromospherically active giant, and to determine the intensity of its magnetic field.
4.4 HD 21 018
From the NARVAL observations of HD 21 018, no Zeeman Stokes V detection was obtained (Fig. 6). Again, more spectropolarimetric observations are needed to confirm the absence of a Zeeman signature and/or to exclude the presence of a very weak field.
5 Evolutionary status
In this section, we wish to address the origin of the high Li
abundance in HD 232 862 in terms of chemical evolution.
The Li content we derive for this G8 star is indeed far in excess of the expected value
for this spectral type, and also quite peculiar for a bright
giant. In the observational lithium survey of bright giants of
Lèbre et al. (2006), only a few stars located on the
blue side of the Hertzsprung gap, i.e., with
Teff > 5500 K,
show a high Li content (
ALi > 2.0). For single and binary
stars, almost all stars located on the red side of the Hertzsprung
gap, i.e., in the G to K spectral type range, show low Li content.
However, for a lower mass range object (luminosity class III:
stellar mass <2.5 M![]() ) this Li content, although exceptionally
high, can be explained but at a very specific evolutionary point
on the RGB lifetime: the so-called RGB bump.
) this Li content, although exceptionally
high, can be explained but at a very specific evolutionary point
on the RGB lifetime: the so-called RGB bump.
We thus need to determine the evolutionary status of HD 232 862, and more precisely, to evaluate its location with respect to the first dredge-up advancement. Unfortunately, due to the lack of a precise parallax available for this star, it is difficult to assess precisely its evolutionary stage. Moreover, its high rotational velocity prevents a reliable measurement of its 12C/13C carbon isotopic ratio even from a high resolution and good signal to noise spectrum collected with a 4 m class telescope.
In order to evaluate an approximate evolutionary status and mass for HD 232 862, we have decided to directly compare its derived stellar parameters and Li abundance presented in Table 3 with the predictions from standard single star stellar evolution models at the same metallicity (i.e., [Fe/H] = -0.3).
To do so, we used the STAREVOL V3.0 stellar evolution code. A
detailed description of STAREVOL V2.90 can be found in Siess (2006). Let us
recall the main physical ingredients used for the models presented here.
We considered a reference solar composition following Grevesse & Sauval (1998), and we
applied a simple scaling to derive the initial mixture for the different metallicities considered,
which is the usual approach when computing at non-solar metallicities (Schaller et al. 1992; Girardi et al. 2000).
In this case, at [Fe/H] = -0.3, the initial lithium abundance is
ALi = 2.976 dex. Mass loss was
included from the zero age MS (ZAMS), following Reimers (1975)
law with a parameter
![]() = 1.00. No transport of matter
was considered in the radiative interiors, the only ``mixed''
regions being the convective ones. Convection is modelled following
the Mixing Length Theory, with a parameter
= 1.00. No transport of matter
was considered in the radiative interiors, the only ``mixed''
regions being the convective ones. Convection is modelled following
the Mixing Length Theory, with a parameter
![]() = L/Hp = 1.75. The Schwarzschild criterion was applied and no convective
overshooting was considered.
= L/Hp = 1.75. The Schwarzschild criterion was applied and no convective
overshooting was considered.
We can get a first flavour of the evolutionary status of HD
232 862 from its position in the (log g,
Teff)
plane. In Fig. 7, we have placed the values
derived for HD 232 862 on a graph along with tracks for models of
1.0, 1.5, 2.0, 2.5, 3.0 and 3.5 M![]() , covering the lower end
of its expected mass domain. From the derived values of log g and
Teff quoted in Table 1, HD 232 862 appears to be in the
mass range
between 1 M
, covering the lower end
of its expected mass domain. From the derived values of log g and
Teff quoted in Table 1, HD 232 862 appears to be in the
mass range
between 1 M![]() and 3.5 M
and 3.5 M![]() , with a preferred mass of about
2 M
, with a preferred mass of about
2 M![]() . In this mass range, the models shown in
Fig. 7 indicate that the star is currently
undergoing the first dredge-up, and hence lithium dilution. On the
tracks we have indicated by bold parts the
portion where the predicted Li surface abundance is within the
determined error bar, i.e., between 2.7 and 2.2 dex. The determined surface gravity and effective
temperature clearly place HD 232 862 on the right side of these locations. As lithium abundance
decreases at the surface as the dredge-up proceeds, according to standard stellar
evolution models, HD 232 862 should have a much lower surface lithium abundance (between 0.9 and 1.9 dex)
than the high value of
ALi = 2.45
. In this mass range, the models shown in
Fig. 7 indicate that the star is currently
undergoing the first dredge-up, and hence lithium dilution. On the
tracks we have indicated by bold parts the
portion where the predicted Li surface abundance is within the
determined error bar, i.e., between 2.7 and 2.2 dex. The determined surface gravity and effective
temperature clearly place HD 232 862 on the right side of these locations. As lithium abundance
decreases at the surface as the dredge-up proceeds, according to standard stellar
evolution models, HD 232 862 should have a much lower surface lithium abundance (between 0.9 and 1.9 dex)
than the high value of
ALi = 2.45 ![]() 0.25 dex estimated
for this star from the spectroscopic analysis. In order to check this result, we have computed several other
grids, varying the initial metallicity of the models within the observed error bar and assuming an initial lithium
abundance of 3.2 dex. In none of these cases are we able to reconcile the derived (log g,
Teff) values with the
predicted lithium surface abundance.
0.25 dex estimated
for this star from the spectroscopic analysis. In order to check this result, we have computed several other
grids, varying the initial metallicity of the models within the observed error bar and assuming an initial lithium
abundance of 3.2 dex. In none of these cases are we able to reconcile the derived (log g,
Teff) values with the
predicted lithium surface abundance.
![\begin{figure}{\includegraphics[width=7.6cm,height=7.5cm]{12038fig7.eps} }
\end{figure}](/articles/aa/full_html/2009/36/aa12038-09/img22.png) |
Figure 7:
Position of HD 232 862 in the (log g,
T |
| Open with DEXTER | |
![\begin{figure}{\includegraphics[width=7.6cm,height=7.5cm]{12038fig8.eps} }
\end{figure}](/articles/aa/full_html/2009/36/aa12038-09/img23.png) |
Figure 8:
Position of HD 21 018 and KU Peg in the
Hertzsprung-Russell diagram. Solid and dashed tracks were computed
at [Fe/H] = -0.15 (approximate metallicity of KU Peg) and [Fe/H] = 0.0 (metallicity of HD 21 018) respectively.
The long-dashed line
crossing through the tracks on the left indicates the beginning of
the first DUP for the models at [Fe/H] = -0.15. The dotted line on
the right indicates the location of maximum penetration (in mass)
of the convective envelope for these same tracks. The small
diamonds on the tracks indicate the location where
A |
| Open with DEXTER | |
![\begin{figure}{\includegraphics[width=7.6cm,height=7.5cm]{12038fig9.eps} }
\end{figure}](/articles/aa/full_html/2009/36/aa12038-09/img24.png) |
Figure 9:
Position of KU Peg and HD 21 018 in the (log g,
T |
| Open with DEXTER | |
Thus, from these models, we might actually consider its high Li
content to be particularly peculiar. Indeed,
a few field RGB stars present
ALi far in excess of the values
predicted by standard theory. These are usually found at the
so-called bump, an episode occurring higher on the RGB, after the
completion of the first dredge-up, during which the surface Li
abundance is reduced by a large factor (Charbonnel &
Balachandran 2000). At this specific evolutionary point, the mean
molecular-weight barrier left by the first dredge-up at its maximum
penetration depth is erased by the outward moving HBS. This may allow non-standard transport processes, such
as rotation induced mixing, to freely connect the base of the
convective envelope to the regions that have been processed by the
HBS. Palacios et al. (2001) suggested production of fresh
7Li from 7Be at the bump, when the HBS first connects the
![]() -barrier. This
-barrier. This ![]() -barrier is however very strong on the lower
part of the RGB, where HD 232 862 appears to lie, which should rule
out this specific scenario
-barrier is however very strong on the lower
part of the RGB, where HD 232 862 appears to lie, which should rule
out this specific scenario![]() .
.
In order to validate the approach we have adopted to estimate the
evolutionary status of HD 232 862, we applied the same method to
KU Peg and HD 21 018, both stars for which Hipparcos parallaxes
are available, which allows us to derive their luminosity. We have
computed two grids of models between 2 M![]() and 6 M
and 6 M![]() at [Fe/H] = -0.15 and 0.0, the metallicities associated with KU
Peg and HD 21 018, respectively. Figure 8
presents the Hertzsprung-Russell diagram for these grids. In order
to locate our two stars on this theoretical plane, we need to
transform the observed magnitudes into luminosities. We applied
the bolometric corrections from Bessell et al. (1998),
taking into account the temperature and surface gravity of each
star. The adopted values are BCV = -0.26 and BCV = -0.17
for KU Peg and HD 21 018, respectively. The interstellar
absorption AV is given by the reddening maps available via the
NASA/IPAC Infrared Science Archive. The adopted values are
AV = 0.3205 and 0.4274 for KU Peg and HD 21 018, respectively.
at [Fe/H] = -0.15 and 0.0, the metallicities associated with KU
Peg and HD 21 018, respectively. Figure 8
presents the Hertzsprung-Russell diagram for these grids. In order
to locate our two stars on this theoretical plane, we need to
transform the observed magnitudes into luminosities. We applied
the bolometric corrections from Bessell et al. (1998),
taking into account the temperature and surface gravity of each
star. The adopted values are BCV = -0.26 and BCV = -0.17
for KU Peg and HD 21 018, respectively. The interstellar
absorption AV is given by the reddening maps available via the
NASA/IPAC Infrared Science Archive. The adopted values are
AV = 0.3205 and 0.4274 for KU Peg and HD 21 018, respectively.
As in Fig. 7, we have indicated the location
of the beginning and of the end of the first dredge-up, as well as
the range of temperature and luminosity where
ALivaries between 3.05 and 2.55 dex. KU Peg appears to have a mass
between 2 and 2.5 M![]() , where the Li dilution is already well
advanced, which is in agreement with no clear signature of Li
found in this star (De Medeiros & Lèbre 1992). In good
agreement with Charbonnel & Balachandran (2000) and
Denissenkov et al. (2006), we estimate the mass of
HD 21 018 to be about 5 M
, where the Li dilution is already well
advanced, which is in agreement with no clear signature of Li
found in this star (De Medeiros & Lèbre 1992). In good
agreement with Charbonnel & Balachandran (2000) and
Denissenkov et al. (2006), we estimate the mass of
HD 21 018 to be about 5 M![]() . According to
Fig. 7, the first dredge-up episode has just
started in HD 21 018, and its Li surface abundance should not be
altered yet, in agreement with the large abundance determined for
this star.
. According to
Fig. 7, the first dredge-up episode has just
started in HD 21 018, and its Li surface abundance should not be
altered yet, in agreement with the large abundance determined for
this star.
Let us turn now to the position of these stars on the (log g,
Teff) plane, displayed in Fig. 9. The location
of KU Peg is in perfect agreement with its position on the
HR-diagram, and we confirm its low mass and more advanced
evolutionary status. The agreement is not as good concerning HD
21 018, and the cross comparison of Figs. 7
and 8 points to a lower mass, likely around
4 M![]() . The rather large uncertainty on the Hipparcos
parallax is in part responsible for this marginal agreement
between the HR diagram and the (log g,
Teff) diagram. This star
should however be at the beginning of the first dredge-up episode,
in agreement with observations.
. The rather large uncertainty on the Hipparcos
parallax is in part responsible for this marginal agreement
between the HR diagram and the (log g,
Teff) diagram. This star
should however be at the beginning of the first dredge-up episode,
in agreement with observations.
6 Conclusions
We have determined a high Li content ( ALi = 2.45 dexHence, the high Li content we report in HD 232 862 is still puzzling. We cannot rule out that it is due to a mechanism preventing the efficient Li dilution expected during the first dredge-up to occur.
Moreover, we have detected a surface magnetic field on HD 232 862. It strongly varies during 4-day observations, likely pointing to a dynamo nature. A rough estimate of its longitudinal component reveals a high intensity. To date, this magnetic field in HD 232 862 seems to be one of the strongest fields ever detected in a giant, and also the first one to be detected in a Li-rich giant. Further observations (and modelling of V profiles) are now needed to infer the mean magnetic field of HD 232 862, to clarify its origin, and to assess the progenitor of HD 232 862. Only then will it be possible to disentangle whether its high ALi is due to the presence of a surface magnetic field, to the binary status of HD 232 862, or to another process.
A magnetic field for the rapidly rotating active giant star KU Peg has also been detected for the first time. It appears to be weaker than the one measured in HD 232 862. More spectropolarimetric observations, in monitoring mode along the rotational period, are now needed to better study the topology of this magnetic field. Such spectropolarimetric observations of KU Peg and HD 232 862 are already in progress with the NARVAL instrument.
Acknowledgements
A. L. thanks J. F. Donati for his kind help during the observing run at CFHT with the ESPaDOnS instrument, and C. Catala for his helpful supports during time sharing runs. This research has made use of the following soft and services: the SIMBAD database, operated at the CDS (Strasbourg, France), the NASA's Astrophysics Data System, the NASA/IPAC Infrared Science Archive, which is operated by the Jet Propulsion Laboratory, California Institute of Technology, under contract with the National Aeronautics and Space Administration, and the Vienna Atomic Line Database (VALD). Spectropolarimetric data have been reduced and analysed, respectively with the Libre-ESpRIT software and the Least Square Deconvolution routine, both written by J. F. Donati (LATT, France) and kindly provided during the ESPaDOnS/CFHT and NARVAL/TBL observing runs. We thank the French PNPS/INSU-CNRS for financial support and J. D. N. Jr. acknowledges the CNPq for partial support. Research activities of the Stellar Board at the Federal University of Rio Grande do Norte (Brazil) are supported by continuous grants from CNPq and FAPERN Brazilian Agencies.
References
- Alexander, J. B. 1967, Observatory, 87, 238 [NASA ADS] (In the text)
- Alvarez, R., & Plez, B. 1998, A&A, 330, 1109 [NASA ADS] (In the text)
- Antov, A. P., & Konstantinova-Antova, R. K. 1995, in Robotic Observatories, ed. M. F. Bode (Chichester: Praxis Publishing), 69 (In the text)
- Aurière, M. 2003, in Magnetism and Activity of the Sun and Stars, ed. J. Arnaud, & N. Meunier, EAS Publ. Ser., 9, 105 (In the text)
- Aurière, M., Konstantinova-Antova, R., Petit, P., et al. 2008, A&A, 491, 499 [NASA ADS] [CrossRef] [EDP Sciences] (In the text)
- Barrado y Navascues, D., de Castro, E., Fernandez-Figueroa, M. J., Cornide, M., & Garcia Lopez, R. J. 1998, A&A, 337, 739 [NASA ADS] (In the text)
- Bell, R. A., & Gustafsson, B. 1989, MNRAS, 236, 653 [NASA ADS] (In the text)
- Berdyugina, S. V., Petit, P., Fluri, D. M., et al. 2006, ASPC, 358, 381B [NASA ADS] (In the text)
- Bessell, M. S., Castelli, F., & Plez, B. 1998, A&A, 333, 231 [NASA ADS] (In the text)
- Brown, J. A, Sneden, C., Lambert, D. L., & Dutchover, E. 1989, ApJS, 71, 293 [NASA ADS] [CrossRef] (In the text)
- Cameron, A. G. W., & Fowler, W. A. 1971, ApJ, 164, 111 [NASA ADS] [CrossRef] (In the text)
- Canto Martins, B.-L., Lèbre, A., De Laverny, P. et al. 2006, A&A, 451, 993 [NASA ADS] [CrossRef] [EDP Sciences] (In the text)
- Castilho, B. V., Spite, F., Barbuy, B., et al. 1999, A&A, 345, 249 [NASA ADS] (In the text)
- Charbonnel, C., & Balachandran, S. C. 2000, A&A, 359, 563 [NASA ADS] (In the text)
- Couteau, P. 1988, A&AS, 75, 163 [NASA ADS] (In the text)
- de La Reza, R. 2006, Chemical Abundances and Mixing in Stars in the Milky Way and its Satellites, ESO Astrophysics Symposia (Berlin: Springer-Verlag), 196, ISBN 978-3-540-34135-2 (In the text)
- de la Reza, R., Drake, N. A., & Silva, L. 1996, ApJ, 456, L115 [NASA ADS] [CrossRef] (In the text)
- de Laverny, P., do Nascimento, J. D., Jr., Lèbre, A., & De Medeiros, J. R. 2003, A&A, 410, 937 [NASA ADS] [CrossRef] [EDP Sciences] (In the text)
- De Medeiros, J. R., & Lèbre, A. 1992, A&A, 264, L21 [NASA ADS] (In the text)
- De Medeiros, J. R., & Mayor, M. 1999, A&AS, 139, 443 [NASA ADS] [CrossRef] (In the text)
- De Medeiros, J. R., Mayor, M., & Simon, T. 1992, A&A, 254, L36 [NASA ADS]
- De Medeiros, J. R., Da Rocha, C., & Mayor, M. 1996a, A&A, 314, 499 [NASA ADS] (In the text)
- De Medeiros, J. R., Melo, C. H. F., & Mayor, M. 1996b, A&A, 309, 465 [NASA ADS]
- De Medeiros, J. R., do Nascimento, J. D., Jr., & Mayor, M. 1997, A&A, 317, 701 [NASA ADS] (In the text)
- Denissenkov, P. A., & Weiss, A. 2000, A&A, 358, L49 [NASA ADS] (In the text)
- Denissenkov, P. A., Chaboyer, B., & Li, K. 2006, ApJ, 641, 1087 [NASA ADS] [CrossRef] (In the text)
- Donati, J.-F. 2004, in Scientific Highlights 2004, EDP Sciences Conf. Ser., ed. F. Combes et al., 217 (In the text)
- Donati, J.-F., Semel, M., Carter, B. D., Rees, D. E., & Cameron, A. C. 1997, MNRAS, 291, 658 [NASA ADS] (In the text)
- Donati, J.-F., Catala, C., Landstreet, J. D., & Petit, P. 2006, in Solar Polarization 4, ed. R. Casini, & B. W. Lites, ASP Conf. Ser., 358, 362 (In the text)
- Drake, N. A., de La Reza, R., da Silva, L., & Lambert, D. L. 2002, AJ, 123, 2703 [NASA ADS] [CrossRef] (In the text)
- Fekel, F. C., & Balachandran, S. 1993, ApJ, 403, 708 [NASA ADS] [CrossRef] (In the text)
- Fekel, F. C., Webb, R. A., White, R. J., & Zuckerman, B. 1996, ApJ, 403, 708 [CrossRef] (In the text)
- Flower, P. J. 1996, ApJ, 469, 355 [NASA ADS] [CrossRef] (In the text)
- Gili, R., & Couteau, P. 1997, A&AS, 126, 1 [NASA ADS] [CrossRef] [EDP Sciences] (In the text)
- Girardi, L., Bressan, A., Bertelli, G., & Chiosi, C. 2000, A&AS, 141, 371 [NASA ADS] [CrossRef] [EDP Sciences] (In the text)
- Gratton, R. G., & D'Antona, F. 1989, A&A, 215, 66 [NASA ADS] (In the text)
- Grevesse, N., & Sauval, A. J. 1998, SSRv, 85, 161 [NASA ADS] [CrossRef] (In the text)
- Gustafsson, B., Edvardsson, B., Eriksson, K., et al. 2008, A&A, 486, 951 [NASA ADS] [CrossRef] [EDP Sciences] (In the text)
- Hartoog, M. R. 1978, PASP, 90, 167 [NASA ADS] [CrossRef] (In the text)
- Heintz, W. D. 1990, ApJS, 74, 275 [NASA ADS] [CrossRef] (In the text)
- Heintz, W. D. 1998, ApJS, 117, 587 [NASA ADS] [CrossRef]
- Hill, V., & Pasquini, L. 2000, in The Light Elements and their Evolution, ed. L. da silva, R. de Medeiros, & M. Spite, IAU Symp., 198, 293 (In the text)
- Hill, V., Plez, B., Cayrel, R., et al. 2002, A&A, 387, 560 [NASA ADS] [CrossRef] [EDP Sciences], (In the text)
- Iben, I. J. 1965, ApJ, 142, 1447 [NASA ADS] [CrossRef] (In the text)
- Iben, I. J. 1966a, ApJ, 143, 483 [NASA ADS] [CrossRef] (In the text)
- Iben, I. J. 1966b, ApJ, 143, 505 [NASA ADS] [CrossRef] (In the text)
- Iben, I. J. 1991, ApJS, 76, 55 [NASA ADS] [CrossRef]
- Kitchatinov, L. L., & Rüdiger, G. 2004, Astron. Nachr., 325, 496 [NASA ADS] [CrossRef] (In the text)
- Konstantinova-Antova, R., Aurière, M., Iliev, I. Kh., et al. 2008, A&A, 480, 475 [NASA ADS] [CrossRef] [EDP Sciences] (In the text)
- Kraft, R. P., Peterson, R. C., Guhathakurta, P., et al. 1999, ApJ, 518, 53 [NASA ADS] [CrossRef] (In the text)
- Kupka, F., Piskunov, N. E., Ryabchikova, T. A., Stempels, H. C., & Weiss, W. W. 1999, A&AS, 138, 119 [NASA ADS] [CrossRef] [EDP Sciences] (In the text)
- Kurucz, R. 2005, Mem. S.A. I. Suppl., 8, 14 (In the text)
- Landstreet, J. D. 1992, A&ARv, 4, 35 [NASA ADS]
- Lèbre, A., De Laverny P., De Medeiros, J. R., Charbonnel, C., & Da Silva, L. 1999, A&A, 345, 936 [NASA ADS] (In the text)
- Lèbre, A., de Laverny, P., do Nascimento, J. D., & de Medeiros, J. R. 2006, A&A, 450, 1173 [NASA ADS] [CrossRef] [EDP Sciences] (In the text)
- Luck, R. E., & Wepfer, G. G. 1995, AJ, 110, 2425 [NASA ADS] [CrossRef] (In the text)
- Melo, C. H. F., de Laverny, P., Santos, N. C., et al. 2005, A&A, 439, 227 [NASA ADS] [CrossRef] [EDP Sciences] (In the text)
- Monaco, L., & Bonifacio, P. 2008, Mem. Soc. Astron. Ital., 79, 524 [NASA ADS] (In the text)
- Palacios, A., Charbonnel, C., & Forestini, M. 2001, A&A, 375, L9 [NASA ADS] [CrossRef] [EDP Sciences] (In the text)
- Palacios, A., Talon, S., Charbonnel, C., & Forestini, M. 2003, A&A, 399, 603 [NASA ADS] [CrossRef] [EDP Sciences]
- Petit, P., Donati, J. F., Oliveira, J. M., et al. 2004, MNRAS, 351, 826 [NASA ADS] [CrossRef] (In the text)
- Pilachowski, C. A., Sneden, C., Kraft, R. P., Harmer, D., & Willmarth, D. 2000, AJ, 119, 2895 [NASA ADS] [CrossRef] (In the text)
- Plez, B. 1998, A&AS, 337, 495 [NASA ADS] (In the text)
- Randich, S., Gratton, R., Pallavicini, R., Pasquini, L., & Caretta, E. 1999, A&A, 348, 487 [NASA ADS] (In the text)
- Reddy, B. E., & Lambert, D. L. 2005, AJ, 129, 2831 [NASA ADS] [CrossRef] (In the text)
- Reddy, B. E., Lambert, D. L., Hrivnak, B. J., & Bakker, E. J. 2002, AJ, 123, 1993 [NASA ADS] [CrossRef] (In the text)
- Rees, D. E., & Semel, M. 1979, A&A, 74, 1 [NASA ADS] (In the text)
- Reimers, D. 1975, Mem. Soc. R. Sci. Liège, 8, 369 [NASA ADS] (In the text)
- Roederer, I. U., Frebel, A., Shetrone, M. D., et al. 2008, ApJ, 679, 1549 [NASA ADS] [CrossRef] (In the text)
- Ryabchikova, T. A., Piskunov, N. E., Stempels, H. C., et al. 1999, in Proc. of the 6th International Colloquium on Atomic Spectra and Oscillator Strengths, Victoria BC, Canada, Phys. Scr. T, 83, 162 (In the text)
- Sackmann, I.-J., & Boothroyd, A. I. 1999, ApJ, 510, 217 [NASA ADS] [CrossRef] (In the text)
- Schaller, G., Schaerer, D., Meynet, G., & Maeder, A. 1992, A&AS, 96, 269 [NASA ADS] (In the text)
- Shorlin, S. L. S., Wade, G. A., Donati, J.-F., et al. 2002, A&A, 392, 637 [NASA ADS] [CrossRef] [EDP Sciences] (In the text)
- Siess, L. 2006, A&A, 448, 717 [NASA ADS] [CrossRef] [EDP Sciences] (In the text)
- Siess, L., & Livio, M. 1999, MNRAS, 304, 925 [NASA ADS] [CrossRef] (In the text)
- Strassmeier, K. G., & Hall, D. S. 1988, ApJS, 67, 453 [NASA ADS] [CrossRef] (In the text)
- Wallerstein, G., & Sneden, C. 1982, ApJ, 255, 577 [NASA ADS] [CrossRef] (In the text)
- Weber, M., Strassmeier, K. G., & Washuettl, A. 2005, Astron. Nachr., 326, 287 [NASA ADS] [CrossRef] (In the text)
Footnotes
- ...
giant
- Based on spectropolarimetric observations obtained at the Canada-France-Hawaii Telescope (CFHT, operated by the National Research Council of Canada, the Institut National des Sciences de l'Univers of the Centre National de la Recherche Scientifique of France, and the University of Hawaii), and at the Télescope Bernard Lyot (TBL at Observatoire du Pic du Midi, CNRS and Université de Toulouse, France).
- ... scenario
- For the 1.0 M
 , 1.5 M and 2 M models, the bump is located
around (L,
Teff, log g) = (43 L, 4580 K, 2.39), (75 L, 4640 K, 2.35)
and (120 L, 4670 K, 2.25), respectively, beyond the estimated location of HD 232 862.
, 1.5 M and 2 M models, the bump is located
around (L,
Teff, log g) = (43 L, 4580 K, 2.39), (75 L, 4640 K, 2.35)
and (120 L, 4670 K, 2.25), respectively, beyond the estimated location of HD 232 862.
All Tables
Table 1: List of the program stars.
Table 2: Log of our spectropolarimetric ESPaDOnS and NARVAL observations.
Table 3: Stellar parameters and lithium abundances for our sample stars, as derived from synthetic spectra.
Table 4:
B![]() values (in G) for the magnetic
field estimated in each individual observations of HD 232 862 and
KU Peg.
values (in G) for the magnetic
field estimated in each individual observations of HD 232 862 and
KU Peg.
All Figures
| |
Figure 1:
Spectral synthesis of our program stars (upper pannel):
observations (dotted line) in the Li line region (around
6707.8 Å, indicated with the vertical thin line) and their
associated synthetic spectra (full line) computed with the stellar
parameters reported in Table 3, the rotational velocity
values (see Table 1), and a microturbulence velocity sets
to 2.0
|
| Open with DEXTER | |
| In the text | |
| |
Figure 2:
HD 232 862: Least square deconvolved Zeeman signature
extracted from ESPaDOnS spectropolarimetric observation (December
07, 2006). A specific mask ( |
| Open with DEXTER | |
| In the text | |
| |
Figure 3:
HD 232 862: Time variation of Stokes V profiles
obtained from the LSD method (with a specific mask composed of
about 12 000 lines and computed with
T |
| Open with DEXTER | |
| In the text | |
| |
Figure 4: KU Peg: Least square deconvolved Zeeman signature extracted from NARVAL spectropolarimetric observation (September 05, 2007) (same as Fig. 2). |
| Open with DEXTER | |
| In the text | |
| |
Figure 5:
KU Peg: Time variation of Stokes V profiles obtained from
the LSD method (with a specific mask composed of about 12 000
lines and computed with
T |
| Open with DEXTER | |
| In the text | |
| |
Figure 6:
HD 21 018: Least square deconvolved Zeeman profile
performed in the spectropolarimetric observation of September 05,
2007. A specific mask (composed of about 12 000 lines) and
computed with
T |
| Open with DEXTER | |
| In the text | |
| |
Figure 7:
Position of HD 232 862 in the (log g,
T |
| Open with DEXTER | |
| In the text | |
| |
Figure 8:
Position of HD 21 018 and KU Peg in the
Hertzsprung-Russell diagram. Solid and dashed tracks were computed
at [Fe/H] = -0.15 (approximate metallicity of KU Peg) and [Fe/H] = 0.0 (metallicity of HD 21 018) respectively.
The long-dashed line
crossing through the tracks on the left indicates the beginning of
the first DUP for the models at [Fe/H] = -0.15. The dotted line on
the right indicates the location of maximum penetration (in mass)
of the convective envelope for these same tracks. The small
diamonds on the tracks indicate the location where
A |
| Open with DEXTER | |
| In the text | |
| |
Figure 9:
Position of KU Peg and HD 21 018 in the (log g,
T |
| Open with DEXTER | |
| In the text | |
Copyright ESO 2009
Current usage metrics show cumulative count of Article Views (full-text article views including HTML views, PDF and ePub downloads, according to the available data) and Abstracts Views on Vision4Press platform.
Data correspond to usage on the plateform after 2015. The current usage metrics is available 48-96 hours after online publication and is updated daily on week days.
Initial download of the metrics may take a while.