| Issue |
A&A
Volume 499, Number 1, May III 2009
|
|
|---|---|---|
| Page(s) | 331 - 335 | |
| Section | Celestial mechanics and astrometry | |
| DOI | https://doi.org/10.1051/0004-6361/200911714 | |
| Published online | 01 April 2009 | |
Determining the relativistic parameter  using
very long baseline interferometry
using
very long baseline interferometry
S. B. Lambert - C. Le Poncin-Lafitte
Observatoire de Paris, Département Systèmes de Référence Temps Espace (SYRTE), CNRS/UMR 8630, 75014 Paris, France
Received 23 January 2009 / Accepted 8 March 2009
Abstract
Aims. Relativistic bending in the vicinity of a massive body is characterized only by the post-Newtonian parameter ![]() within the standard parameterized post-Newtonian formalism, which is unity in General Relativity. To estimate this parameter, we use very long baseline interferometry (VLBI) to measure the gravitational deflection of radio waves by Solar System bodies emitted by distant compact radio sources.
within the standard parameterized post-Newtonian formalism, which is unity in General Relativity. To estimate this parameter, we use very long baseline interferometry (VLBI) to measure the gravitational deflection of radio waves by Solar System bodies emitted by distant compact radio sources.
Methods. We analyze geodetic VLBI observations recorded since 1979. We compare estimates of ![]() and errors obtained with various analysis schemes, including global estimations over several time spans and with various Sun elongation cut-off angles, and with analysis of radio source coordinate time series.
and errors obtained with various analysis schemes, including global estimations over several time spans and with various Sun elongation cut-off angles, and with analysis of radio source coordinate time series.
Results. We arrive at the conclusion that the relativistic parameter ![]() cannot be estimated at better than
cannot be estimated at better than
![]() .
The main factor of limitation is the uncertainty in determining of (global or session-wise) radio source coordinates. A sum of various instrumental and modeling errors and analysis strategy defects, which cannot be decorrelated and corrected yet, is at the origin of the limitating noise.
.
The main factor of limitation is the uncertainty in determining of (global or session-wise) radio source coordinates. A sum of various instrumental and modeling errors and analysis strategy defects, which cannot be decorrelated and corrected yet, is at the origin of the limitating noise.
Key words: astrometry - relativity - techniques: interferometric
1 Introduction
One of the cornerstones of test of general relativity (GR) is the measurement
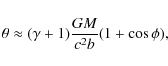
of light deflection in the vicinity of the Sun. In the parameterized
post-Newtonian (PPN) formalism (Will 1993), which contains 10 parameters, the
predicted angle of deflection ![]() is
is
 |
(1) |
where G is the Newtonian gravitational constant, c the speed of light in a vacuum, M the mass of the deflecting body, b the impact parameter (defined as the minimal distance of the ray to the center of mass of the deflecting body),
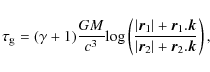
Very long baseline radio interferometry (VLBI) is sensitive to space-time
curvature through the gravitational time delay, given by (e.g., Finkelstein
et al. 1983)
 |
(2) |
where
![\begin{figure}
\par\includegraphics[width=9cm]{1714fig1.eps}\end{figure}](/articles/aa/full_html/2009/19/aa11714-09/img17.png) |
Figure 1:
Gravitational delay
|
| Open with DEXTER | |
VLBI has been used on a regular basis since the early 1980s for monitoring Earth orientation and estimating station displacements and extragalactic radio source coordinates at 2 and 8 GHz. The number of radio sources per session, as well as the data recording reliability, have drastically improved in the past decade. About 4000 diurnal session files, representing more than 5 million delays, are made available through the International VLBI Service for Geodesy and Astrometry (IVS, Schlüter & Behrend 2007) data base.
The large amount of data from the permanent geodetic VLBI program
can provide a number of tests of GR (Soffel et al. 1986). In the past
years, VLBI data were used in various attempts to determine ![]() .
Using less than 4 years of observations, Robertson & Carter (1984)
found
.
Using less than 4 years of observations, Robertson & Carter (1984)
found ![]() consistent with GR within 0.005. Using 10 years of
observations, Robertson et al. (1991) estimated a standard error of
0.002. Lebach et al. (1995) got
consistent with GR within 0.005. Using 10 years of
observations, Robertson et al. (1991) estimated a standard error of
0.002. Lebach et al. (1995) got
![]() after observations of the
relative deflection of 3C 273B and 3C 279. Shapiro et al. (2004) obtained
after observations of the
relative deflection of 3C 273B and 3C 279. Shapiro et al. (2004) obtained
![]() (statistical standard error) with VLBI observations
before 1999. The current best estimate of
(statistical standard error) with VLBI observations
before 1999. The current best estimate of ![]() ,
however,
was not obtained with VLBI: it is consistent with GR with an error
of
,
however,
was not obtained with VLBI: it is consistent with GR with an error
of
![]() ,
and was obtained by Bertotti et al. (2005) who
derived it from spacecraft tracking experiments.
,
and was obtained by Bertotti et al. (2005) who
derived it from spacecraft tracking experiments.
Errors reported in the various papers are often formal errors obtained from the propagation through the adjustment procedure of an initial SNR-derived standard error on the delays. They might therefore not directly compare to one another. Though all these works (except Bertotti et al.) deal with deflection of the radio waves by the Sun, it must be mentioned that special VLBI sessions were carried out to measure the deflection close to Jupiter or other planets (Schuh et al. 1988).
In this work, we estimate ![]() from routine geodetic VLBI
observations, using the additional 1999-2008 time period with respect
to Shapiro et al. We compare estimates and errors obtained over
several time spans and using various analysis schemes in order to
address the accuracy and to point out some systematics and limitations.
from routine geodetic VLBI
observations, using the additional 1999-2008 time period with respect
to Shapiro et al. We compare estimates and errors obtained over
several time spans and using various analysis schemes in order to
address the accuracy and to point out some systematics and limitations.
![\begin{figure}
\par\includegraphics[width=9cm]{1714fig2.eps}\end{figure}](/articles/aa/full_html/2009/19/aa11714-09/img21.png) |
Figure 2:
Observational history of the sources at less than 30 |
| Open with DEXTER | |
2 Close approaches to the Sun
A set of 3937 24-h geodetic VLBI sessions, consisting of about 4.5
million delays, will be fully or partly processed in the upcoming
analyses. During the period that covers 3 August 1979-28
August 2008, the VLBI observing schedule included a number of radio
sources that were observed at less than 15![]() to the Sun. As
it shows up in Fig. 2, this number was weak before 1984,
quite uniform during 1984-1996. Then it increased substantially
during 1996-2002. It is worth noting that 1992-1999, which contains a
number of close approaches, is a period of low solar activity. Since
2002, the scheduling software at the IVS coordinating center was set
with a minimal distance to the Sun at 15
to the Sun. As
it shows up in Fig. 2, this number was weak before 1984,
quite uniform during 1984-1996. Then it increased substantially
during 1996-2002. It is worth noting that 1992-1999, which contains a
number of close approaches, is a period of low solar activity. Since
2002, the scheduling software at the IVS coordinating center was set
with a minimal distance to the Sun at 15![]() .
Figure 2 naturally yields several time spans on which
the analyses can be done: 1979-2008, which is the maximum
number of available data; 1984-2008, which drops the early
VLBI network; 1996-2002, which
shows the highest density of close approaches; and 1984-2002, which
represents a compromise between a high density of close approaches
and a large amount of data. Additionally, we also consider 1979-1999,
as in Shapiro et al., in order to check that we are consistent
with their results. Finally, we would like to address two time
spans that cover periods of low and high solar activity.
It is nevertheless difficult to keep the same characteristics (number of
sessions, number of sources, density of close approaches) for these
two periods since the VLBI observing program undergoes continuous evolution.
We propose the three following time spans: 1994-1997,
1998-2002a (started 01/1998, and has approximately the same number of
sessions and sources as 1994-1997), and 1998-2002b (started 07/1998, and
has approximately the same number of delays as 1994-1997).
.
Figure 2 naturally yields several time spans on which
the analyses can be done: 1979-2008, which is the maximum
number of available data; 1984-2008, which drops the early
VLBI network; 1996-2002, which
shows the highest density of close approaches; and 1984-2002, which
represents a compromise between a high density of close approaches
and a large amount of data. Additionally, we also consider 1979-1999,
as in Shapiro et al., in order to check that we are consistent
with their results. Finally, we would like to address two time
spans that cover periods of low and high solar activity.
It is nevertheless difficult to keep the same characteristics (number of
sessions, number of sources, density of close approaches) for these
two periods since the VLBI observing program undergoes continuous evolution.
We propose the three following time spans: 1994-1997,
1998-2002a (started 01/1998, and has approximately the same number of
sessions and sources as 1994-1997), and 1998-2002b (started 07/1998, and
has approximately the same number of delays as 1994-1997).
All our VLBI delays were corrected from delay due to the
radio wave crossing of dispersive region in the signal propagation
path in a preliminary step that made use of 2 GHz and 8 GHz recordings.
Then, we only used the 8 GHz delays to fit the parameters listed in the
next section. In the case of targets that are close to the Sun, the
relevant dispersive regions are the Earth's ionosphere and the solar
coronal plasma. Although approximated, the model for plasma delay
correction as a function of electronic content and frequency should
lead to errors of a few picoseconds, following Lebach et al. (1995).
(The authors mentioned this magnitude for a period of low solar
activity. During periods of higher activity, the electronic content
can be several times higher.) The reader must therefore keep in mind this
order of magnitude when potential sources of limitation are
listed in later sections. Likewise, an error in the solar coronal
plasma delay correction would lead to a falsified estimate of ![]() ,
since the plasma-induced deflection would be absorbed there.
Rather than a relativistic parameter,
,
since the plasma-induced deflection would be absorbed there.
Rather than a relativistic parameter, ![]() would therefore be
simply considered as a ``deflection'' parameter.
would therefore be
simply considered as a ``deflection'' parameter.
Table 1:
Characteristics of the solutions and estimates of ![]() .
.
3 Data analysis and results
3.1 Global solutions
We run global solutions over these time spans.
In all these solutions, the Earth orientation parameters
and the station coordinates are estimated once per session, and
![]() is estimated as a global parameter. Source coordinates are also
estimated as global parameters without global constraint: the sources
are allowed to stay within circles of 10-8 rad diameter
around a priori positions. The choice of the a priori
catalogue for source coordinates is discussed later.
is estimated as a global parameter. Source coordinates are also
estimated as global parameters without global constraint: the sources
are allowed to stay within circles of 10-8 rad diameter
around a priori positions. The choice of the a priori
catalogue for source coordinates is discussed later.
Now, we quickly go into some technical characteristics of the solutions.
The cut-off elevation angle is set to 5![]() .
A priori zenith
delays are determined from local pressure values (Saastamoinen 1972),
which are then mapped to the elevation of the observation using the
Niell mapping function (Niell 1996). Zenith wet delays are estimated
as a continuous piecewise linear function at 20-min interval.
Troposphere gradients are estimated as 8-h east and north piecewise
functions at all stations except a set of 110 stations having poor
observational history. Station heights are corrected from atmospheric
pressure and oceanic tidal loading. The relevant loading quantities
are deduced from surface pressure grids from the US NCEP/NCAR
reanalysis project atmospheric global circulation model (Kalnay et al. 1996)
and from the GOT00.2 ocean tide model (Ray 1999; Petrov & Boy 2004).
No-net rotation constraint per session is applied to the positions of
all stations, excluding HRAS 085 (Fort Davis, Texas) and Fairbanks (Alaska)
because of strong non-linear displacements. (The latter site underwent
post-seismic relaxation effects after a large earthquake on the Denali fault
in 2003, cf. MacMillan & Cohen 2004; Titov & Tregoning 2004, 2005.)
All the calculations use the Calc 10.0/Solve 2006.06.08 geodetic VLBI
analysis software package and are carried out at the Paris
Observatory IVS Analysis Center (Gontier et al. 2008). Results are
reported in Table 1.
.
A priori zenith
delays are determined from local pressure values (Saastamoinen 1972),
which are then mapped to the elevation of the observation using the
Niell mapping function (Niell 1996). Zenith wet delays are estimated
as a continuous piecewise linear function at 20-min interval.
Troposphere gradients are estimated as 8-h east and north piecewise
functions at all stations except a set of 110 stations having poor
observational history. Station heights are corrected from atmospheric
pressure and oceanic tidal loading. The relevant loading quantities
are deduced from surface pressure grids from the US NCEP/NCAR
reanalysis project atmospheric global circulation model (Kalnay et al. 1996)
and from the GOT00.2 ocean tide model (Ray 1999; Petrov & Boy 2004).
No-net rotation constraint per session is applied to the positions of
all stations, excluding HRAS 085 (Fort Davis, Texas) and Fairbanks (Alaska)
because of strong non-linear displacements. (The latter site underwent
post-seismic relaxation effects after a large earthquake on the Denali fault
in 2003, cf. MacMillan & Cohen 2004; Titov & Tregoning 2004, 2005.)
All the calculations use the Calc 10.0/Solve 2006.06.08 geodetic VLBI
analysis software package and are carried out at the Paris
Observatory IVS Analysis Center (Gontier et al. 2008). Results are
reported in Table 1.
![\begin{figure}
\par\includegraphics[width=8cm]{1714fig3.eps}\includegraphics[width=8cm]{1714fig4.eps}\end{figure}](/articles/aa/full_html/2009/19/aa11714-09/img31.png) |
Figure 3:
Estimates of |
| Open with DEXTER | |
Since source coordinates are estimated during the analysis process, the
influence of the a priori catalogue on ![]() is expected to be negligible.
To check this, we ran the previous solutions several times, using several
a priori catalogues. All of them were obtained after a global inversion
of data over 1984-2008, wherein the celestial reference frame was maintained
by applying a no-net rotation constraint on the coordinates on a well-chosen
subset of sources that defines the axes of the International Celestial
Reference System (ICRS, Feissel & Mignard 1997). Several subsets
achieve this goal (Ma et al. 1998; Feissel-Vernier 2003; Feissel-Vernier et al. 2006; Lambert & Gontier 2009), and insure an alignment of the output catalogue onto the ICRS within 0.05 mas. (The latter nevertheless decreases
this value below 0.02 mas.) It finally appeared that the sensitivity of
estimated
is expected to be negligible.
To check this, we ran the previous solutions several times, using several
a priori catalogues. All of them were obtained after a global inversion
of data over 1984-2008, wherein the celestial reference frame was maintained
by applying a no-net rotation constraint on the coordinates on a well-chosen
subset of sources that defines the axes of the International Celestial
Reference System (ICRS, Feissel & Mignard 1997). Several subsets
achieve this goal (Ma et al. 1998; Feissel-Vernier 2003; Feissel-Vernier et al. 2006; Lambert & Gontier 2009), and insure an alignment of the output catalogue onto the ICRS within 0.05 mas. (The latter nevertheless decreases
this value below 0.02 mas.) It finally appeared that the sensitivity of
estimated ![]() to the chosen set of defining sources and to the a priori
catalogue is at the level of 10-8, which is not statistically
significant.
to the chosen set of defining sources and to the a priori
catalogue is at the level of 10-8, which is not statistically
significant.
We wondered whether the fit could be improved by removing data from
sources having a poor observational history (e.g., less than 2 observations
or observed in less than 3 sessions). We therefore ran all the above
solutions one more time after having downgraded about 200 sources as
session parameters and suppressed the delays from another 100. The final
post-fit root mean square (rms) and normalized reduced ![]() per degree
of freedom (
per degree
of freedom (![]() )
were not changed significantly. (The
)
were not changed significantly. (The ![]() is
output by the VLBI analysis software and reflects the goodness of the fit
of the solution, including all adjusted parameters.) The influence on
is
output by the VLBI analysis software and reflects the goodness of the fit
of the solution, including all adjusted parameters.) The influence on
![]() estimates was only noticed at the level of 10-6, which appears
to be non statistically significant, following the standard errors reported
in Table 1.
estimates was only noticed at the level of 10-6, which appears
to be non statistically significant, following the standard errors reported
in Table 1.
The post-fit rms delay of the solutions ranges from 25-28 ps,
Such an rms corresponds to a rough expected accuracy of 0.27 mas in
terms of individual source positioning. One can readily see that,
assuming such a measurement error on the direction of a grazing ray,
one can expect an error
![]() not lower than
not lower than
![]() .
This
is confirmed by the standard errors reported in Table 1.
.
This
is confirmed by the standard errors reported in Table 1.
![\begin{figure}
\par\includegraphics[width=7.8cm]{1714fig5.eps}\includegraphics[width=7.8cm]{1714fig6.eps}\end{figure}](/articles/aa/full_html/2009/19/aa11714-09/img35.png) |
Figure 4: (Left) Session-wise coordinates of 0229+131. (Right) Least-squares spectrum. |
| Open with DEXTER | |
The solutions over 1979-1999, 1979-2008, 1984-2002, and
1984-2008, which include a large number of sessions and delays
and which all have ![]() larger than 0.86, all result in estimates of
larger than 0.86, all result in estimates of
![]() consistent with GR within
consistent with GR within
![]() .
Using the
sessions after 2002 or before 1979, which do not contain close approaches
below 15
.
Using the
sessions after 2002 or before 1979, which do not contain close approaches
below 15![]() ,
makes the estimate of
,
makes the estimate of ![]() depart from unity at
the level of
depart from unity at
the level of ![]() .
Incidentally, the solution over 1979-1999 confirms
the analysis of Shapiro et al. with a slightly lower formal error that may
originate from a different analysis strategy and a different observational
data set.
.
Incidentally, the solution over 1979-1999 confirms
the analysis of Shapiro et al. with a slightly lower formal error that may
originate from a different analysis strategy and a different observational
data set.
Although they have a similar number of observations or sessions, solutions
over 1998-2002(a,b) bring a substantially higher standard error than
1994-1998. Moreover, for 1994-1998, estimate of ![]() appears to be
lower than 1, whereas it is larger for 1998-2002(a,b). It indicates that
the bending of sources is higher in the second case. Intense solar
activity during this period could be at the origin of the
discrepancy: during periods of high activity, the higher electronic
content results in a higher deflection of radio waves. The absence in the
software of a specific modeling of solar plasma effects and the strong
correlation of an uncorrected plasma-induced bending with the relativistic
deflection prevent these two phenomena from being separated.
appears to be
lower than 1, whereas it is larger for 1998-2002(a,b). It indicates that
the bending of sources is higher in the second case. Intense solar
activity during this period could be at the origin of the
discrepancy: during periods of high activity, the higher electronic
content results in a higher deflection of radio waves. The absence in the
software of a specific modeling of solar plasma effects and the strong
correlation of an uncorrected plasma-induced bending with the relativistic
deflection prevent these two phenomena from being separated.
3.2 Dependence on the elongation angle
To address the problem of the elongation angle to the Sun, we ran
several solutions with an increasing cut-off angle, removing sources below
successive thresholds up to 40![]() .
We applied this analysis scheme
over several time spans (Fig. 3). For 1984-2002, a
substantial degradation of the estimates occurs beyond 25
.
We applied this analysis scheme
over several time spans (Fig. 3). For 1984-2002, a
substantial degradation of the estimates occurs beyond 25![]() ,
in agreement with similar tests in Shapiro et al. A bump reaches a
maximum around 60
,
in agreement with similar tests in Shapiro et al. A bump reaches a
maximum around 60![]() and then estimates of
and then estimates of ![]() approach
unity. We ran a similar analysis over 2000-2008 because it
constitutes a data set decorrelated from the one used by Shapiro et al.
(allowing for the fact that (i) a part of the observed sources and observing
antennas are the same in both data sets, (ii) the latter contains substantially
less sessions than the former). The bump also shows up when
using this data set.
approach
unity. We ran a similar analysis over 2000-2008 because it
constitutes a data set decorrelated from the one used by Shapiro et al.
(allowing for the fact that (i) a part of the observed sources and observing
antennas are the same in both data sets, (ii) the latter contains substantially
less sessions than the former). The bump also shows up when
using this data set.
We also checked what happens at short elongation angles over 1984-2002,
1994-1998, and 1998-2002. Below 25![]() ,
the deviation from unity
stays within the error bars with non statistically significant variations.
For shorter solutions, estimates rapidly degrade beyond an elongation
cut-off of a few degrees. For 1994-1998 and 1998-2002, the
degradation occurs in opposite directions. Estimates of
,
the deviation from unity
stays within the error bars with non statistically significant variations.
For shorter solutions, estimates rapidly degrade beyond an elongation
cut-off of a few degrees. For 1994-1998 and 1998-2002, the
degradation occurs in opposite directions. Estimates of ![]() appear to be lower than 1 in the former case, while
they are larger in the latter, consistently with the global
estimates of
appear to be lower than 1 in the former case, while
they are larger in the latter, consistently with the global
estimates of ![]() over the same time periods shown in Table 1.
The possible reason of such differences has already been addressed.
over the same time periods shown in Table 1.
The possible reason of such differences has already been addressed.
3.3 Approach based on radio source coordinate time series
Estimating session-wise coordinates of sources can also be a way of looking at a possible deflection when the sources travel in the vicinity of the Sun. An uncorrected bending should appear as an annual signal in coordinate time series.
Among the observed sources, only two have close approaches below
2![]() and are observed in more than 500 sessions. Both cases
are similar, but we only treat the source that has the longest
observational history:
0229+131 (quasar 4C 13.14). We obtained a coordinate time series
using the analysis strategy of Sect. 3.1, except that
and are observed in more than 500 sessions. Both cases
are similar, but we only treat the source that has the longest
observational history:
0229+131 (quasar 4C 13.14). We obtained a coordinate time series
using the analysis strategy of Sect. 3.1, except that
![]() is now fixed to 1, and coordinates of 0229+131 are
estimated per session. The closest approach to the Sun is
is now fixed to 1, and coordinates of 0229+131 are
estimated per session. The closest approach to the Sun is
![]() 1.5
1.5![]() .
At that time, the expected deviation,
following Eq. (1), is
.
At that time, the expected deviation,
following Eq. (1), is ![]() 0.3
0.3
![]() .
When parameter
.
When parameter
![]() is fixed to unity,
this deflection is already corrected and will not show up in the
coordinate time series. The obtained right ascension and declination
time series are displayed in Fig. 4. The spectrum does
not show any significant peak at annual period, indicating that no
extra deflection is detectable. Assuming a hypothetical deviation
of
is fixed to unity,
this deflection is already corrected and will not show up in the
coordinate time series. The obtained right ascension and declination
time series are displayed in Fig. 4. The spectrum does
not show any significant peak at annual period, indicating that no
extra deflection is detectable. Assuming a hypothetical deviation
of ![]() of
of
![]() ,
the incremental deflection
would be as drawn in Fig. 5. Peaking at
,
the incremental deflection
would be as drawn in Fig. 5. Peaking at ![]() 0.03 mas,
it is therefore not detectable in the spectrum. It follows that
examination of coordinate time series for 0229+131 can only
constrain
0.03 mas,
it is therefore not detectable in the spectrum. It follows that
examination of coordinate time series for 0229+131 can only
constrain ![]() to be close to unity at approximately
the same level of accuracy as already obtained from global estimates.
to be close to unity at approximately
the same level of accuracy as already obtained from global estimates.
The evolution in source structure can show up in coordinate time series at lower frequencies as medium or long-term patterns (a few months to years), like the slight curvature showing up in right ascension plotted in Fig. 4. For information about relations between source structure and coordinate time series, the reader can refer to, e.g., Fey et al. (1997), which treats the case of the quasar 4C 39.25.
4 Discussion and conclusion
We have used several methods to look for radio wave
deflection in the vicinity of the Sun, starting from a 30-yr routine
geodetic VLBI observational data base. We interpret this deflection
in terms of gravitational bending, as expressed in Eq. (1). Using
several strategies and various data sets covering different time spans,
we arrived at the conclusion that ![]() is unity within
is unity within
![]() .
The estimate of
.
The estimate of ![]() can even reach values close to
unity by
can even reach values close to
unity by
![]() when the time span is limited to 1984-2002,
i.e., to sessions containing observations of sources at less than 15
when the time span is limited to 1984-2002,
i.e., to sessions containing observations of sources at less than 15![]() to the Sun. Although decreasing the formal error due to a larger number
of observations, using longer time spans makes the estimates depart from
unity by about
to the Sun. Although decreasing the formal error due to a larger number
of observations, using longer time spans makes the estimates depart from
unity by about ![]() .
.
The main limiting factor is the uncertainty in determinating of
(global or session-wise) radio source coordinates.
Causes of this uncertainty have been addressed in various works
(see, e.g., Ma et al. 1998; Gontier et al. 2001). The
VLBI-derived apparent position of a source may change with the
global orientation and shape of the antenna array when the structure
of the source is extended or not circular. Using Very Long Baseline
Array (VLBA) maps at 2 and 8 GHz, Fey & Charlot (1997) provided estimates
of the structure delay arising from the extended character of the source.
In our example of Sect. 3.3, the structure of 0229+131 is
expected to bring an extra delay below 3 ps, let 0.03 mas
(see also Ma & Feissel 1997), which partially explains the noise
level observed in Fig. 4. It turns out that, in the absence
of a direct correction of the delay, based on, e.g., instantaneous maps
of the source, the accuracy of ![]() estimates from time series
analysis cannot be better than 10-4.
estimates from time series
analysis cannot be better than 10-4.
Other potential sources of error are the mismodeling of the propagation delay through the troposphere, as well as deficiencies in the network (e.g., change of geometry and performances from one session to another, dissymmetry between north and south hemispheres). The amplitude of the noise that emerges from them remains difficult to quantify precisely at this time. It is generally admitted that it is as large as the effect of source structure.
Derivation of radio source coordinate time series implies
a robust maintenance of the celestial and terrestrial reference frames,
so that frame effects do not introduce spurious perturbations of the
estimated coordinates. During the derivation process, we checked
various analysis strategies and noticed that, when the celestial
frame is not sufficiently maintained (e.g., when too few sources are
constrained by the NNR), a semi-annual peak could appear at ![]() .
In a similar way, fixing the station coordinates to their ITRF values
introduces an annual term at the same level. These spurious peaks, which
could lead to erroneous physical interpretations in the present context,
are good illustrations of the sensitivity of VLBI to reference frames.
.
In a similar way, fixing the station coordinates to their ITRF values
introduces an annual term at the same level. These spurious peaks, which
could lead to erroneous physical interpretations in the present context,
are good illustrations of the sensitivity of VLBI to reference frames.
Although the mismodeling of the solar corona contribution to
light scattering and bending is neglected for geodetic purposes when radio
sources are observed at large elongations to the Sun,
it becomes crippling for tests of GR since
observers do need to observe as close as possible to the Sun. From
Sect. 3.1, we tend to conclude that fluctuations in solar
coronal plasma limit the accuracy of ![]() estimates at the same
level of the sources of error listed above. Thus, various instrumental
and modeling errors and analysis strategy defects,
that cannot be decorrelated and corrected yet, explain the current
limitation of VLBI for estimating
estimates at the same
level of the sources of error listed above. Thus, various instrumental
and modeling errors and analysis strategy defects,
that cannot be decorrelated and corrected yet, explain the current
limitation of VLBI for estimating ![]() .
.
![\begin{figure}
\par\includegraphics[width=7.8cm]{1714fig7.eps}\end{figure}](/articles/aa/full_html/2009/19/aa11714-09/img41.png) |
Figure 5:
Theoretical extra deflection from GR model for
0229+131 for
|
| Open with DEXTER | |
Compared to the error reported in Shapiro et al., we do not consider that
we have substantially improved the determination of ![]() .
The slight gain in accuracy can be attributed to the
extra years of data (1999-2008), of which the first 4 years (1999-2002)
are rich in close approaches, along with the improvement in the quality
of the VLBI network and observations during this time. Our work nevertheless
constitutes an independent check and provides some qualitative insight
into systematics that show up in the analyses of the current geodetic VLBI
observational database.
.
The slight gain in accuracy can be attributed to the
extra years of data (1999-2008), of which the first 4 years (1999-2002)
are rich in close approaches, along with the improvement in the quality
of the VLBI network and observations during this time. Our work nevertheless
constitutes an independent check and provides some qualitative insight
into systematics that show up in the analyses of the current geodetic VLBI
observational database.
To conclude, we wish to mention that, although current VLBI appears not to
be competitive with spacecraft systems for relativistic experiments, the
huge number of VLBI measurements, in all directions and at several
epochs, constitutes an interesting potential for testing other
theories than the PPN formalism, as for example the scenario of
Jaeckel & Reynaud (2006) where parameter ![]() is replaced by a
function depending on the elongation angle.
is replaced by a
function depending on the elongation angle.
Acknowledgements
We are grateful to Drs. Anne-Marie Gontier and Peter Wolf (Observatoire de Paris) for useful discussions about possible tests. We thank Prof. Harald Schuh for his review that helped in improving the paper. This study could not have been carried out without the work of the International VLBI Service for Geodesy and Astrometry (IVS) community that coordinates observations and correlates and stores geodetic VLBI data.
References
- Bertotti, B., Iess, L., & Tortora, P. 2003, Nature, 425, 374 [NASA ADS] [CrossRef]
- Clette, F., Berghmans, P., Vanlommel, P., et al. 2007, Adv. Sp. Res., 40, 919 [NASA ADS] [CrossRef] (In the text)
- Damour, T., & Polyakov, A. M. 1994, Nuclear Phys. B, 423, 532 [NASA ADS] [CrossRef] (In the text)
- Damour, T., Piazza, F., & Veneziano, G. 2002, Phys. Rev. D, 66, 046007 [NASA ADS] [CrossRef] (In the text)
- Feissel, M., & Mignard, F. 1997, A&A, 331, 33 (In the text)
- Feissel-Vernier, M. 2003, A&A, 403, 105 [NASA ADS] [CrossRef] [EDP Sciences] (In the text)
- Feissel-Vernier, M., Ma, C., Gontier, A.-M., & Barache, C. 2006, A&A, 452, 1107 [NASA ADS] [CrossRef] [EDP Sciences] (In the text)
- Fey, A. L., & Charlot, P. 1997, ApJS, 111, 95 [NASA ADS] [CrossRef] (In the text)
- Fey, A. L., Eubanks, T. M., & Kingham, K.A. 1997, AJ, 114, 2284 [NASA ADS] [CrossRef] (In the text)
- Finkelstein, A. M., Kreinovich, V. Ia., & Pandey, S. N. 1983, Ap&SS, 94, 233 [NASA ADS] [CrossRef] (In the text)
- Gontier, A.-M., Le Bail, K., Feissel, M., & Eubanks, T. M. 2001, A&A, 375, 661 [NASA ADS] [CrossRef] [EDP Sciences]
- Gontier, A.-M., Lambert, S. B., & Barache, C. 2008, in International VLBI Service for Geodesy and Astrometry (IVS) 2007 Annual Report, ed. D. Behrend, & K. D. Baver NASA/TP-2008-214162, 224 (In the text)
- Jaeckel, M.-T., & Reynaud, S. 2006, Class. Quantum Grav., 23, 777 [NASA ADS] [CrossRef] (In the text)
- Kalnay, E., Kanamitsu, M., Kistler, R., et al. 1996, Bull. Am. Met. Soc., 77, 437 [CrossRef] (In the text)
- Lambert, S. B., & Gontier, A.-M. 2009, A&A, 493, 317 [NASA ADS] [CrossRef] [EDP Sciences] (In the text)
- Lebach, D. E., Corey, B. E., Shapiro, I. I., et al. 1995, Phys. Rev. Lett., 75, 1439 [NASA ADS] [CrossRef] (In the text)
- Le Poncin-Lafitte, C., & Teyssandier, P. 2008, Phys. Rev. D, 77, 044029 [NASA ADS] [CrossRef] (In the text)
- Ma, C., & Feissel, M. 1997, International Earth Rotation Service (IERS) Technical Note 23, Observatoire de Paris (In the text)
- Ma, C., Arias, E. F., Eubanks, T. M., et al. 1998, AJ, 116, 516 [NASA ADS] [CrossRef] (In the text)
- MacMillan, D. S., & Cohen, S. 2004, in Geodesy and Astrometry (IVS) 2004 General Meeting Proceedings, ed. N. R. Vandenberg, & K. D. Baver, NASA/CP-2004-212255, 491 (In the text)
- Misner, C. W., Thorne, K. S., & Wheeler, J. A. 1973, (San Francisco: W.H. Freeman and Co.) (In the text)
- Niell, A. E. 1996, J. Geophys. Res., 101(B2), 3227 (In the text)
- Petrov, L., & Boy, J.-P. 2004, J. Geophys. Res., 109, 3405 [CrossRef] (In the text)
- Ray, R. D. 1999, in NASA Technical Memorandum, NASA/TM-1999-209478, National Aeronautics and Space Administration (NASA), Goddard Space Flight Center, Greenbelt, MD (In the text)
- Robertson, D. S., & Carter, W. E. 1984, Nature, 310, 572 [NASA ADS] [CrossRef] (In the text)
- Robertson, D. S., Carter, W. E., & Dillinger, W. H. 1991, Nature, 349, 768 [NASA ADS] [CrossRef] (In the text)
- Saastamoinen, J. 1972, in The Use of Artificial Satellites for Geodesy, Geophysics Monograph Series, Washington, ed. W. Soren et al. (DC: American Geophysical Union), 15, 247 (In the text)
- Schlüter, W., & Behrend, D. 2007, J. Geod., 81, 479 [CrossRef] (In the text)
- Schuh, H., Fellbaum, M., Campbell, J., et al. 1988, Phys. Lett. A, 129, 299 [NASA ADS] [CrossRef] (In the text)
- Shapiro, S. S., Davis, J. L., Lebach, D. E., & Gregory, J. S. 2004, Phys. Rev. Lett., 92, 121101 [NASA ADS] [CrossRef] (In the text)
- Soffel, M., Ruder, H., Schneider, M., et al. 1986, in Relativity in Celestial Mechanics and Astrometry, ed. J. Kovalevsky, & V. A. Brumberg (Reidel), Proc. IAU Symp., 114, 277 (In the text)
- Titov, O., & Tregoning, P. 2004, in N. R. Vandenberg, K. D. Baver, Service for Geodesy and Astrometry (IVS) 2004 General Meeting Proceedings, NASA/CP-2004-212255, 496 (In the text)
- Titov, O., & Tregoning, P. 2005, J. Geod., 79, 196 [NASA ADS] [CrossRef] (In the text)
- Will, C. M. 1993, Theory and Experiment in Gravitational Physics, Cambridge (UK: Cambridge University Press) (In the text)
All Tables
Table 1:
Characteristics of the solutions and estimates of ![]() .
.
All Figures
| |
Figure 1:
Gravitational delay
|
| Open with DEXTER | |
| In the text | |
| |
Figure 2:
Observational history of the sources at less than 30 |
| Open with DEXTER | |
| In the text | |
| |
Figure 3:
Estimates of |
| Open with DEXTER | |
| In the text | |
| |
Figure 4: (Left) Session-wise coordinates of 0229+131. (Right) Least-squares spectrum. |
| Open with DEXTER | |
| In the text | |
| |
Figure 5:
Theoretical extra deflection from GR model for
0229+131 for
|
| Open with DEXTER | |
| In the text | |
Copyright ESO 2009
Current usage metrics show cumulative count of Article Views (full-text article views including HTML views, PDF and ePub downloads, according to the available data) and Abstracts Views on Vision4Press platform.
Data correspond to usage on the plateform after 2015. The current usage metrics is available 48-96 hours after online publication and is updated daily on week days.
Initial download of the metrics may take a while.