A&A 461, 707-722 (2007)
DOI: 10.1051/0004-6361:20066035
Solar CIV vacuum-ultraviolet Fabry-Perot interferometers
G. A. Gary1
- E. A. West1
- D. Rees2
- J. A. McKay3
- M. Zukic4
- P. Herman5
1 - National Space Science and Technology Center (NSSTC),
Marshall Space Flight Center (MSFC), Huntsville, AL, 35812, USA
2 -
Hovemere Ltd., Sevenoaks, Kent, TN145HD, UK
3 -
Remote Sensor Concepts, Washington, DC, 20010, USA
4 -
Cascade Optical Corporation, Santa Ana, CA, 92705, USA
5 -
Department of Electrical and Computer Engineering, University of Toronto, Toronto, Ontario, M5S-3G4, Canada
Received 13 July 2006 / Accepted 23 September 2006
Abstract
Aims. A tunable, high spectral resolution, high effective finesse, vacuum ultraviolet (VUV) Fabry-Perot interferometer (FPI) is designed for obtaining narrow-passband images, magnetograms, and Dopplergrams of the transition region emission line of CIV (155 nm).
Methods. The integral part of the CIV narrow passband filter package (with a 2-10 pm FWHM) consists of a multiple etalon system composed of a tunable interferometer that provides high-spectral resolution and a static low-spectral resolution interferometer that allows a large effective free spectral range. The prefilter for the interferometers is provided by a set of four mirrors with dielectric high-reflective coatings. A tunable VUV piezoelectric-control interferometer has undergone testing using the surrogate F2 eximer laser line at 157 nm for the CIV line. We present the results of these tests with a description of the overall concept for a complete narrow-band CIV spectral filter. The static interferometer of the filter will be built using a set of fixed MgF2 plates. The four-mirror prefilter is designed to have dielectric multilayer  -stacks employing the concept used in the Ultraviolet Imager of NASA's Polar Spacecraft. A 10-pm dual etalon system allows the effective free spectral range to be commensurate with the prefilter profile. With an additional etalon, a triple etalon system would allow a spectrographic resolution of 2 pm. The basic strategy has been to combine the expertise of spaceflight etalon manufacturing with VUV coating technology to build a VUV FPI which combines the best attributes of imagers and spectrographs into a single compact instrument.
Results. High spectral-resolution spectro-polarimetry observations of the transition region CIV emission can be performed to increase our understanding of the magnetic forces, mass motion, evolution, and energy release within the solar atmosphere at the base of the corona where most of the magnetic field is approximately force-free. The 2D imaging of the full vector magnetic field at the height of maximum magnetic influence (minimum plasma beta) can be accomplished, albeit difficult, by measuring the Zeeman splitting of the CIV resonance pair. Designs of multiple VUV FPIs can be developed for integration into future orbiting solar observatories to obtain rapid cadence, spectral imaging of the transition region.
Key words: Sun: transition region - Sun: UV radiation - instrumentation: interferometers - space vehicles: instrument - techniques: spectroscopic
Within solar physics and astrophysics, a major goal is to understand
the magnetic forces, evolution, and energy release within the
solar and stellar atmospheres. Events from the sun drives space
weather which has significant influences on our technologically-dependent
society and space initiatives. The observation and analysis of
the transition region (TR, the interface between the chromosphere
and the corona) is important in the physical understanding of
the solar atmosphere and its ubiquitous magnetic field. The ultraviolet
resonance emission lines of CIV ( 155 nm) are formed in
the middle of the TR at a temperature of 100 000 K. A CIV narrow-passband
filter will provide critical instrumentation for these solar
TR observations. Using this filter with a polarimeter, the magnetic
structure, mass motion, and morphology within the transition
region can be studied. Although difficult, the measurement of
the full vector magnetic field at the height of maximum magnetic
influence (minimum plasma beta) can be accomplished by measuring
the Zeeman splitting of the CIV resonance pair. Previous observations
of this doublet resonance line have either been with scanning
spectrographs or broadband filters with their inherent limitations
in simultaneity and spectral purity.
155 nm) are formed in
the middle of the TR at a temperature of 100 000 K. A CIV narrow-passband
filter will provide critical instrumentation for these solar
TR observations. Using this filter with a polarimeter, the magnetic
structure, mass motion, and morphology within the transition
region can be studied. Although difficult, the measurement of
the full vector magnetic field at the height of maximum magnetic
influence (minimum plasma beta) can be accomplished by measuring
the Zeeman splitting of the CIV resonance pair. Previous observations
of this doublet resonance line have either been with scanning
spectrographs or broadband filters with their inherent limitations
in simultaneity and spectral purity.
We present the design of a multiple-etalon vacuum-ultraviolet
Fabry-Perot interferometer (VUV FPI) which can be integrated
within the future orbiting solar observatories. The VUV FPI combines
the best attributes of a spectrograph and an imager in a compact
and versatile instrument. The instrument reported here shows
the proof-of-concept of a high-spectral-resolution, high-finesse
VUV FPI for obtaining narrow-passband images, magnetograms, and
Dopplergrams of CIV. (Finesse
is defined by the ratio of the free spectral range ( )
to the spectral resolution
(full-width at half maximum, FWHM)). We further present two complete
design concepts for the CIV narrow passband filter with a spectral resolution of
)
to the spectral resolution
(full-width at half maximum, FWHM)). We further present two complete
design concepts for the CIV narrow passband filter with a spectral resolution of
 pm and 2 pm FWHM and a
resolving power of
pm and 2 pm FWHM and a
resolving power of
 and
77 500, respectively. The dual etalon system (
pm) consisting of three sub-elements: (1) a scanning high-resolution
interferometer (HRI) providing a high-resolution passband, (2)
a static (fixed gap) low-resolution interferometer (LRI) providing the system
with a larger effective free spectral range (), and (3) four
reflective interference filters performing as a prefilter. A
triple system (
and
77 500, respectively. The dual etalon system (
pm) consisting of three sub-elements: (1) a scanning high-resolution
interferometer (HRI) providing a high-resolution passband, (2)
a static (fixed gap) low-resolution interferometer (LRI) providing the system
with a larger effective free spectral range (), and (3) four
reflective interference filters performing as a prefilter. A
triple system (
 pm) would have
an additional HRI. The test results of the Marshall Space Flight
Center's (MSFC) 10 pm HRI are given in Sect. 4 for the piezoelectric-controlled
etalon (Fig. 1). The prefilter design,
composed of four mirrors with dielectric multilayer stacks,
follows the coating design of the orbiting Ultraviolet Imager
(UVI) (Zukic et al. 1993). A two etalon design allows the effective
free spectral range to be commensurate with the prefilter spectral
width as described below.
pm) would have
an additional HRI. The test results of the Marshall Space Flight
Center's (MSFC) 10 pm HRI are given in Sect. 4 for the piezoelectric-controlled
etalon (Fig. 1). The prefilter design,
composed of four mirrors with dielectric multilayer stacks,
follows the coating design of the orbiting Ultraviolet Imager
(UVI) (Zukic et al. 1993). A two etalon design allows the effective
free spectral range to be commensurate with the prefilter spectral
width as described below.
![\begin{figure}
\par\includegraphics[width=7.2cm]{6035fg01.eps} \end{figure}](/articles/aa/full/2007/02/aa6035-06/Timg21.gif) |
Figure 1:
Internal view of the MSFC/Hovemere CIV scanning FPI
which incorporates (Cascade Optical Corporation) VUV coating technology with
a resolving power of 22,100. This could be used as one element
for the high resolution interferometer for a multiple Fabry-Perot
etalon spectral filter for CIV described in the text. The interferometer
length is 150 mm.
|
| Open with DEXTER |
The spectral filter system can provide a 3D data cube that combines
a 2D field of view with non-sequential spectral scanning at selective
steps through the lines of CIV. The multiple etalon Fabry-Perot
filter systems described here are designed specifically for the
transition region CIV emission line pair at 154.821/155.077 nm
(2s2S
 -2p2P
-2p2P
 / 2s2S
-2p2P
/ 2s2S
-2p2P
 )
(Fig. 2). This strong CIV resonance line pair, associated with
104K plasma at an effective parallel-atmosphere height of 2000 km (Fig. 3),
is Zeeman sensitive with effective Lande-g values of
)
(Fig. 2). This strong CIV resonance line pair, associated with
104K plasma at an effective parallel-atmosphere height of 2000 km (Fig. 3),
is Zeeman sensitive with effective Lande-g values of
 ,
and has a profile half-width of 130-275 pm (Peter
2002). For a magnetic field strength of 1000G, the Zeeman splitting
is 0.15 pm for 155.08 nm. Because of the small splitting, Stokes
polarimetric scans of the line are employed to derive the magnetic
field. The CIV characteristics and spectral purity provide important
line diagnostics for analysis of the transition region. With
high throughput, narrow-band spectral imagery offers the advantage
of avoiding spectrographic rastering and allows precise and simultaneous
2D context imaging. The observation of the highly dynamic, non-equilibrium
thermodynamic transition region of the solar atmosphere requires
rapid 3D-imaging spectrometry and magnetography.
These short dynamic time scales are 10 s for CIV waves (DeForest 2005),
120 s for blinkers (Madjarska & Doyle 2000), 200 s for coronal loop
oscillations (De Pontieu et al. 2003), and a few minutes for spicules (Xia et al. 2004).
For example, the plasma sprays or spicules rise up from the photosphere through
the chromosphere into the transition region (TR) along flux tubes
as extremely inhomogeneous and dynamic small-scale activity.
Assuming an appropriate size telescope, the non-sequential stepping
pattern of a filter with a minimum number of steps provides a
rapid cadence compatible with these events. Such small-scale
dynamics in the lower solar atmosphere is related to coronal
heating, convection, waves, and mass loss. For another example
of the dynamics of the TR, rapid magnetic reconnection has been
associated with both types of C IV brightenings: the impulsive
brightenings (without line broadenings and near magnetic inversion
lines) and the explosive events (with line broadenings and associated
with weak magnetic fields) (Porter et al. 1987; Porter & Dere
1991; Dere et al. 1991; Chae et al. 1998).
,
and has a profile half-width of 130-275 pm (Peter
2002). For a magnetic field strength of 1000G, the Zeeman splitting
is 0.15 pm for 155.08 nm. Because of the small splitting, Stokes
polarimetric scans of the line are employed to derive the magnetic
field. The CIV characteristics and spectral purity provide important
line diagnostics for analysis of the transition region. With
high throughput, narrow-band spectral imagery offers the advantage
of avoiding spectrographic rastering and allows precise and simultaneous
2D context imaging. The observation of the highly dynamic, non-equilibrium
thermodynamic transition region of the solar atmosphere requires
rapid 3D-imaging spectrometry and magnetography.
These short dynamic time scales are 10 s for CIV waves (DeForest 2005),
120 s for blinkers (Madjarska & Doyle 2000), 200 s for coronal loop
oscillations (De Pontieu et al. 2003), and a few minutes for spicules (Xia et al. 2004).
For example, the plasma sprays or spicules rise up from the photosphere through
the chromosphere into the transition region (TR) along flux tubes
as extremely inhomogeneous and dynamic small-scale activity.
Assuming an appropriate size telescope, the non-sequential stepping
pattern of a filter with a minimum number of steps provides a
rapid cadence compatible with these events. Such small-scale
dynamics in the lower solar atmosphere is related to coronal
heating, convection, waves, and mass loss. For another example
of the dynamics of the TR, rapid magnetic reconnection has been
associated with both types of C IV brightenings: the impulsive
brightenings (without line broadenings and near magnetic inversion
lines) and the explosive events (with line broadenings and associated
with weak magnetic fields) (Porter et al. 1987; Porter & Dere
1991; Dere et al. 1991; Chae et al. 1998).
![\begin{figure}
\par\includegraphics[width=7cm]{6035fg02.eps} \end{figure}](/articles/aa/full/2007/02/aa6035-06/Timg26.gif) |
Figure 2:
The CIV resonance line pair at 154.82 nm and 155.08 nm showing the 1 to 2/3 ratio in peak intensity. The NRL HRTS
(21 July, 1975) active region scan is plotted at 1.5 pm steps.
|
| Open with DEXTER |
From the photosphere to the transition region,
the plasma beta parameter ( ,
the ratio of the gas pressure
to the magnetic pressure) decreases by a factor 104
(Gary 2001). The Alfven wave velocity increases by a factor of
102 inferring a significant decrease in the response
time to magnetic reconnection events. For a third example of
the rapid variability of the TR, recent Fourier analysis of the
CIV TRACE data has weakly indicated waves in the 100 mHz (10s
period) range, coming possibly from small-scale reconnection
or chromospheric shocks (DeForest 2004). Insight into the basic
mechanism responsible for these fundamental solar phenomena requires
specific diagnostic techniques to refine and infer the physical
properties of this region. Such systematic and random velocity
fields broaden and shift the line profile. Observing the upward
propagation of mechanical energy and its dissipation is key to
understanding the energy balance of the solar atmosphere. A high-throughput
VUV FPI can provide rapid 3D-imaging spectroscopy that is needed
to understand the overall physics, such as, (i) the dissipation
of mechanical energy carried upward from the convection zone
and dissipation of energy stored in the magnetic field, (ii)
the regime and location of each kind of heating, (iii) the complex
velocity field in the transition region, (iv) the role of the
magnetic field in heating at various heights, and (v) the distinctive
structures of the transition region. A CIV VUV FPI can provide
images, Doppler velocities, and magnetic field measurements simultaneously
for correlation studies and analysis. In a recent review of the
solar atmosphere, Solanki & Hammer (2001) stated that the transition
region between the chromosphere and the corona is the
most fascinating part of the solar atmosphere because of the
thin thermal interface. They further point out that because of
the spatial and temporal scales of the region, TR observations will require
the highest demands on the spectral, spatial, and temporal resolutions for future space
missions.
,
the ratio of the gas pressure
to the magnetic pressure) decreases by a factor 104
(Gary 2001). The Alfven wave velocity increases by a factor of
102 inferring a significant decrease in the response
time to magnetic reconnection events. For a third example of
the rapid variability of the TR, recent Fourier analysis of the
CIV TRACE data has weakly indicated waves in the 100 mHz (10s
period) range, coming possibly from small-scale reconnection
or chromospheric shocks (DeForest 2004). Insight into the basic
mechanism responsible for these fundamental solar phenomena requires
specific diagnostic techniques to refine and infer the physical
properties of this region. Such systematic and random velocity
fields broaden and shift the line profile. Observing the upward
propagation of mechanical energy and its dissipation is key to
understanding the energy balance of the solar atmosphere. A high-throughput
VUV FPI can provide rapid 3D-imaging spectroscopy that is needed
to understand the overall physics, such as, (i) the dissipation
of mechanical energy carried upward from the convection zone
and dissipation of energy stored in the magnetic field, (ii)
the regime and location of each kind of heating, (iii) the complex
velocity field in the transition region, (iv) the role of the
magnetic field in heating at various heights, and (v) the distinctive
structures of the transition region. A CIV VUV FPI can provide
images, Doppler velocities, and magnetic field measurements simultaneously
for correlation studies and analysis. In a recent review of the
solar atmosphere, Solanki & Hammer (2001) stated that the transition
region between the chromosphere and the corona is the
most fascinating part of the solar atmosphere because of the
thin thermal interface. They further point out that because of
the spatial and temporal scales of the region, TR observations will require
the highest demands on the spectral, spatial, and temporal resolutions for future space
missions.
Recent observations have revealed significant spatial correlations
of the CIV emission with the highly redshifted fibril or spicule-like
structures in H .
De Pontieu and Tarbell reported recently
that this correlation promises to shed light on the long outstanding
issue of what role chromospheric spicule-like jets play in the
heating and momentum balance of the outer atmosphere (De Pontieu
& Tarbell 2002). Also using broadband images of Transition Region
and Coronal Explorer (TRACE), Tarbell, Handy, & Judge (1999)
report that bright CIV transients are seen associated with flux
emergence and cancellation, and can be associated with high-velocity
explosive events seen in Solar Ultraviolet Measurement of Emitted
Radiation's (SUMER) spectra. The CIV emission can be well-separated
from the photospheric magnetic footpoints, suggesting that it
takes place on current sheets higher in the atmosphere separating
different flux systems. However, they report that the CIV emission
of moss regions (foot points of hot coronal loops) is contrasted
with that of similar plage which does not have hot loops above
it. Hence improved narrow passband imaging of CIV is one step
to better understand coronal heating.
.
De Pontieu and Tarbell reported recently
that this correlation promises to shed light on the long outstanding
issue of what role chromospheric spicule-like jets play in the
heating and momentum balance of the outer atmosphere (De Pontieu
& Tarbell 2002). Also using broadband images of Transition Region
and Coronal Explorer (TRACE), Tarbell, Handy, & Judge (1999)
report that bright CIV transients are seen associated with flux
emergence and cancellation, and can be associated with high-velocity
explosive events seen in Solar Ultraviolet Measurement of Emitted
Radiation's (SUMER) spectra. The CIV emission can be well-separated
from the photospheric magnetic footpoints, suggesting that it
takes place on current sheets higher in the atmosphere separating
different flux systems. However, they report that the CIV emission
of moss regions (foot points of hot coronal loops) is contrasted
with that of similar plage which does not have hot loops above
it. Hence improved narrow passband imaging of CIV is one step
to better understand coronal heating.
Fundamentally, a VUV imaging spectral filter can provide information on the
three important physical processes: the magnetic field topology,
the coronal process, and the dynamics of the atmosphere. The
magnetic field in the region where the ratio ()
of
plasma pressure to magnetic pressure is low, where flares and
coronal mass ejections (CMEs) are believed to be triggered, can
be directly measured using the VUV FPI (Moore & Sterling 2005).
The force-free fields in the transition region may undergo large
changes in direction where the magnetic field is within the low-
region (Fig. 4). Then extrapolation upward through the rest
of the corona would give us a better calculation of the dynamic
magnetic field in this region, and would be related to the evolution
and interaction with the interplanetary medium.
![\begin{figure}
\par\includegraphics[width=7cm]{6035fg03.eps} \end{figure}](/articles/aa/full/2007/02/aa6035-06/Timg29.gif) |
Figure 3:
The spectral lines of CIV are formed in the logarithmic
middle of the temperature range of the transition region (after
Peter 2001). As a function of height, the temperature is increasing rapidly through the transition
region and the density is decreasing.
|
| Open with DEXTER |
![\begin{figure}
\par\includegraphics[width=7cm]{6035fg04.eps} \end{figure}](/articles/aa/full/2007/02/aa6035-06/Timg30.gif) |
Figure 4:
Plasma Beta plot showing that CIV emission coming from
the minimum value of beta. (Gary 2001).
|
| Open with DEXTER |
The understanding of the exact mechanisms leading to the heating
of the solar corona is still an enigma. However, the related
activities are characterized by a spatial-temporal intermittent
brightness of the solar atmosphere. The role of thermal conduction
in the energy redistribution of the coronal through the transition
region needs to be understood to resolve the coronal heating
problem. Generally the heating models are hydrodynamic mechanisms
with shock dissipation of acoustic waves or magnetic heating
mechanisms subdivided into electric-magnetic wave (alternating
current) or stress (direct current) mechanisms with numerous
dissipation processes possible (e.g. shocks, Laudau damping,
resonance absorption, turbulent heating, and anomalous heating).
In all these processes the energy must pass through the transition
region. Hence, the TR analysis of the intensity variations, the
magnetic fields, and the profile variations will help to unravel
the coronal heating processes.
The position and structure of the transition region is problematic
due to the dynamics of time-varying heating along a magnetic
field line, the small and large-scale restructuring of the magnetic
field (reconnection and electric currents), the small and large
mass ejections (spicules and CMESs), and oscillations/waves.
Improved observations of transition region variability (e.g.,
blinklers, nano-flares, and microflares) will help define the
fine structure dynamics that transfers the photospheric convectional
energy into the corona. The dynamics of the structure is clearly
seen in the CIV of HRTS spectrograms and the
SOHO/SUMER limb images (see Figs. 5 and 6). HRTS's Doppler shifts
over sunspots reveal down flows of up to 150 km s-1.
Peter and his colleagues in a number of recent articles have
emphasized the importance of the transition region and CIV characteristics
(Peter 2000, 2001). Gontikakis, Peter, & Dara (2003), have studied
the CIV line broader tail component, whose origin is unclear.
They found that the size of the bright radiance features is always
larger than the size of the structures of the Dopplergrams and
Doppler widths. The network features seem to diminish at a temperature
around 105 K due to the thermodynamic properties of the transition
region, and the mean size of the structures of the tail component
radiance is smaller than the one of the core radiance. On-disk
observations by SUMER show that the lower transition region (
 K) is composed of small loops and knots of emission and thread-like
structures (Feldman et al. 1999); hence the complex
structure of the transition remains to be deciphered and requires
new instrumentation.
K) is composed of small loops and knots of emission and thread-like
structures (Feldman et al. 1999); hence the complex
structure of the transition remains to be deciphered and requires
new instrumentation.
For example, a specific observing program would study the rapid
variation of transition region structures to investigate the
injection of material and wave into the corona. The FPI spectral
stability in tuning to a series of nearby chromospheric lines provides
the absolute velocities. Rapid scanning over the FOV gives small
scale velocity variations of filaments, surges,
and spicules and gives k- diagrams for wave
and shock analysis within the TR.
diagrams for wave
and shock analysis within the TR.
With these reasons for studying the CIV emission, the following section
discusses the design, development, and testing of a CIV interferometer
capable of meeting the rapid tuning, high spectral resolution,
and imaging requirements. With some loss in transmission, improvement
in the spectral resolution, by a third etalon, would allow for
analysis of the line asymmetries and small scale spectral anomalies.
However, a dual etalon interferometer can focuse on high cadence
Dopplergraphy. We will discuss both configurations. First, however,
prior attempts at the construction of CIV interferometer are
discussed in the next secion; all these prior etalons had relatively
large passbands (300-2000 pm).
![\begin{figure}
\par\includegraphics[width=7cm]{6035fg05.eps} \end{figure}](/articles/aa/full/2007/02/aa6035-06/Timg33.gif) |
Figure 5:
HRTS spectrum of the two CIV resonance lines showing
velocity mirco-structures. (After Dere et al. 1982).
|
| Open with DEXTER |
![\begin{figure}
\par\includegraphics[width=7cm]{6035fg06.eps} \end{figure}](/articles/aa/full/2007/02/aa6035-06/Timg34.gif) |
Figure 6:
A SOHO/SUMER Dopplergram of CIV showing the Doppler
micro-structure of the transition region as compared to the size
of the intensity structures (After Dammasch et al. 1999).
The limb is seen in the upper right hand corner.
The scale on the far left is  20 km s-1 (white = red shifted). 20 km s-1 (white = red shifted).
|
| Open with DEXTER |
In a series of papers in the 1970's, Bideau-Méhu and colleagues
reported on their investigation of Fabry-Perot interferometry
in the vacuum ultraviolet (Guern et al. 1974; Bideau-Méhu et al. 1976; Bideau-Méhu 1980). By 1980, they were employing 11 mm
thick, 50 mm diameter,  /80 MgF2 plates and Al-MgF2
films (22 nm-5 nm) to achieve reflecting finesse of 6.7 but only
a peak transmission of 9% at 152 nm. This resulted in a free
spectral range of
/80 MgF2 plates and Al-MgF2
films (22 nm-5 nm) to achieve reflecting finesse of 6.7 but only
a peak transmission of 9% at 152 nm. This resulted in a free
spectral range of
 nm with a full width at half maximum
of FWHM = 1.89 nm. The defect finesse derived from the flatness
should have given a finesse of 11. Inferior plate performance
was probably the cause of lower finesse. A recent VUV etalon development program (1996-2000)
was performed by the Lockheed-Martin Solar and
Astrophysics Laboratory (LMSAL) group and colleagues that resulted
in two articles directly related to the discussion here (Bruner et al. 1997; Wülser et al. 2000). The first paper reported on the theoretical
finesse and transmission of the etalon in the VUV. It demonstrated that
a 155 nm etalon predicted reflectance finesse could be 34
with a transmission of 36%. A study of an optimized -interference
coating (see Sect. 3.2) for a 155 nm etalon predicted a transmittance of 5.3%
with a peak reflectance of 91% with 3.5% absorption but had
a high out-of-band response to the blue. The second paper on
Fabry-Perot etalons reported on construction attempts in the
vacuum ultraviolet region (120-150 nm). The LMSAL group noted
that the performance of the high-efficiency coatings required
by a UV etalon is limited both by the availability of suitable
coating materials, and by the uniformity and accuracy of the deposition
process. A vacuum-spaced etalon with cultured quartz plates was
operated at 169.5 nm with a low finesse of 4. In this LMSAL study,
a 140 nm FPI without -interference coating, was constructed
with transmittance of 3%,
nm with a full width at half maximum
of FWHM = 1.89 nm. The defect finesse derived from the flatness
should have given a finesse of 11. Inferior plate performance
was probably the cause of lower finesse. A recent VUV etalon development program (1996-2000)
was performed by the Lockheed-Martin Solar and
Astrophysics Laboratory (LMSAL) group and colleagues that resulted
in two articles directly related to the discussion here (Bruner et al. 1997; Wülser et al. 2000). The first paper reported on the theoretical
finesse and transmission of the etalon in the VUV. It demonstrated that
a 155 nm etalon predicted reflectance finesse could be 34
with a transmission of 36%. A study of an optimized -interference
coating (see Sect. 3.2) for a 155 nm etalon predicted a transmittance of 5.3%
with a peak reflectance of 91% with 3.5% absorption but had
a high out-of-band response to the blue. The second paper on
Fabry-Perot etalons reported on construction attempts in the
vacuum ultraviolet region (120-150 nm). The LMSAL group noted
that the performance of the high-efficiency coatings required
by a UV etalon is limited both by the availability of suitable
coating materials, and by the uniformity and accuracy of the deposition
process. A vacuum-spaced etalon with cultured quartz plates was
operated at 169.5 nm with a low finesse of 4. In this LMSAL study,
a 140 nm FPI without -interference coating, was constructed
with transmittance of 3%,
 nm, finesse = 10.5, and FWHM
 = 0.32 nm.
Led by Zukic, the LMSAL and the MSFC UVI teams have investigated
a family of coating designs based on the fluoride salts of magnesium
and lanthanum, finding that a practical etalon performance may be
achievable at wavelengths as short as 120 nm (e.g., Zukic 1998).
While the lack of UV transmitting materials with a wide range of refractive
index is problematic, the concern can be overcome by using a
vacuum-spaced etalon design with MgF2 and LaF3-based coatings.
LMSAL efforts did produce a tunable etalon but did not use capacitive
sensor feedback circuitry, but used a manual method to scan in
wavelength. Because of the lack of other efforts and the scientific
potential of CIV interferometry, we have extended their efforts
and report our findings here.
= 0.32 nm.
Led by Zukic, the LMSAL and the MSFC UVI teams have investigated
a family of coating designs based on the fluoride salts of magnesium
and lanthanum, finding that a practical etalon performance may be
achievable at wavelengths as short as 120 nm (e.g., Zukic 1998).
While the lack of UV transmitting materials with a wide range of refractive
index is problematic, the concern can be overcome by using a
vacuum-spaced etalon design with MgF2 and LaF3-based coatings.
LMSAL efforts did produce a tunable etalon but did not use capacitive
sensor feedback circuitry, but used a manual method to scan in
wavelength. Because of the lack of other efforts and the scientific
potential of CIV interferometry, we have extended their efforts
and report our findings here.
Table 1:
Transition region observing instruments (100-200 nm).
Because of the minimum progress in VUV interferometers, the observations
of the solar transition region within the past 10 years have
been limited to broad passband imagers and spatial-scanning spectrographs (Table 1).
However, these instruments have demonstrated the extensive scientific
interest in the transition region. In particular, on the disk,
CIV measurements have been performed with (i.) the orbiting TRACE
having a 3.7 nm-FWHM spectral filter with a 2.4% transmission
with an additional cleaning filter (at 160 nm, 16.6%), (ii.) SUMER
using an area scanning spectrograph with 4-8 pm resolution, (iii.)
HRTS having 5 pm resolution, and (iv.) MSSTA, the Stanford University's
sounding rocket Multi-Spectral Solar Telescope Array, having
a CIV broadband filter of 10 nm FWHM. The Naval Research Laboratory's
(NRL) Very high Angular resolution ULtraviolet Telescope (VAULT)
is also a spectroheliograph rocket payload and has a passband
of 7 pm which is the predecessor of HRTS (Korendyke et al. 2001;
Bartoe et al. 1977). A MSFC sounding rocket's Solar Ultraviolet
Magnetograph Investigation (SUMI) is to measure the TR's CIV
at 2 pm spectral resolution. SUMI, in part, has evolved from
the 1980's UVSP SMM high spectral resolution (2-4 pm) but SUMI
will have a higher polarimetric resolution of CIV (West et al.
2000, 2001). SUMER is a normal incidence spectrometer with 8 pm
resolution at 160 nm. A full disk CIV scan with a spatial resolution
of 1 arcsec took over a day to scan the sun; a typical
active region scan of CIV of  arcmin2 at 2arcsec spatial resolution
requires 13 min with 4.2 pm/pixel. This slowness exemplifies
difficulties of a spectrograph for capturing the rapidly changing TR.
arcmin2 at 2arcsec spatial resolution
requires 13 min with 4.2 pm/pixel. This slowness exemplifies
difficulties of a spectrograph for capturing the rapidly changing TR.
The current orbiting imager of the transition region is TRACE
which images the solar corona and transition region at high angular
and temporal resolution. Its VUV wavelengths are 121.6 (8 nm,
14% transmittance), 155.0 (3.7 nm 2.4%), 160.0 (24.5 nm, 16.5%),
and 170.0 nm (20 nm, 24.5%). The TRACE telescope uses four normal-incidence
coatings for the EUV-VUV on quadrants of the primary mirrors.
The broadband 160 nm response has shown great sensitivity to transient
events which relates to the rapid thermal conduction in the transition
region. Under construction, the Solar Dynamics Observatory's
Atmospheric Imaging Assemble (SDO/AIA) will characterize the
dynamic evolution of the solar plasma from the chromosphere
to the corona, and will follow the connection of plasma dynamics
with photospheric magnetic activity throughout the solar atmosphere
but again with a broad passband transition region filter at 160 nm
with 20 nm FWHM. Although the capture rate is moderate, 4
fpm, the spectral profile includes many lines and provides only
intensity data.
For CIV, these high-speed imagers and high-spectral resolution
spectrographs can be combined into a single, compact filtergraph
by employing a VUV FPI. This would fill the void that is seen
in both the near-term orbiting observatories, AIA and Solar-B,
by extending high spectral resolution into the transition region
and permit exploration of the minimum plasma beta region.
These instruments show that a spectral resolution of 2-10 pm
produces important scientific returns and that a prefilter of
3-4 nm (cf. TRACE) can be manufactured (Handy et al.
1998). Therefore, as a needed alternative to the standard use
of a VUV spectrograph, the specification for a multiple etalon
interferometer is given. The CIV VUV FPI will have the capability
of extending the TR research by supplying a filtergraph to the
present arsenal in a compact volume for orbiting missions. The
etalon system would allow imaging a large field of view at specific
wavelengths and enable the design of either a 10 pm filter-type
magnetograph or a 2 pm spectro-polarimetric- type of magnetograph.
For a spectral resolution of /,
the FOV is given by FOV
(8/)1/2(
 /
/
 )
where
and
are the apertures of the etalon
and telescope, respectively. For
)
where
and
are the apertures of the etalon
and telescope, respectively. For
 mm,
mm,
 mm, = 2 pm
and = 155 nm, the FOV is 4 arcmin and would
allow the imaging of over 73% of active regions on the sun (Tang
et al. 1984). The instrument concepts outlined here are based
on having one or two of the etalons tunable with an additional
fixed-gap etalon. The fixed-gap (static) etalon is used to isolate
a single order of the tunable etalon and is commensurate with
a 3.5 nm VUV prefilter (see Hernandez 1986, Chap. 4, for discussion
of multiple etalon devices). This fixed-gap etalon acts to span
the spectral blocking requirements between the narrower VUV filter
in the 155 nm range and the
of the double configuration. The
double (or triple) configuration is designed to give a bandpass
of 10 pm (or 2 pm) and maximize the suppression of intensity coming
from the continuum in the region. Our design focuses on the CIV
TR line, which, fortunately, has the molecular fluoride (F2) laser
line of 157 nm nearby which can be used for profiling and aligning
the filter in the laboratory.
The general VUV technology discussed here can be extended
to allow FPIs to be built at the other important solar lines
in the VUV (e.g., OV 137 nm, OIV 140 nm, & HeII 164 nm) for extended
studies of fine structuresdynamics, density, and temperature.
mm, = 2 pm
and = 155 nm, the FOV is 4 arcmin and would
allow the imaging of over 73% of active regions on the sun (Tang
et al. 1984). The instrument concepts outlined here are based
on having one or two of the etalons tunable with an additional
fixed-gap etalon. The fixed-gap (static) etalon is used to isolate
a single order of the tunable etalon and is commensurate with
a 3.5 nm VUV prefilter (see Hernandez 1986, Chap. 4, for discussion
of multiple etalon devices). This fixed-gap etalon acts to span
the spectral blocking requirements between the narrower VUV filter
in the 155 nm range and the
of the double configuration. The
double (or triple) configuration is designed to give a bandpass
of 10 pm (or 2 pm) and maximize the suppression of intensity coming
from the continuum in the region. Our design focuses on the CIV
TR line, which, fortunately, has the molecular fluoride (F2) laser
line of 157 nm nearby which can be used for profiling and aligning
the filter in the laboratory.
The general VUV technology discussed here can be extended
to allow FPIs to be built at the other important solar lines
in the VUV (e.g., OV 137 nm, OIV 140 nm, & HeII 164 nm) for extended
studies of fine structuresdynamics, density, and temperature.
A Fabry-Perot narrow passband filter offers the advantage in
that the observer can choose distinct spectral modes depending
on what is desired: (i) a rapid-cadence Dopplergraphy, (ii) seven-step
filter magnetography, or (iii) full spectral profiling. For spectral
polarimetry, the central challenge for a FPI is to acquire the
precise Stokes profile in a time that does not exceed the evolutionary
timescale of the solar features on minimum angular scales of
the instrument (Gary et al. 2006). For the dual etalon system,
5 spectral samples are sufficient to provide Dopplergrams. For
the triple etalon system, 15 samples across the spectral line
will provide sufficient details of the line profile. A FPI offers
the advantage of avoiding spatial rastering, with the disadvantage
of spectral tuning; but the higher throughput and resultant faster
cadence, coupled with post-focal image techniques more than compensate
for this disadvantage (Gary et al. 2003). Furthermore, the major
advantage for a FPI in a spaceflight instrument, as compared
with a grating spectrometer, is in compact volume
(4X). The other advantages are dual functionality of
observing modes, simplicity of design, use of fast and accurate
piezoelectric tuning, and high étendue, and relative polarization
insensitivity.
Our efforts on a VUV etalon system have been an outgrowth of
a MSFC program to build a sounding-rocket VUV spectrograph (i.e.,
the Solar Ultraviolet Magnetograph Investigation - SUMI). Under
this research, a scanning VUV interferometer was manufactured
with improved -coatings, capacitance stabilized controllers,
and the special Hansen mechanical mount technology
(Remote Sensor Concepts, MD and Hovemere Ltd., UK). Two
pairs of /200 MgF2 plates were produced under
this study. The first pair was coated with a CIV reflective coating
(by M. Zukic/Cascade Optical Corporation) and overcoated with Al/Ag to allow a visible
test of the final plate flatness for coating effects (plate warping). Through
the Galaxy Evolution Explorer (GALEX) mission's VUV coatings
(135-175 nm), Cascade gained unique experience on coatings at
 nm to produce better higher-reflectance, lower-absorption coatings
(Jelinsky 2003). Having verified that the
coating had no effect on the flatness in the visible, the second
pair of plates was coated by Cascade and assembled by Hovemere
into a tunable VUV etalon system (etalons, mechanical mount,
temperature-controlled housing, and capacitance-stabilized control
system). The final assembly was tested in the visible at Hovemere
and MSFC, and was tested in the VUV with the 157 nm F2 laser at the University of Toronto.
The details of these tests will be given later in the paper.
nm to produce better higher-reflectance, lower-absorption coatings
(Jelinsky 2003). Having verified that the
coating had no effect on the flatness in the visible, the second
pair of plates was coated by Cascade and assembled by Hovemere
into a tunable VUV etalon system (etalons, mechanical mount,
temperature-controlled housing, and capacitance-stabilized control
system). The final assembly was tested in the visible at Hovemere
and MSFC, and was tested in the VUV with the 157 nm F2 laser at the University of Toronto.
The details of these tests will be given later in the paper.
The present section establishes the constraints on the design
of the VUV FPI and presents the design specifications
for a complete Fabry-Perot filter system. A Fabry-Perot
spectral filter system provides (1) the required spectral resolution
for high-resolution filter spectral imaging; (2) the high etendue
(light throughput) to obtain a sufficient number of spectral
samples within the appropriate time periods (i.e., a solar oscillation,
a wave period, or the time for motion across a resolution element),
and to obtain the required magnetic sensitivity within the timescale
of changing solar features; (3) a mechanically and optically
simpler design compared to a spectrograph; (4) the rapid, adjustable
non-sequential tuning between wavelengths that is required for
finding the spectral line center and for adjusting the wavelength
setting for Doppler-induced shifts, and (5) spectroscopy for
5-20+ position Stokes line profiles. We will now consider the
components of the specific design rationale: spectral resolution,
spectral purity, etendue, spectral range, optical configuration,
finesse, and blocking filters.
The VUV FPI is designed for high spectral resolution in order
to reconstruct an acceptable line profile. To resolve a spectral
line with half width of
 pm, a spectral
resolution of
pm, a spectral
resolution of
 pm is required for 15 points
across the line profile. For typical TR flows of
pm is required for 15 points
across the line profile. For typical TR flows of  km s-1, the Doppler shift of the line center is only
 V/c = 0.5 pm. Moreover, the overall spectral
resolution obtained depends upon the dynamics of the solar image
(rate of scene changes), the Poisson statistics of the measurements
(throughput at line depth), and the total time required to obtain
the spectral profile (SNR and stepping intervals). Assuming Gaussian
shaped line profiles and Poisson statistics for the detector,
and using 15 points, the uncertainty in the Doppler shift can
be estimated by
V/c = 0.5 pm. Moreover, the overall spectral
resolution obtained depends upon the dynamics of the solar image
(rate of scene changes), the Poisson statistics of the measurements
(throughput at line depth), and the total time required to obtain
the spectral profile (SNR and stepping intervals). Assuming Gaussian
shaped line profiles and Poisson statistics for the detector,
and using 15 points, the uncertainty in the Doppler shift can
be estimated by
 .
Assuming
pm for CIV and
a signal to noise ratio is
(S/N)=103,
the error in the doppler shift is
.
Assuming
pm for CIV and
a signal to noise ratio is
(S/N)=103,
the error in the doppler shift is
 pm
(Hagyard, Gary, & West 1988). This uncertainty in the Doppler
shift represents an uncertainty in the velocity of 7 m s-1.
Theoretical modeling of down flows, flux tubes, and Evershed
flows can show strong variations and asymmetries in the Stokes
profiles (Borrero et al. 2004). High quality spatio-spectral
observations can resolve and test these physical models. However,
the spectral resolution of 10 pm is sufficient to detect
the general line-profile shape observed in the spectra, and the
wavelength sampling can be dense enough to determine line center.
A minimum of five steps across the spectral line is needed. For
detail line profile asymmetries at
pm
(Hagyard, Gary, & West 1988). This uncertainty in the Doppler
shift represents an uncertainty in the velocity of 7 m s-1.
Theoretical modeling of down flows, flux tubes, and Evershed
flows can show strong variations and asymmetries in the Stokes
profiles (Borrero et al. 2004). High quality spatio-spectral
observations can resolve and test these physical models. However,
the spectral resolution of 10 pm is sufficient to detect
the general line-profile shape observed in the spectra, and the
wavelength sampling can be dense enough to determine line center.
A minimum of five steps across the spectral line is needed. For
detail line profile asymmetries at
 nm, spectral
resolution of
nm, spectral
resolution of
 /
/
 is required which gives
pm or 18
steps interval across the profile.
Gary et al. (2006) give a discussion of the
CIV radiometry and polarimetry needed for inverting the Stokes CIV line profiles.
is required which gives
pm or 18
steps interval across the profile.
Gary et al. (2006) give a discussion of the
CIV radiometry and polarimetry needed for inverting the Stokes CIV line profiles.
The spectral resolution (i.e. 1/resolving power) depends primarily
on the finesse for a single etalon, or the free spectral range
for a multiple etalon system (Hernandez 1986; Vaughan 1989).
For a single etalon system, the spectral resolution is approximately
/
 ,
where F is the finesse and d is the etalon gap distance.
For a
,
where F is the finesse and d is the etalon gap distance.
For a  mm and
nm, then
/
mm and
nm, then
/
 ;
hence, to obtain the 10 pm spectral resolution, the finesse must
be F=6. However the
for a single etalon is then
;
hence, to obtain the 10 pm spectral resolution, the finesse must
be F=6. However the
for a single etalon is then
 pm.
For a spectral resolution of
pm.
For a spectral resolution of
 pm
and for a finesse of F=8.6, we need
a larger gap (
pm
and for a finesse of F=8.6, we need
a larger gap ( mm) which gives a smaller free spectral range (
 pm).
Because of the impossibility
of manufacturing a compatible interference prefilter for a single
etalon to isolate a single order, multiple etalons systems must
be employed. For a multiple etalon system the spectral resolution
is given by /
pm).
Because of the impossibility
of manufacturing a compatible interference prefilter for a single
etalon to isolate a single order, multiple etalons systems must
be employed. For a multiple etalon system the spectral resolution
is given by /
 /(
/( )
where the minimum FSR of the set of etalons is used to determine
the resolution. The effective free spectral range of the
multi-etalons in combination, however, can be 10-100 times greater,
and compatible with VUV prefilters. For multiple etalons, the
effective free spectral range of the system is determined by
the set of incommensurable etalon spacings; however, the etalon
with the minimum FSR sets the passband. Then for F=6, we cannot
obtain a passband of 10 pm and must employ a multiple etalon system.
)
where the minimum FSR of the set of etalons is used to determine
the resolution. The effective free spectral range of the
multi-etalons in combination, however, can be 10-100 times greater,
and compatible with VUV prefilters. For multiple etalons, the
effective free spectral range of the system is determined by
the set of incommensurable etalon spacings; however, the etalon
with the minimum FSR sets the passband. Then for F=6, we cannot
obtain a passband of 10 pm and must employ a multiple etalon system.
For a single, vacuum-gap (n=1) etalon, the Fabry-Perot profile
is given by an Airy function and requires a narrow blocking system
because of the multiple orders (transmission peaks). Assuming
perfect flatness and an incident angle of
 degrees
for the collimated beam, the Airy function for a single etalon transmission profile
is given by,
degrees
for the collimated beam, the Airy function for a single etalon transmission profile
is given by,
where R is the reflectance, L is the loss of the etalon coating,  (=1-R+L) is the intensity transmission coefficient for the coating
(Hernandez 1986; Vaughan 1989). The spectral order, m, of a single transmission peak is
given by the integer value of 2 n d cos(
(=1-R+L) is the intensity transmission coefficient for the coating
(Hernandez 1986; Vaughan 1989). The spectral order, m, of a single transmission peak is
given by the integer value of 2 n d cos( )/).
For low losses, then
)/).
For low losses, then
 ,
yeilding
,
yeilding
For a perfect etalon the transmission is
 compared to
the value of
compared to
the value of
 for reflections with
absorption which are dependent on the loss (L) of the optical coating
(Vaughan 1989). For a single Fabry-Perot etalon, the minimum
transmission
for reflections with
absorption which are dependent on the loss (L) of the optical coating
(Vaughan 1989). For a single Fabry-Perot etalon, the minimum
transmission
 is determined by the reflectance
(R) of the coatings of the etalon. For example a single etalon
with effective reflectance of R=0.77 (and assuming infinite defect
finesse) will have a minimum transmittance of 10-2 with respect to the maximum transmittance.
The total spectral profile response of a multi-system is determined
by the product of the combined etalon profiles. For two identical
etalons with R=0.77 the minimum transmittance of 10-4 with respect to the maximum transmittance.
Tuning the ratio of finesse, the gap distance, and the
free spectral range of the individual etalons can optimize the
spectral purity, out-of-band rejection and contribution of parasitic
orders. Multiple etalon systems have superior out-of-band rejection
due to placement of the separate etalon minimums.
The transmission of the strongest off-band peaks and the total
integrated off-band transmission sets the interferometer specifications
for spectral purity. The process involves a trade-off between
the number of etalons and blocking filters. The specific blocking
filter characteristics must be enumerated (number, size, types,
transmission, and deposition method) to provide the match with
the etalons and the physical observations that are to be performed.
is determined by the reflectance
(R) of the coatings of the etalon. For example a single etalon
with effective reflectance of R=0.77 (and assuming infinite defect
finesse) will have a minimum transmittance of 10-2 with respect to the maximum transmittance.
The total spectral profile response of a multi-system is determined
by the product of the combined etalon profiles. For two identical
etalons with R=0.77 the minimum transmittance of 10-4 with respect to the maximum transmittance.
Tuning the ratio of finesse, the gap distance, and the
free spectral range of the individual etalons can optimize the
spectral purity, out-of-band rejection and contribution of parasitic
orders. Multiple etalon systems have superior out-of-band rejection
due to placement of the separate etalon minimums.
The transmission of the strongest off-band peaks and the total
integrated off-band transmission sets the interferometer specifications
for spectral purity. The process involves a trade-off between
the number of etalons and blocking filters. The specific blocking
filter characteristics must be enumerated (number, size, types,
transmission, and deposition method) to provide the match with
the etalons and the physical observations that are to be performed.
![\begin{figure}
\par\includegraphics[width=7cm]{6035fg07.eps} \end{figure}](/articles/aa/full/2007/02/aa6035-06/Timg74.gif) |
Figure 7:
Plot of the dual (10 pm, upper panel) and triple (2 pm,
lower panel) interferometer transmission profiles (thick line)
along with the normalized CIV resonance emission lines at 154.82
and 155.08 nm (thin line). The contamination from the off-band
peaks does not affect significiantly the spectral resolution
of the CIV lines because of their shifted location and low transmission and
because of the weak strength of VUV continuum.
|
| Open with DEXTER |
Figure 7 shows the resulting transmission profile for both a
double and triple etalon system. Superimposed are the dual resonance
lines of CIV. It is seen that the double etalon design has higher
secondary peaks but since these are outside the CIV line profile
these parasitic contributions are small. The double etalon system
has a broader FWHM since the effective free spectral range must
be commensurate with the passband of the prefilter. To improve
the passband from 10 pm to 2 pm, an additional tunable etalon is
employed and the parasitic contribution is further diminished.
For spectroscopic and polarimetric measurements of rapidly changing
physical conditions in the solar atmosphere, the etendue or optical
throughput per unit solid angle is a critical design item for
the multi-etalon systems. For a single FPI the transmittance
is related to the overall finesse and the absorption in the cavity
(imperfections and optical absorption). The transmittance goal
of the VUV FPI is greater than 50%. Since for a single etalon
the maximum and minimum transmittances are functions of the coating
reflectivity and losses, the coatings across the operational
wavelengths must be specified and compatible with the overall
finesse of the etalons. For lower R (which means lower finesse),
 increases and provides for higher throughput. Hence, a
lower finesse is desirable for maximum etendue.
increases and provides for higher throughput. Hence, a
lower finesse is desirable for maximum etendue.
![\begin{figure}
\par\includegraphics[width=7cm,clip]{6035fg08.eps} %
\end{figure}](/articles/aa/full/2007/02/aa6035-06/Timg76.gif) |
Figure 8:
A schematic of the proposed VUV dual and triple etalon
FPI system showing the elements of the system: (HRI), HRI, LRI,
and the prefilter. A third etalon (HRI), at the top of the figure,
would provide for higher spectral resolution.
|
| Open with DEXTER |
![\begin{figure}
\par\includegraphics[width=7cm]{6035fg09.eps} \end{figure}](/articles/aa/full/2007/02/aa6035-06/Timg79.gif) |
Figure 9:
The variation of  / / (solid, lower line),
maximum transmittance
(dashed upper line, A=0.03) and
reciprocal reflectance finesse
(solid, lower line),
maximum transmittance
(dashed upper line, A=0.03) and
reciprocal reflectance finesse  (dash-dotted, middle line)
vs. the reflectance of the etalon coatings R. The vertical line
is at 77% reflectance optimizing for Min(/)
and Max().
(dash-dotted, middle line)
vs. the reflectance of the etalon coatings R. The vertical line
is at 77% reflectance optimizing for Min(/)
and Max().
|
| Open with DEXTER |
![\begin{figure}
\par\includegraphics[width=7cm]{6035fg10.eps} \end{figure}](/articles/aa/full/2007/02/aa6035-06/Timg80.gif) |
Figure 10:
The reflectance (R), transmittance (T) and absorptance (A, loss) of
the -multilayer optimized for the mirror coating of the Fabry-Perot
etalon operating at 155 nm. The multilayer has a peak
reflectance of 91.2% at 155 nm. At the same wavelength the multilayer
has 5.3% transmittance and 3.5% absorptance (M. Zukic 1999,
private communication). This coating will be re-optimize for
the static LRI to improve the reflectance to 94.7%.
|
| Open with DEXTER |
In Fig. 9, for defect-free etalons, the inverse contrast ratio
 ,
the maximum transmittance ,
and the reciprocal
of the reflectance finesse
,
the maximum transmittance ,
and the reciprocal
of the reflectance finesse
 is plotted as a function of
the etalon coating reflectivity R. We want /
to be as small as possible with
as large as possible to
reduce parasitic noise and maximize throughput. The reflectance
finesse
should also be equal to the defect finesse
is plotted as a function of
the etalon coating reflectivity R. We want /
to be as small as possible with
as large as possible to
reduce parasitic noise and maximize throughput. The reflectance
finesse
should also be equal to the defect finesse  .
For the selected reflectance of R=0.77, the resulting transmittance
is
.
For the selected reflectance of R=0.77, the resulting transmittance
is
 and /
and /
 .
.
Because of the etalon surface defects, the actual maximum transmission
is dependent on the ratio of the effective finesse and the reflective
finesse. Reduction of
is given by  /
(McKay 1999).
The effective finesse can be estimated by
/
(McKay 1999).
The effective finesse can be estimated by
![$F_{\rm E}= [F_{\rm R}^{-2} +F_{\rm D}^{-2}]^{-1/2}$](/articles/aa/full/2007/02/aa6035-06/img87.gif) .
Furthermore, the defect finesse can be approximated by
.
Furthermore, the defect finesse can be approximated by
 /[4
/[4
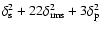 ]1/2 where
 is the etalon plate spherical deviation from a plane,
 is
the plate rms surface roughness, and
is
the plate rms surface roughness, and
 is the plate
deviation from true parallelism. The root-mean-square defect
finesse is generated by surface roughness (irregularities and
micro-defects), which are assumed to follow a Gaussian distribution.
The parallel finesse is easily achieved by piezoelectric feedback
drivers. Hicks et al. (1981) developed a control
system that maintains plate parallelism and control spacing to
an accuracy better than /10 000. Therefore the main
concern on the etalon optical quality is induced or manufactured
warping of the etalon plates. The estimated values of the coefficients
are
is the plate
deviation from true parallelism. The root-mean-square defect
finesse is generated by surface roughness (irregularities and
micro-defects), which are assumed to follow a Gaussian distribution.
The parallel finesse is easily achieved by piezoelectric feedback
drivers. Hicks et al. (1981) developed a control
system that maintains plate parallelism and control spacing to
an accuracy better than /10 000. Therefore the main
concern on the etalon optical quality is induced or manufactured
warping of the etalon plates. The estimated values of the coefficients
are
 nm,
nm,
 nm,
nm,
 nm (McKay
1999), Hence, the defect finesse for
is
nm (McKay
1999), Hence, the defect finesse for
is
 and since
![$F_{\rm E}/F_{\rm R} =1/[1+F_{\rm R}^{2}/F_{\rm D}^{2}]^{1/2}$](/articles/aa/full/2007/02/aa6035-06/img97.gif) , this implies
, this implies
 ,
to insure that the reduction of the maximum transmission
is less than
,
to insure that the reduction of the maximum transmission
is less than
 .
For R=0.77, the condition
<
is satisfied since
.
For R=0.77, the condition
<
is satisfied since
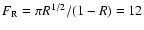 .
The effective
finesse is then
.
The effective
finesse is then
![$F_{\rm E}= [F_{\rm R}^{-2} +F_{\rm D}^{-2}]^{-1/2} = 8.8$](/articles/aa/full/2007/02/aa6035-06/img100.gif) and giving
an effective reflectivity of
and giving
an effective reflectivity of
 .
The ratio G of the maximum
transmission to the mean transmission can be approximated by
a function of the effective finesse
.
The ratio G of the maximum
transmission to the mean transmission can be approximated by
a function of the effective finesse 
 .
(McKay 1999). The reduced maximum transmission is
.
(McKay 1999). The reduced maximum transmission is
 ,
within our goal. The reduced contrast ratio is /
,
within our goal. The reduced contrast ratio is /
 .
Hence, each etalon will
have a flatness of /200 at
.
Hence, each etalon will
have a flatness of /200 at
 nm
(HeNe laser) before coating, and a broadband coating with >70-90%
reflectance at
nm
(HeNe laser) before coating, and a broadband coating with >70-90%
reflectance at  nm.
nm.
![\begin{figure}
\par\includegraphics[width=7cm]{6035fg11.eps} \end{figure}](/articles/aa/full/2007/02/aa6035-06/Timg108.gif) |
Figure 11:
Interferometry of the 35 mm MgF2 etalon plates for
the VUV Fabry-Perot System with flatness >/150 at 633 nm
which is /37 at 155 nm. The first set of the plates
were used to verify the -coatings and the second set of plates
is in the CIV HRI.
|
| Open with DEXTER |
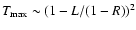
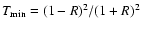
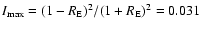
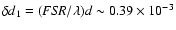
The gap distance is the next parameter to be considered. For
a peak transmission at wavelength ,
the Airy function
gives the etalon gap distance of
 (Atherton et al. 1981). For
a small change in wavelength
(Atherton et al. 1981). For
a small change in wavelength
 ,
the
gap distance must be changed by
,
the
gap distance must be changed by
 .
For a fixed gap distance, the spectral distance between the adjacent
transmissions orders, i.e., the free spectral range, is
.
For a fixed gap distance, the spectral distance between the adjacent
transmissions orders, i.e., the free spectral range, is
 .
For a given order (m) and
pm, the move to the next
transmission peak at 155 nm, i.e., the next order, the gap of
d must be moved
.
For a given order (m) and
pm, the move to the next
transmission peak at 155 nm, i.e., the next order, the gap of
d must be moved
 d. Typically for etalons, the gap distance is
 m and as a result, the piezoelectric stacks must
give a tuning range of
m and as a result, the piezoelectric stacks must
give a tuning range of
 nm,
where
nm,
where  is the number of free spectral ranges to be
scanned.
The number
is the number of free spectral ranges to be
scanned.
The number
 (i.e.,
at
nm)
must allow wo orders in the visible and to allow the determination
of the .
For
(i.e.,
at
nm)
must allow wo orders in the visible and to allow the determination
of the .
For
 pm, the
spectral resolution is
pm, the
spectral resolution is
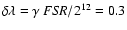 pm (e.g. at 155 nm, the equivalent Doppler shift is 0.6 km s-1).
The large number (6) for
is selected
to allow the number of free spectral orders scanned to be 2
at the HeNe laser line, 632.8 nm, for testing in the visible.
Optical tuning requirements are determined by the need of almost
instantaneous stepping to avoid loss of photons and stability
of performance. The other factors affecting the tuning are (i)
acquisition speed, (ii) stability and control, (iii) repeatability,
(iv) PZT feedback systems, (v) thermal compensation, (vi) laser
control feedback systems, and (vii) correction of induced temperature
and pressure variations within the etalon. The maintenance and
tuning of the plate parallelism is solved by capacitance stabilization
and piezoelectric driving stacks (Hicks et al. 1984).
pm (e.g. at 155 nm, the equivalent Doppler shift is 0.6 km s-1).
The large number (6) for
is selected
to allow the number of free spectral orders scanned to be 2
at the HeNe laser line, 632.8 nm, for testing in the visible.
Optical tuning requirements are determined by the need of almost
instantaneous stepping to avoid loss of photons and stability
of performance. The other factors affecting the tuning are (i)
acquisition speed, (ii) stability and control, (iii) repeatability,
(iv) PZT feedback systems, (v) thermal compensation, (vi) laser
control feedback systems, and (vii) correction of induced temperature
and pressure variations within the etalon. The maintenance and
tuning of the plate parallelism is solved by capacitance stabilization
and piezoelectric driving stacks (Hicks et al. 1984).
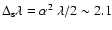
As we have discussed, the design of a single etalon system
needs to have a large separation between orders to allow blocking
filters to isolate a particular order for spectral analysis.
This requires a high finesse. For dual or triple systems
much lower finesse per etalon can be employed. In practice these
finesse values for tunable etalons are typically 20-70 in the
visible but in the VUV the finesse values are 5-10. (A finesse
value of 50 can be assumed as a limiting upper value
for etalons, assuming improved technology with
 nm. For the fixed-gap etalon, the plate flatness and parallelism
should be controlled thermally, in order to achieve an effective
finesse of 50 for the fixed-gap etalon.) For a 10 pm
FWHM, the
is 60 pm, which implies multiple etalon
systems in order to have a larger effective ;
since, these designs are limited by
commerical VUV interference filters which have a passband of
nm. For the fixed-gap etalon, the plate flatness and parallelism
should be controlled thermally, in order to achieve an effective
finesse of 50 for the fixed-gap etalon.) For a 10 pm
FWHM, the
is 60 pm, which implies multiple etalon
systems in order to have a larger effective ;
since, these designs are limited by
commerical VUV interference filters which have a passband of  10 nm.
![\begin{figure}
\par\includegraphics[width=7cm]{6035fg12.eps} \end{figure}](/articles/aa/full/2007/02/aa6035-06/Timg122.gif) |
Figure 12:
The Cascade VUV etalon -coating spectral profile for the
scanning FPI with reflectance at 77% for CIV (155 nm). The vertical
wavelength lines for CIV at 155 nm and for the F2 laser
line at 157 nm are shown. The peak reflectance is R=0.77 with
corresponding reflectance finesse of
.
At the laser line (157 nm), the reflectance is R=0.74 and
 . .
|
| Open with DEXTER |
To insure minimum wavefront distortion after mounting, i.e., minimum mirror
wrapping due to mechanical forces, our approach
for the mechanical mount is the Hansen mounting (Killeen et al. 1982).
This mounting is necessary for orbital observatories since the etalon
must be firmly held in place during launch (Figs. 13 and 14).
The mount uses a set of longitudinal cantilevered beam springs that are matched
to the elastic properties of the etalon spacers. Such a mount
provides the necessary stability of the deformation finesse and
are standard products of Hovemere.
![\begin{figure}
\par\includegraphics[width=7cm]{6035fg13.eps} \end{figure}](/articles/aa/full/2007/02/aa6035-06/Timg123.gif) |
Figure 13:
Close-up of the VUV FPI etalon assembly with the housing
removed. Shown are two of the three curved cantilever springs
with thepiezoelectric stack beneath. In the center are the MgF2
etalon withthe VUV coatings and, hence, clear in the visible.
At the top between the two springs are two capacitance bridges
and one reference bridge.
|
| Open with DEXTER |
The wavelength coverage of the VUV FPI must be 0.2 nm
(Figs. 2 and 7) to be able to observe both lines of CIV. The
CIV (154.82, 155.08) emission in the logarithmic middle of the
transition region (Fig. 3) is a measure of the heating and
dynamics affecting the corona above. Furthermore in order to
test the etalon, the reflectance coatings should allow the etalon
to scan the molecular F2 laser line at 157 nm. Therefore,
the spectral coverage should be 3 nm but limited to
this range to allow the spectral passband to perform as a prefilter
of parasitic light.
Table 2:
Design parameters for the VUV 10 pm interferometer.
Assuming paraxial ray tracing, the Lagrange optical invariant
(the product of the beam aperture and the angle of the oblique chief
ray) determines the maximum incident angle of the beam in the
interferometer gap (n=1) (Smith 1990). This statement is true for both collimated
and telecentric beams assuming that the FPIs are at the position
of minimum beam size. For observing typical active regions, the
field of view should be FOV3 arcmin. For a 300 mm telescope
aperture (typical sounding rocket apertures) and a half-diagonal
FOV1/2 of 1.5 arcmin, the maximum incident angle in a 25 mm
etalon is some 12 times larger, or
 degree.
For an etalon mounted in a collimated beam, the wavelength shift
through the etalon is
degree.
For an etalon mounted in a collimated beam, the wavelength shift
through the etalon is
 pm at
pm at
 nm. For a telecentric
configuration, the effective passband is
nm. For a telecentric
configuration, the effective passband is
In a telecentric-mounted configuration, the FWHM of the etalon
will be approached by the system only if
 is on the order of FWHM. For a 2 pm passband, this would require
an etalon aperture of 25 mm for a full 3-arcmin FOV. The effective
passband width would be 2.8 pm for a telecentric beam. A collimated
system FWHM
is on the order of FWHM. For a 2 pm passband, this would require
an etalon aperture of 25 mm for a full 3-arcmin FOV. The effective
passband width would be 2.8 pm for a telecentric beam. A collimated
system FWHM
 pm width (with a wavelength variation across
the field of view) or a telecentric system FWHM
pm width (with a wavelength variation across
the field of view) or a telecentric system FWHM
 pm (in
which etalon artifacts have larger effects on the final image
quality and which broadens the passband) can be considered. However
for a 10 pm filter, etalon passband is FWHM
pm (in
which etalon artifacts have larger effects on the final image
quality and which broadens the passband) can be considered. However
for a 10 pm filter, etalon passband is FWHM
 pm, hence
a FOV of 4 arcmin can be considered for this larger
passband.
pm, hence
a FOV of 4 arcmin can be considered for this larger
passband.
The telecentric configuration avoids the strong variation of
wavelength across the FOV of a collimated beam design. A negative
aspect of a telecentric configuration is that it produces a slight
pupil apodization as a function of wavelength (the Beckers effect,
von der Lühe & Kentischer 2000). The spectral passband change
across the etalon pupil causes a Point Spread Function (PSF)
variation (dependent on the etalon tuning), which leads to Doppler
velocity errors for solar spectral lines. In an F/256 configuration
the velocity errors were calculated to be less than 10 m s-1.
For large F-number configurations, the analysis implies that
a telecentric beam can be used with a minimum pupil apodization
effect. Furthermore, the analysis by Scharmer (2005) shows that
the phase errors introduced by a slower telecentric system can
be largely compensated by refocusing. Scharmer points out that
the effects of inhomogeneity in the optical cavity must be considered
in the analysis and the ratio of the gap cavities and the
reflectance are important. Scharmer (2005) concludes that the
telecentric configuration is the preferred configuration for
high-imaging quality.
Multiple reflections within a system of etalons produce
ghost images which can be a problem. Methods to ameliorate the ghost images can be found in literature
(e.g., Scharmer 2006; Tritschler et al. 2002; McKay 1999; Kentischer et al.
1998). These methods include:
(1) tilting the elations slightly and adding a wedge angle to the exterior etalon surfaces,
(2) adding an adsorption plate between etalon pairs,
(3) employ telecentric configurations so the ghost image are far out of focus, and
(4) adding antireflection coatings. Cascades Optical Corporation has developed a antireflection coating
of MgF2 and LaF3 that reduces the reflection to a few tenths of percent (R<0.005).
If the incident beam is polarized, then using one 45-degree prefilter mirror between each
etalon pair followed by MgF2 quarter waveplate, the inter-etalon reflections could be reduced.
The success of these various options will be experimentally investigated and reported in a later paper.
![\begin{figure}
\par\includegraphics[width=7cm]{6035fg14.eps} \end{figure}](/articles/aa/full/2007/02/aa6035-06/Timg133.gif) |
Figure 14:
Schematic of the piezoelectric-tunable, capacitance-stabilized
VUV FP etalon. Each piezoelectric driver is matched with a capacitor
made of metallized Zerodur post providing electronic tuning of
the optical gap. The MgF2 etalon plates are cemented to mounting
plates that are held by a Hansen cantilever beam. The MgF2
housing window holds a pure N2 atmosphere for transmittance
at 155 nm. The reflectance-coatings cover 30 mm area
centered on the etalons. The annular holes in the glass mounting plates are 35 mm diameter.
|
| Open with DEXTER |
In designing the VUV FPI for operation, a prefilter (or blocking
filter) is necessary to insure the elimination of the parasitic
orders of the multiple etalons, since a single dielectric filter
cannot be made to have the passband and transmission requirements.
Typical commercial filters in the 155 nm range have a transmission
of 5% and a bandpass of 10 nm. However, a set of mirrors with dielectric
-coatings provides an acceptable prefilter. A system
of four mirrors with VUV dielectric is shown in Fig. 8. The
blocking filter system is consistent with the following requirements:
(a) to obtain the Zeeman sensitive CIV lines at 154.82 and 155.08
and the laboratory surrogate F2 line; (b) to have a filter transmittance
of >80% (i.e., total 4-mirror reflectance of >80%)
and off-band transmittance of 10-5; (c)
to have an effective full width at half maximum (FWHM) of 3 nm (to optimize the etalon trade-offs); (d) to operate with
a telescope which has a half-diagonal FOV1/2 of 3-4 arcmin
(allowing 50-75% of all solar active regions to fit within the
FOV) (Tang et al. 1984); (e) to operate with a 300 mm telescope aperture; and (f.)
to operate in a beam so that the spectral tuning and transmission
profile are uniform over the field of view.
The VUV, dielectric-high-reflectance (DHR) prefilter is based on the work of M. Zukic where each mirror is
a -multilayer. In this approach, the light is reflected
from each high-low refractive layer pair in phase as compared
to quarter-wave stacks in which each layer is reflected in phase
(Zukic & Torr 1995). Each element is, typically, 25 dielectric
multilayer stacks of LiF3 (high) and MgF2 (low). The wavelengths
long of the region of interest are primarily absorbed or transmitted by the
materials in the dielectric stack. The wavelengths short of the
region of interest are primarily absorbed by the substrate on
the reflective elements. However, there is a limited number of materials
that are transmitting (small extinction coefficient) in this
region, and, of those transmitting materials many become less transparent in orbit
due to solarization or radiation (Zukic et al. 1990a,b; Keffer et al. 1994).
Detailed prefilter designs have been given by Zukic et al. (1993).
Figure 19 shows the Ultraviolet Imager spectral transmission which used
reflections from three mirrors. A four-mirror CIV prefilter could be similar
but with improve peak transmission. The four mirrors would
be employed such that the two reflecting planes of a mirror pair are titled orthognal
to the other mirror pair. This arrangement (illustrated in Fig. 8) provides a
linear-polarization free optical arrangement since both the s and p-components are reduced equally
as prescribed by the Fresnel equations.
This section will discuss our development and construction of
a CIV interferometer and cover (i) the VUV dielectric coatings
and film-induced stress on the etalon plates, (ii) the fixed-gap
etalon to evaluate the plates and coatings, (iv) the construction
of the PZT tunable etalon, (iv) the control system, and (v) visible
light test. The final verification and results are discussed
in Sect. 4.
![\begin{figure}
\par\includegraphics[width=8.2cm]{6035fg15.eps} \end{figure}](/articles/aa/full/2007/02/aa6035-06/Timg134.gif) |
Figure 15:
Schematic of the test setup for
the VUV FPI for supplying a collimated beam using either the
pinholes or removing the pinholes and using the slowly diverging
laser beam. An aperture stop, in front of the FPI, determines the beam size through
the etalon.
|
| Open with DEXTER |
At 155 nm there are three transmitting substances for the etalon
plates: calcium fluoride, lithium fluoride and magnesium fluoride.
Following the Wüsler et al. (2000) study, we selected crystalline
MgF2 since it has been polished successfully and has less
hydroscopicity than LiF3 and are much less sensitive to shock
than CaF2. Within the 155 nm range, MgF2 shows no induced optical
degradation when irradiated with a beam simulating a high-energy
space environment (i.e., 1014 e/cm2 at 2 MeV) (Heath & Sacher
1966); whereas LiF shows strong optical degradations. The internal transmission of MgF2 at 155 nm is excellent, with typical transmittance of
 for
2-50 mm thicknesses; the main loss is surface reflections. Magnesium
fluoride is a birefringent optical crystal and any polarized
beam should be aligned along the optical axis to avoid birefringent
effects. The windows of the interferometer N2 housing are also
MgF2 and were cut so that the C-axis was perpendicular to the
polished surface. The polishing of MgF2 plates to a plate finesse
of better than 25 in the VUV was achieved (cf., Thorne & Howells
1998). ICOS polished two pairs of MgF2 etalon plates to a
curvature of less than /150 at
for
2-50 mm thicknesses; the main loss is surface reflections. Magnesium
fluoride is a birefringent optical crystal and any polarized
beam should be aligned along the optical axis to avoid birefringent
effects. The windows of the interferometer N2 housing are also
MgF2 and were cut so that the C-axis was perpendicular to the
polished surface. The polishing of MgF2 plates to a plate finesse
of better than 25 in the VUV was achieved (cf., Thorne & Howells
1998). ICOS polished two pairs of MgF2 etalon plates to a
curvature of less than /150 at
 nm (Fig. 11).
The two viable coatings for the VUV etalon are (i) metallic film
with MgF2 overcoat and (ii) an all dielectric multi-layer stack (Bruner
et al. 1997). The aluminum coatings with a magnesium fluoride
overcoat have the advantages of very low stress for the
two soft layers, provide broad-band reflectance, and have a short
coating time which reduces the final cost of the coatings. Their
disadvantages are the difficulty of reproducibility due to
Al2O3 developing on the exposed boundary during coating,
variations in reflectivity and absorption, and the extreme handling
care to avoid damaging the soft surfaces.
The best performance for aluminum is a reflectance of
R=0.73 and a loss of L=0.08.
The second and better alternative is our design choice of an all dielectric
stack with the advantages of durable, high reflectance coatings. Their absorptances
are a third of that of aluminum and improves
by 2 fold.
The resulting transmission profile (Fig. 12) provides a broad
passband prefilter (20 nm). The dielectric coating disadvantages
are i) they require a minimum of 25 coating runs
and hence are higher cost coatings; ii) they must employ low-stress
ion deposition coatings, and iii) need to employ -filter
technology to minimize the absorption.
The coatings that were used on the etalons are
-multilayers of high-low (LiF3-MgF2)
refractive layer pairs (Zukic et al. 1993). The -filters improve
the reflectivity and lower the absorption by decreasing the relative
thickness of the higher index layer while retaining each high-low
optical stack thickness to /2 (Zukic & Torr 1990,
1995). Because of the increased reflectivity, the
number of -stacks is less and the absorption further
reduced. Decreasing the LiF3/MgF2 paires
allows lower absorptance, and the ion deposition provides low
stress coatings. This makes use of the 10-4 value of the MgF2
extinction coefficient in the VUV (Zukic 1990a). The coating
requirements were
 at 153-157 nm.
The final test showed that the reflectance was within 0.01
of 0.77. A series of coating models were run to optimize the
absorptance, transmittance, bandpass, and layers. The reflectance decreases
with the H/L-ratio and the passband increases with H/L ratio.
The maximum reflectance and passband increases with the number of
layers in the coatings (Zukic & Torr 1995). The resulting H/L-ratio
was 1/4, with the optical thickness
at 153-157 nm.
The final test showed that the reflectance was within 0.01
of 0.77. A series of coating models were run to optimize the
absorptance, transmittance, bandpass, and layers. The reflectance decreases
with the H/L-ratio and the passband increases with H/L ratio.
The maximum reflectance and passband increases with the number of
layers in the coatings (Zukic & Torr 1995). The resulting H/L-ratio
was 1/4, with the optical thickness  /10
for LiF3 and
/10
for LiF3 and
 for MgF2. The 25 layer -coating design
was optimized with absorptance of L=0.008.
for MgF2. The 25 layer -coating design
was optimized with absorptance of L=0.008.
Dielectric interference coatings can impose substantial stress
on Fabry-Perot etalon plates from differential thermal expansions
of the coating deposited at elevated temperatures. Although
microcrystaline material structures might produce strains (Ristau et al. 2000),
the bulk thermal expansion coefficient of LiF3 and MgF
 K-1) are similar. Because stress can warp the
etalons and reduce the effective finesse, we evaluated the ion-deposited -coatings
by using a pair of identical MgF2 etalons. We have confirmed
the suitability of the coatings by showing that the film
stress is low. This was accomplished by coating
a pair of CIV etalons and then overcoating the elatons with with Al/Ag, for higher reflectance in the visible.
A fixed-gap Fabry-Perot/Fizeau unit was then assembled and tested optically with a HeNe laser interferometer.
K-1) are similar. Because stress can warp the
etalons and reduce the effective finesse, we evaluated the ion-deposited -coatings
by using a pair of identical MgF2 etalons. We have confirmed
the suitability of the coatings by showing that the film
stress is low. This was accomplished by coating
a pair of CIV etalons and then overcoating the elatons with with Al/Ag, for higher reflectance in the visible.
A fixed-gap Fabry-Perot/Fizeau unit was then assembled and tested optically with a HeNe laser interferometer.
![\begin{figure}
\par\includegraphics[width=7.4cm]{6035fg16.eps} \end{figure}](/articles/aa/full/2007/02/aa6035-06/Timg141.gif) |
Figure 16:
A simulated profile scan of the F2 laser lines over
two orders with etalon parameters: d=200 um, R=0.77,
 pm, pm,
 pm, maximum displacement = 1.9 pm, maximum displacement = 1.9  m. and step resolution = 1/4096. m. and step resolution = 1/4096.
 is the relative F2 line intensity lines (Sansonetti et al. 2001). The three F2 lines, from different orders, appear in the same .
|
| Open with DEXTER |
The initial efforts has been to build and test a 10 pm scanning
HRI. The etalon uses MgF2 plates. Because of the difficulty
of providing anti-reflection (AR) coatings at 155 nm and
possibly stressing the plates, the plates were given no
AR coatings. The single etalon equations for the central wavelength
 ,
,
finesse, and
passband (FWHM) used for the preliminary
design are given by: (i)
,
,
finesse, and
passband (FWHM) used for the preliminary
design are given by: (i)
 nm,
(ii)
pm, (iii)
nm,
(ii)
pm, (iii)
 / ln R=11, and (iv)
 pm, assuming no optical defects
(Vaughan 1989). The design parameters are shown
in Table 3 for a dual and triple etalon system.
pm, assuming no optical defects
(Vaughan 1989). The design parameters are shown
in Table 3 for a dual and triple etalon system.
Table 3:
Triple and dual-etalon and prefilter characteristics.
The construction of this first tunable VUV etalon used annular
ring mounting plates of Schott BK1 glass to hold the MgF2 etalon plates
(Fig. 14). The MgF2 plates were cemented onto angular rings
of Schott BK1 glass which was selected to match the temperature
coefficient of expansion of MgF2 (
 /K
and
/K
and
 /K). The mounting plates allow
a minimum thickness for the magnesium fluoride etalons.
/K). The mounting plates allow
a minimum thickness for the magnesium fluoride etalons.
The BK1 mounting plates are held by a modified Hansen mount as
improved by Hovemere Ltd. Each mounting plate is cemented to
pads on the cantilever Invar spring beam of split design (Killeen
et al. 1982). The spring design allows adjustment of tension
to match the piezoelectric forces by adjusting the split separation.
The piezoelectric stacks are PZT5H-I (lead zirconate titanate). The
applied voltage is controlled by a capacitance stabilized control
system such that each of the three piezoelectric stacks has a pair
of corresponding readout capacitance bridges and a reference
bridge. A transformer ratio bridge and phase-sensitive demodulators
provide the feedback system (cf., Jones & Richards 1973); this
allows tilt and piston shift motion control of the etalons by
a LabView-based software control system. The PZTs allow a variable range
of the gap distance of 1.8 m with 1/4098 digital resolution across
or a spatial gap resolution of 0.4 nm.
Although the reflectance in the visible is less than 2%, we
were able to perform tests of the etalon system using a stabilized
HeNe laser. For the HeNe
laser, the VUV FPI observations for a step range of 500-3000
is fitted with an Airy function (with loss fixed at 0.03) by
minimizing the OPD (gap distance), the reflectivity, the step
size scale, and the input amplitude using a least squares (Powell)
method. The time at each etalon position = 200 ms, hence the total scan
time was 8 min. The results were: the free spectral range
 nm,
OPD
d= 200.01019 microns, reflectance
nm,
OPD
d= 200.01019 microns, reflectance  ,
and distance
per step
,
and distance
per step
 pm. Using the fitted function, the
ratio of Imax/Imin was 1.0458 which gives a reflectance R= 0.0112.
This visible light test allowed the parallelism
parameters for the PZT controllers to be determined.
pm. Using the fitted function, the
ratio of Imax/Imin was 1.0458 which gives a reflectance R= 0.0112.
This visible light test allowed the parallelism
parameters for the PZT controllers to be determined.
![\begin{figure}
\par\includegraphics[width=7.3cm]{6035fg17.eps} \end{figure}](/articles/aa/full/2007/02/aa6035-06/Timg151.gif) |
Figure 17:
The diode current of an 11 order scan of the interferometer
(Table 5, scan C). With the F2 laser at low pressure, this scan shows
the effect of the lower intensity laser lines. Curve fitting
the total data set results in a
 nm, nm,
 pm, and step
size = 0.430 nm. The upper insert plots the noise (thin) and the
difference between the data and fitted curve (thick). The vertical lines
at 1600 mark the FWHM spectral width and profile center; the
vertical line at 1700 marks the profile center of the
next order. pm, and step
size = 0.430 nm. The upper insert plots the noise (thin) and the
difference between the data and fitted curve (thick). The vertical lines
at 1600 mark the FWHM spectral width and profile center; the
vertical line at 1700 marks the profile center of the
next order.
|
| Open with DEXTER |
The -coatings peak
wavelengths of the sample plates and transmittance were measured at the
the MSFC VUV spectrophotometric test facility. This facility also measured
the reflectance of the test dielectric coatings and the
MgF2 plates in the vacuum ultraviolet wavelength range. In order to minimize the
exposure of test optics to contamination, the spectrophotometric
system was maintained in a class 1000 clean room and in a stainless
steel vacuum chamber. A cryogenic hydrocarbon-free pumping system
was used to avoid contamination. The vacuum system operated with
a base pressure in the 10-7 torr range. For the VUV measurements,
a high-pressure arc discharge deuterium lamp was used as the source
in the 115-370 nm range. A 0.2 m vacuum monochromator, with a concave
holographic grating (1200 lines/mm) was the source to a 76.2 cm focal
length collimating UV enhanced mirror system. This produced a 10.2 cm
monochromatic collimated incident beam for our test optics.
Table 4:
Diode cross-calibration data.
To test the etalon assembly HRI (10 pm), we have used the spectral
lines obtained from a molecular F2 eximer laser as a surrogate
for CIV. The
157 nm eximer (excited dimer) lasing medium is an excited F2
diatomic molecule producing ultraviolet pulses. The etalon was scanned using the
Lambda Physik LPF220 molecular F2 eximer laser of the
University of Toronto's nanofabrication facility in Ontario,
Canada. The interferometer was placed in the optical delivery
chamber which consisted of a 2.5 m-long positive-pressure box
of N2. Molecular nitrogen will transmit wavelengths longer
than 145 nm, with the underlying continuum cross section of less
than
 cm2 (Hudson 1971; Samson & Ederer 2000).
The pulse laser beam has beam divergence
of 3 arcmin
cm2 (Hudson 1971; Samson & Ederer 2000).
The pulse laser beam has beam divergence
of 3 arcmin  10 arcmin (or 1 mrad
3 mrad) and has a repetition rate of 1 to 100 Hz
with energy per pulse of 25 mJ. The principal
F2 line has a 2 pm spectral width (FWHM) at He pressure of 4 atm,
the operating pressure of our measurements (Hill et al. 1993). The relative intensity of the weaker F2 lines is
dependent on the pressure and pulse rate of the laser. The effective
line finesse is at least greater
than FL>15 assuming that the pressure is less than 8
atm. The angular finesse for a 10 arcmin beam is the ratio of
the
to the FWHM spread caused by the beam
divergence:
10 arcmin (or 1 mrad
3 mrad) and has a repetition rate of 1 to 100 Hz
with energy per pulse of 25 mJ. The principal
F2 line has a 2 pm spectral width (FWHM) at He pressure of 4 atm,
the operating pressure of our measurements (Hill et al. 1993). The relative intensity of the weaker F2 lines is
dependent on the pressure and pulse rate of the laser. The effective
line finesse is at least greater
than FL>15 assuming that the pressure is less than 8
atm. The angular finesse for a 10 arcmin beam is the ratio of
the
to the FWHM spread caused by the beam
divergence:
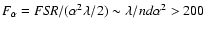 .
For the 1 mm pinhole, the divergence angle is much smaller
and is the pinhole aperture divided by twice the focal length
at
nm of the collimation lens):
.
For the 1 mm pinhole, the divergence angle is much smaller
and is the pinhole aperture divided by twice the focal length
at
nm of the collimation lens):
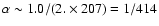 rad = 0.002 arcmin. Hence either with the pinhole or the normal laser beam
divergence, the finesse of the angular spread is insignificant
and the main broadening comes from the F2 line width.
rad = 0.002 arcmin. Hence either with the pinhole or the normal laser beam
divergence, the finesse of the angular spread is insignificant
and the main broadening comes from the F2 line width.
![\begin{figure}
\par\includegraphics[width=7cm]{6035fg18.eps} \end{figure}](/articles/aa/full/2007/02/aa6035-06/Timg156.gif) |
Figure 18:
The results of a 3 order scan of the 157 nm laser
(scan A1). A curve of the scan and offset plots of the residual
and reference beam are show. Curves in amps with solid line as
observed with diode detector using an optical collimated configuration.
The thinner curve is derived by fitting the observations with
an Airy function with Loss fixed at 0.045 and minimizing OPD
(gap distance), reflectivity, step size scale, and input amplitude
via a least squares (Powell) method.
|
| Open with DEXTER |
The schematic of the basic test setup for the measurements of
the VUV FPI in the nanofabrication facility is shown in Fig. 15. The F2 laser beam was collimated with a 1 mm pinhole and
lens (ISP MgF2 plano-convex lens 250 mm focal length
in the visible) and was also used with its normal divergence.
The Si diodes are Hamamatsu's S8852 with a
 mm active surface
area with a measured quantum efficiency of QE
mm active surface
area with a measured quantum efficiency of QE 0.80 at
155.0 nm and QE0.90 at 157.6 nm (Vest 2004). The diodes
have a typical rise time of 9 s and 0.11nA dark current.
The diodes were connected to picoammeters (Keithly picoammeter
KE6485 for detector D1 and KE6487 for detector D2) for a synchronized
record of the two intensities. The detector diode (D1) (on the
left of Fig. 15) records the variation of the incident intensity.
The detector (D2) recorded the integrated transmittance of the
parallel throughput of the etalon. Between the collimating lens
(L1) and the entrance window of the interferometer various aperture
windows were inserted. The etalon was modulated by the Hovemere
capacitance-stablized etalon controller (CSE) which handled the
etalon parallelism and sequencing of the etalon position.
The sequencing controlled the starting step position, number
of steps, the stepping size (typ. 2 pm), and dwell time (typ.
200 ms). The dwell time was set to acquire a measurement and read the data.
The overall control system was PC based and programmed under
LabView with USB/GBIP interfaces to the picoameters and a USB/RS232
interface to the CSE controller. An external trigger was supplied
by the controller to initiate simultaneous 10 multiple readings
of the picoammeters.
0.80 at
155.0 nm and QE0.90 at 157.6 nm (Vest 2004). The diodes
have a typical rise time of 9 s and 0.11nA dark current.
The diodes were connected to picoammeters (Keithly picoammeter
KE6485 for detector D1 and KE6487 for detector D2) for a synchronized
record of the two intensities. The detector diode (D1) (on the
left of Fig. 15) records the variation of the incident intensity.
The detector (D2) recorded the integrated transmittance of the
parallel throughput of the etalon. Between the collimating lens
(L1) and the entrance window of the interferometer various aperture
windows were inserted. The etalon was modulated by the Hovemere
capacitance-stablized etalon controller (CSE) which handled the
etalon parallelism and sequencing of the etalon position.
The sequencing controlled the starting step position, number
of steps, the stepping size (typ. 2 pm), and dwell time (typ.
200 ms). The dwell time was set to acquire a measurement and read the data.
The overall control system was PC based and programmed under
LabView with USB/GBIP interfaces to the picoameters and a USB/RS232
interface to the CSE controller. An external trigger was supplied
by the controller to initiate simultaneous 10 multiple readings
of the picoammeters.
Assuming perfect flatness and normal incident, the
interferometer intensity for the triplet F2 laser lines is
the incident intensity I0 times the sum of the Airy transmission
functions for a collimated beam plus dark current/background
term
 .
As a function of the CSE etalon steps, s, the modulated
intensity is:
.
As a function of the CSE etalon steps, s, the modulated
intensity is:
The least squares difference between the data and this function
is minimized using a Powell conjugate gradient method to derive
gap distance, d, reflectance R, and distance per step
pm, where the OPD gap distance is given as
 .
The (
.
The (
 ,
Ti) values were [(157.63094,1.00),
(157.52443,0.20),(157.40231,0.07)]. For the F2 laser, the weaker two wavelengths are offset
from the strongest line by 106.61 pm and 228.63 pm which are greater
than the ,
and hence appear in different orders (see Fig. 16). The Ti values are adjusted for various pressure settings
and cadences of the F2 laser (see Figs. 17 and 18).
,
Ti) values were [(157.63094,1.00),
(157.52443,0.20),(157.40231,0.07)]. For the F2 laser, the weaker two wavelengths are offset
from the strongest line by 106.61 pm and 228.63 pm which are greater
than the ,
and hence appear in different orders (see Fig. 16). The Ti values are adjusted for various pressure settings
and cadences of the F2 laser (see Figs. 17 and 18).
The etalon scans were performed and recorded by a LabView program.
The F2 laser pulse rate was 1, 10, or 100 Hz with the laser
voltages set at 26 kV, 24 kV, and 24 kV, respectively. At the higher
two cadences and lower voltage, the two parasitic F2 emissions
were effectively absent (cf. Fig. 18). In Table 5, the scans A
and B were obtained with a cadence of 100 Hz with pinholes removed, and
scan C was obtained at 10 Hz with one pinhole being used.
In Table 5 where there are two entries for scans A and B, we have assumed
two different spectral widths for the F2 laser (FWHM = 10 and (30) pm). This provides a
slight change of 0.7 in the final finesse. Scans A and B are over three orders while scan C is over
6 orders with a higher laser gas pressure. The calculated loss is L=0.048. In Table 6, we have assumed
the laser width of 30 pm, giving the final total finesse of 5.95.
![\begin{figure}
\par\includegraphics[width=7cm]{6035fg19.eps} \end{figure}](/articles/aa/full/2007/02/aa6035-06/Timg163.gif) |
Figure 19:
VUV transmission spectrum of the UVI tri-filter yeilding a peak at 151 nm
with a 7.5 nm FWHM passband. The prefilter
coatings will improve on the UVI profile by an additional reflection
and optimization of the individual coating peak transmission. The transmittance
is the product of three mirror reflections.
|
| Open with DEXTER |
The derived finesse must be corrected for the angular finesse
 and for the laser line finesse
  ,
however, these
are
,
however, these
are
 and
and
 and do not significantly
affect the final finesse. In Table 5 the measured values of the
etalon are shown with the correction of the line width of the
laser beam assuming both a 15 and 30 pm line width (Hill et al. 1993). Because of slight differences in the coating reflectivity,
a finesse correction for wavelength difference is also included
by assuming that the defect finesse is constant and only the
reflectivity finesse changes.
and do not significantly
affect the final finesse. In Table 5 the measured values of the
etalon are shown with the correction of the line width of the
laser beam assuming both a 15 and 30 pm line width (Hill et al. 1993). Because of slight differences in the coating reflectivity,
a finesse correction for wavelength difference is also included
by assuming that the defect finesse is constant and only the
reflectivity finesse changes.
To obtain the interferometer transmittance of the etalon plates
a number of operations were needed. First, with a 1 mm beam, the total
transmittance of the interferometer with its two entrance windows
was measured by placing a photodiode (D1) behind the collimating
lens and then removing it and recording across 2
spectral range with
the main photodiode (D2), located after the de-collimating lens.
Both diodes captured the total beam intensity. The ratio of the
input intensity (
 ), (the intensity in front of the interferometer),
to the output intensity (
), (the intensity in front of the interferometer),
to the output intensity (
 ), (the maximum peak intensity
behind the interferometer and the decollimating lens) was
), (the maximum peak intensity
behind the interferometer and the decollimating lens) was
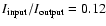 .
Second, the calibration factor between the two photodiodes was
applied. The diode calibration was preformed by having both diodes
view the same uniformly illumated source surface. The results
from the two illumination levels for the cross calibration was
determined (Table 4). Third, because of the microroughness of
typical MgF2 interfaces, the main loss of MgF2 elements occurs
at the surfaces and this needs to be corrected. The 155 nm data
of West (2004, Fig. 8) for two thicknesses of MgF2 provide
the correction. A thin (2.5 mm) doubled-surface optical element had
a loss of 75% while a thick (50 mm) four surface had
a loss of 58%. For the MgF2 elements, the transmission is written
as
.
Second, the calibration factor between the two photodiodes was
applied. The diode calibration was preformed by having both diodes
view the same uniformly illumated source surface. The results
from the two illumination levels for the cross calibration was
determined (Table 4). Third, because of the microroughness of
typical MgF2 interfaces, the main loss of MgF2 elements occurs
at the surfaces and this needs to be corrected. The 155 nm data
of West (2004, Fig. 8) for two thicknesses of MgF2 provide
the correction. A thin (2.5 mm) doubled-surface optical element had
a loss of 75% while a thick (50 mm) four surface had
a loss of 58%. For the MgF2 elements, the transmission is written
as
 thickness), i.e. a product of the surface
transmission T
thickness), i.e. a product of the surface
transmission T
 and the internal transmission (
 thickness).
Hence the absorption per unit length is
thickness).
Hence the absorption per unit length is
 mm-1 and the loss per surface is
 .
Hence surface effects
dominate the transmission loss. The center thickness of the collimating
lens is 5.9 mm, the etalons are each 12 mm thick, and the windows
are each 7 mm thick. This gives a total path length of 43.9 mm
of MgF2 resulting in an internal absorption of 7.6%. The total
percent loss from the two etalons, two windows, and one de-collimating
lens (12 surfaces) is a factor of 1/0.272 giving a corrected
throughput of 42.6% for the coatings. The forth correction results
from the etalon removing the lesser line components of the F2
laser (see Table 4). This correction factor is 1/0.73. Therefore,
the final corrected throughput of the etalon coatings is 58%.
This corresponds to an absorption value of A=0.048 for the coatings.
Accounting for the throughput by the MgF2 etalon, the interferometer
effective throughput is 34% as a unit.
.
Hence surface effects
dominate the transmission loss. The center thickness of the collimating
lens is 5.9 mm, the etalons are each 12 mm thick, and the windows
are each 7 mm thick. This gives a total path length of 43.9 mm
of MgF2 resulting in an internal absorption of 7.6%. The total
percent loss from the two etalons, two windows, and one de-collimating
lens (12 surfaces) is a factor of 1/0.272 giving a corrected
throughput of 42.6% for the coatings. The forth correction results
from the etalon removing the lesser line components of the F2
laser (see Table 4). This correction factor is 1/0.73. Therefore,
the final corrected throughput of the etalon coatings is 58%.
This corresponds to an absorption value of A=0.048 for the coatings.
Accounting for the throughput by the MgF2 etalon, the interferometer
effective throughput is 34% as a unit.
This section discusses the methodology for a development of CIV
spectral filter with reference to the development that has been
performed and reported here. Clearly, the multiple etalon Fabry
Perot interferometer characteristics are based on a tradeoff between having
maximum spectral resolution with high throughput and the ability
to manufacture a prefilter of minimum passband. The proposed
etalon characteristics for a CIV interferometer are shown in
Table 2 and Fig. 8. For the fixed-gap etalon, the gap distance
is 3.42 m and tilt tunable. For this small gap-distance
along with the fact that the large FWHM is 3.5 nm, the etalon
can be constructed as a fixed-gap etalon. This
fixed-gap design assures that the etalon plates will not touch during launch vibration and
simplifies a spacecraft instrument. The second tuning etalon (Fig. 8) has
a FWHM of 10 pm to be compatible with the defect finesse.
The 10 pm filter design for spaceflight is compatible with the
1/4th line-width criteria. The
field of view (FOV) effect on wavelength shift for a telescope
aperture and an etalon aperture size was considered and found
acceptable for the SUMI telescope but the orbital instrument will
depend on the specific mission capabilities and its optical configuration.
The top etalon in Fig. 8, a 2 pm FWHM interferometer, provides the triple etalon system
with high spectral resolution for complete line profiling.
The etalon from our coating test can be refurbished into a fixed-gap
(LRI) etalon. The LRI etalon plates need to be repolished and
coated with similar high-reflectance (R=0.95,
 )
coatings
to Figs. 10. The LRI in a fix-gap, thermal control,
tilt-tuning assembly will allow selection of a specific spectral
order when combined with the prefilter profile. The etalon spacers,
mounting supports, and thermal controller for the LHI can be
readily provided by current technology. The high finesse is accomplished
with the -coatings and having the unit as a fixed-gap
etalon (Zukic 2000).
)
coatings
to Figs. 10. The LRI in a fix-gap, thermal control,
tilt-tuning assembly will allow selection of a specific spectral
order when combined with the prefilter profile. The etalon spacers,
mounting supports, and thermal controller for the LHI can be
readily provided by current technology. The high finesse is accomplished
with the -coatings and having the unit as a fixed-gap
etalon (Zukic 2000).
The four-mirror prefilter design uses the proven tri-filter UVI coatings (cf. Fig. 19).
The VUV FPI prefilter can improve on the UVI coatings with a transmittance of  80%.
80%.
The results and design given here demonstrate that a VUV FP interferometer
can provide a CIV spectral filter for the solar transition region.
This unit can result in a smaller optical system and hence a
smaller focal-plane spacecraft instrument that reduces the overall
cost as compared to spectrographs. It also allows a higher throughput
at high spectral sensitivity, allows short exposures, and improves
the magnetic sensitivity of solar magnetographs. The successful
development and testing of the VUV FP interferometer will (i)
provide new technology for solar science and (ii) allow for solar
transition region magnetographs for future space mission and
for specific spaceflight TR magnetographs. The investigation
of this alternate optical configuration will provide specific
opportunities for the CIV VUV FPI for sound rocket experiments
using exising telescopes, detectors, and orbiting mission which
are now in a instrument definition phase. Figure 20 gives sounding rocket configuration
based on using the SUMI 30 cm aperture telescope. This FPI configuration is about
a third of the SUMI spectrograph length and mass.
Table 5:
CIV VUV etalon parameters.
Our results are the following: Two
pairs of MgF2 etalon plates have been polished to better than a /150
at 633 nm or
 at
155 nm (
at
155 nm (
 ). A primary set of test plates were coated
with the designed 77% reflectance at 155 nm. The coatings were
stress-free VUV dielectric coatings having low-absorption -coatings.
These coatings were then applied to the second pair of etalon
plates. The tunable interferometer was assembled with MgF2
plates mounted to annular rings of silica glass of matching CTE
in a novel design and was mounted as a piezoelectric-tunable,
capacitance-stabilized etalon. The etalon was placed in a Hovemere's
Hansen optical mount for low induced mechanical stress. A LabView-based
program for the control system was developed to evaluate the
interferometer. The evaluation with 157 nm F2 laser provides
the characteristics given in Table 2. The result of this program
is an operational and robust CIV VUV interferometer.
). A primary set of test plates were coated
with the designed 77% reflectance at 155 nm. The coatings were
stress-free VUV dielectric coatings having low-absorption -coatings.
These coatings were then applied to the second pair of etalon
plates. The tunable interferometer was assembled with MgF2
plates mounted to annular rings of silica glass of matching CTE
in a novel design and was mounted as a piezoelectric-tunable,
capacitance-stabilized etalon. The etalon was placed in a Hovemere's
Hansen optical mount for low induced mechanical stress. A LabView-based
program for the control system was developed to evaluate the
interferometer. The evaluation with 157 nm F2 laser provides
the characteristics given in Table 2. The result of this program
is an operational and robust CIV VUV interferometer.
The specific TR scientific investigations of imaging, doppergraphy,
and magnetography have been discussed. The high resolution imaging
potential of the transition region by the current set of spacecraft
as well as sounding rocket flights is impressive. The study of
these images has shown the highly dynamic behavior of the transition
region to the limit of spatial resolution. In the VUV, the emission
lines are generally optically thin which should allow future
spaceflight observations to view down to the scale of the finer
physical processes and allow magnetic heating to be understood. However
the fine scale features will be associated with short time events
since the transition region has very short (seconds) conductive
time scales. This requires rapid imaging to avoid smoothing dynamic
events.
![\begin{figure}
\par\includegraphics[width=7cm]{6035fg20.eps} \end{figure}](/articles/aa/full/2007/02/aa6035-06/Timg180.gif) |
Figure 20:
A sounding rocket configuration of a triple FPI system
with the folding mirror prefilters feeding a CIV CCD camera system.
The design makes use of the cold-mirror 30cm-aperture telescope
for the Solar Ultraviolet Magnetograph Investigation (SUMI, West
et al. 2000) which was designed to transmit only the CIV (155 nm) and MgII (280 nm) wavelength bands ( FWHM
15 - 45 nm).
|
| Open with DEXTER |
The configuration of the photospheric and chromosphere-coronal
magnetic fields in a stressed active region and a highly
sheared low-lying core field is assumed to be enclosed within
a more nearly potential arcade of loops at some higher level.
Whether the shear decreases with height between the photosphere
and chromosphere in such a region, as we might expect from the
overall change, has not been observed. The shear might even increase over
this lower range. An inversion layer investigation of the magnetic
field can show whether the shear increases or decreases with
height between the photosphere and chromosphere. Transition region
magnetography may find changes in rapidly-evolving active regions
as the core fields reconnect to change the shear. This possibility
was the prime motivation of the sounding rocket program SUMI/MSFC
which through improved technology will extend measurements of
the magnetic field higher into the transition region.
Table 6:
Measured characteristics of the VUV 10 pm interferometer.
A scientific objective of the CIV FPI observations is to characterize the magnetic field in an atmosphere
layer of flare locations and determine the 3D magnetic field
structure of solar active regions. The radiometry and polarization values show that it is possible
but not easy. The HRTS instrument gives the peak line intensity for
the two CIV lines as CIV (154.8185 nm) = 2.1 erg cm-2 s-1 sr-1
and CIV (155.0774 nm) = 1.2 erg cm-2 s-1 sr-1 (Roussel-Dupree 1984).
The etalon system will need a 2-7 pm spectral resoluton in order
to perform the spectral isolation of 1/4 of the CIV
line width. A polarimeter and camera system will be needed to
obtain the appropriate V/I measurements over an active region.
The Lande g-factors are
 (154.82) and
 (155.08). The 154.82 nm line is about 1.5 times stronger and
has an observed width
(155.08). The 154.82 nm line is about 1.5 times stronger and
has an observed width
 pm or
Gaussian effective width
pm or
Gaussian effective width
 pm.
For
pm.
For
 pm, one obtains the
normalized Zeeman splitting
pm, one obtains the
normalized Zeeman splitting
 B2, the normalized Stokes-V maximum value
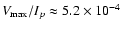 B2, and the normalized Stokes-Q,
 . For the field strength of B=1000 G, the
 and
and
 ;
hence for a full vector
magnetograph, a meter-class space telescope is needed to obtain
the full vector field at CIV, but this is a relatively small
step and within the state of the art (Gary et al. 2006).
;
hence for a full vector
magnetograph, a meter-class space telescope is needed to obtain
the full vector field at CIV, but this is a relatively small
step and within the state of the art (Gary et al. 2006).
Another scientific objective of the CIV
VUV FPI is to provide rapid cadence of the transition region where
chromospheric material is being injected from below, where
compensating coronal plasma is being injected from above, and where
waves and shocks are propagating to heat the corona.
The observation of HRTS at 156.07-156.15 nm of CI have shown CI
upflow jets (Hoekzema et al. 1997) having blue-shifted events
of 15-25 km s-1 that last for 40s, whereas most plasma from
the lower transition region is blue shifted at 10 km s-1 (Solanki
& Hammer 2001). The apparent downflows and upflows might be
a compression region due to acoustic waves from magnetic heating,
or the counter flow might be a consequence of contained chromospheric
ejections undergoing temperature changes during their lifetime.
Hansteen & Wikstol (1994) point out that the CIV ionization
state is highly dependent on velocity, density, and temperature
and that rebound shock models might explain the velocity paradox.
Solanki & Hammer (2001) states that the ultimate understanding
needs more detailed observations which can be provided by Doppler
imaging. Doppler imaging will also allow better understanding
of traveling waves by analysis of time delays between observations
in different levels of the atmosphere. Moreover the energetics
of the lower transition region is a key to the heating of the
corona and mass loss to the solar wind and the FPI will allow
rapid, 2D Dopplergrams in context with TR magnetograms.
Acknowledgements
We thank Dr. David Schiminovich (Space Radiation Laboratory,
California Institute of Technology) for making critical VUV reflectivity
measurement on etalon coating when the MSFC VUV test facility
was under repair. We appreciate greatly the support by Dr. Jianzhao
Li (Department of Electrical and Computer Engineering, University
of Toronto) for supporting the verification measurements in the
F2 Laser Microfabrication System. We thank Dr. Ken Dere (George
Mason University) for supply the HRTS spectral image of CIV.
We thank Drs. John M. Davis and James Spann (MSFC/NASA) for their
support and encouragement during the development and testing
of the VUV interferometer. We appreciate the suggestions of the referee which
have improved the paper.
- Atherton, P.
D., Reay, N. K., Ring, J., & Hicks, T. R. 1981, Soc.
Photo-Optical Eng., 20, 806 [NASA ADS] (In the text)
- Bartoe, J.-D. F.,
Brueckner, G. E., Purcell, J. D., & Tousey, R. 1977, Appl.
Opt., 16, 879 [NASA ADS] (In the text)
- Baskin, S., &
Stoner, Jr., J. O. 1975, Atomic Energy Level and Grotrian Diagrams
(New York: Elsevier)
- Bideau-Méhy,
A., Guern, Y., Abjean, R., & Johannin-Gilles, A. 1976, Appl.
Opt., 15, 2626 [NASA ADS] (In the text)
- Bideau-Méhy,
A., Guern, Y., Abjean, R., & Johannin-Gilles, A. 1980, J. Phys.
E: Sci. Instrum., 13, 1159 [NASA ADS] [CrossRef] (In the text)
- Bideau-Mehy, A.,
Guern, Y., & Abjean, R. 1983, J. Phys. Sci. Inst., 17, 255
- Bideau-Méhy,
A., Guern, Y., Abjean, R., & Johannin-Gilles, A. 1984, J. Phys.
Sci. Inst., 17
- Borrero, J. M.,
Solanki, S. K., Bellot Rubio, L. R., Lagg, A., & Mathew, S. K.
2004, A&A, 422, 1093 [NASA ADS] [CrossRef] [EDP Sciences] (In the text)
- Bruner, M. E.,
Wülser, J.-P., Zukic, M., & Hoover, R. B. 1997, Proc.
SPIE, 3113, 441 [NASA ADS] (In the text)
- Brueckner, G.
E., et al. 1995, Sol. Phys., 162, 311 [CrossRef] (the issue also includes
description of SUMER and UVCS)
- Chae, J., Wang, H.,
Lee, C.-Y., et al. 1998, ApJ, 497, L109 [NASA ADS] [CrossRef] (In the text)
- Dammasch, I.
E., Wilhelm, K., Curdt, W., & Hassler, D. M. 1999, A&A,
346, 285 [NASA ADS] (In the text)
- De Pontieu,
B., Tarbell, T. 2002, Bull. AAS, 34, 790 [NASA ADS] (In the text)
- De Pontieu,
B., Erdélyi, R., & De Wijn, A. G. 2003, ApJ, 595, L63 [NASA ADS] [CrossRef] (In the text)
- DeForest, C. E.
2004, ApJ, 617, L89 [NASA ADS] [CrossRef] (In the text)
- Dere, K. P., Bartoe,
J.-D., F, & Brueckner, G. E. 1982, ApJ, 259, 366 [NASA ADS] [CrossRef] (In the text)
- Dere, K. P., Bartoe,
J.-D. F., Brueckner, G. E., et al. 1991, J. Geophys. Res., 96, A6,
9399.
(In the text)
- Feldman, U.,
Widing, K. G., & Warren, H. P. 1999, ApJ, 522, 1133 [NASA ADS] [CrossRef] (In the text)
- Gary, G. A. 1990, Mem.
Soc. Aston. It., 61, 457 [NASA ADS]
- Gary, G. A. 2001, Sol.
Phys., 203, 71 [NASA ADS] [CrossRef] (In the text)
- Gary, G. A.,
Balasubramaniam, K. S., & Sigwarth, M. 2003, Proc. SPIE, 4853,
252 [NASA ADS] (In the text)
- Gary, G. A., West, E.
A., Rees, D., Zukic, M., Herman, P., & Li, J, 2006, CIV Vacuum
Ultraviolet Fabry-Perot Interferometers for Transition-Region
Magnetography, ASP Conf. Ser., in press
(In the text)
- Gontikakis,
C., Peter, H., & Dara, H. C. 2003, A&A, 408, 743 [NASA ADS] [CrossRef] [EDP Sciences] (In the text)
- Guern, Y.,
Bideau-Méhu, A., Abjean, R., & Johannin-Gilles, A. 1974,
Opt. Commun., 12, 66 [NASA ADS] [CrossRef] (In the text)
- Hagyard, M. J.,
Gary, G. A., & West, E. A. 1988, The SAMEX Vector Magnetograph,
NASA Tech. Memo. 4048
(In the text)
- Handy, B. N., Bruner,
M. E., Tarbell, T. D., et al. 1998, Sol. Phys., 183, 29 [NASA ADS] [CrossRef] (In the text)
- Hansteen, V.
H., & Wikstol, O. 1994, Space Sci. Rev, 10, 103 [NASA ADS] [CrossRef] (In the text)
- Hays, P. B., &
Snell, H. E. 1991, Appl. Opt., 30, 3108 [NASA ADS]
- Heath, D. F., &
Sacher, P. A. 1966, Appl. Opt., 5, 937 [NASA ADS] (In the text)
- Herman et al. 2001,
Proc. SPIE, 4247, 149
- Hernandez, G.
1986, Fabry-Perot Interferometers (New York: Cambridge University
Press)
(In the text)
- Hicks, T. R., Reay,
N. K., & Atherton, P. D. 1984, J. Phys. E; Sci. Instrum., 17,
49 [NASA ADS] (In the text)
- Hill, P. C., Herman, P.
R., & Sia, R. 1993, J. Appl. Phys., 73, 5274 [NASA ADS] [CrossRef] (In the text)
- Hoekzema, N.
M., Rutten, R. J., & Cook, J. W. 1997, ApJ, 474, 518 [NASA ADS] [CrossRef] (In the text)
- Hudson, R. D. 1971,
Rev. Geophys. Space Phys., 9, 305 [NASA ADS] (In the text)
- Jelinsky, P. N.,
Morrissey, P. F., Malloy, James, M., et al. 2003, Proc. SPIE, 4854,
233 [NASA ADS] (In the text)
- Keffer, C. E.,
Torr, M. R., Zukic, M., Spann, J. F., Torr, D. G., & Kim, J.
1993, Appl. Opt., 33, 6041 [NASA ADS]
- Kentischer,
T. J., Schmidt, W., Sigwarth, M., & Uexkull, M. V. 1998,
A&A, 340, 569 [NASA ADS] (In the text)
- Killeen, T. L.,
Hays, P. B., Kenndy, B. C., & Rees, D. 1982, Appl. Opt., 21,
3903 [NASA ADS] (In the text)
- Killeen, T. l. et
al. 1999, Proc. SPIE, 3756, 289 [NASA ADS]
- Korendyke, C.
M., Vourlidas, A., Cook, J. W., et al. 2001, Sol. Phys., 20,
63 [NASA ADS] [CrossRef] (In the text)
- Madjarksa, M.
S., & Doyle, J. G. 2003, A&A, 402, 731 [NASA ADS]
- McKay, J. A. 1999,
Appl. Opt., 38, 5851 [NASA ADS] (In the text)
- McKay, J. A., &
Rees, D. J. 2000, Optical Engineering, 39(01), 315
- Moore, R. L., &
Sterling, A. C. 2005, Initiation of Coronal Mass Ejections, Solar
Eruptions and Energetic Particles, ed. N. Gopalswamy, AGU,
Washington
(In the text)
- Peter, H. 2000,
A&A, 360, 1108 (In the text)
- Peter, H. 2001,
A&A, 374, 1108 [NASA ADS] [CrossRef] [EDP Sciences] (In the text)
- Peter, H., Gudiksen,
B. V., & Norlund, A. 2004, ApJ, 617, L85 [NASA ADS] [CrossRef]
-
Pietraszewski, C. 2001, private communications
- Porter, J. G.,
Moore, R. L., Reichmann, E. J., et al. 1987, ApJ, 323, 380 [NASA ADS] [CrossRef] (In the text)
- Porter, J. G.,
& Dere, K. P. 1991, ApJ, 370, 380 [CrossRef] (In the text)
- Rees, D. 2005, private
communication
- Roussel-Dupree,
R., et al. 1984, ApJ, 278, 428 [NASA ADS] [CrossRef] (In the text)
- Ristau, D.,
Günster, S., Bosch, S., et al. 2000, Appl. Opt., 41, 3196 [NASA ADS] (In the text)
- Samson, J. A.,
& Ederer, D. L. 2000, Vacuum Ultraviolet Spectroscopy I (N.Y.:
Academic Press), Sect. 16.4.3
(In the text)
- Scharmer, G. B.
2005, A&A, 446, 1111 (In the text)
- Smith, W. J. 2000,
Modern Optical Engineering (N.Y.: McGraw-Hill), second edition,
47
- Solanki, S. K.,
&, Hammer, R. 2001, The Solar Atmosphere, The Century of Space
Science, ed. M. Huber, J. Geiss, & J. Bleeker (New York:
Springer), 1065
(In the text)
- Stenflo, J. O.,
Biverot, H., & Stenmark, L. 1976, Appl. Opt., 15, 1188 [NASA ADS]
- Tang, F., Howard, R.,
& Adkins, J. M. 1984, Sol. Phys., 91, 75 [NASA ADS] [CrossRef] (In the text)
- Tauger, J. T. 1976,
Appl. Opt., 15, 2998 [NASA ADS]
- Tarbell, T. D.,
Handy, B. N., & Judge, P. G. 1999, AAS, 31, 960 [NASA ADS] (In the text)
- Thorne, A. P.,
& Howells, M. R. 1998, Experimental Methods in the Physical
Sciences (Academic Press), 73
(In the text)
- Tritschler,
A., Schmidt, W., Langhans, W., Langhans, K., & Kentischer, T.
2002, Sol. Phys., 211, 17 [NASA ADS] [CrossRef] (In the text)
- Uitenbroek,
H. 2001, ApJ, 557, 389 [NASA ADS] [CrossRef]
- Vest, R. E. 2004, NIST
FUV diode calibration report (private communication)
(In the text)
- Vaughan, J. M.
1989, The Fabry-Perot Interferometer-History, Theory, Practice and
Applications (Philadelphia: Adam Hilger)
(In the text)
- von der Lühe, O.,
& Kentischer, Th. J. 2000, A&A, 146, 499 [NASA ADS] (In the text)
- West, E. A., Porter, J.
G., Davis, J. M., et al. 2000, Proc. SPIE, 4139, 350 [NASA ADS] (In the text)
- West, E. A., Porter, J.
G., Davis, J. M., et al. 2001, Proc. SPIE, 4498, 101 [NASA ADS] (In the text)
- West, E. A., Porter, J.
G., Davis, J. M., et al. 2004, Proc. SPIE 5488, 801
(In the text)
- Wülser, J.-P.,
Rosenberg, A., & Bruner, M. E. 2000 , Proc. SPIE, 4139,
390
(In the text)
- Xia, L. D., Popescu, M.
D., & Doyle, J. G. 2004, Proc. of the SOHO 15 Workshop, ESA
SP-575, 362.
(In the text)
- Zukic, M., Torr, D.
F., Spann, J. F., & Torr, M. R. 1990a, Appl. Opt., 29, 28,
4284
(In the text)
- Zukic, M., Torr, D.
G., Spann, J. F., & Torr, M. R. 1990b, Appl. Opt., 29, 28,
4293
- Zukic, M., Torr, D.
G., Kim, J., Spann, J. F., & Torr, M. R. 1993, Opt. Eng., 32,
3069 [NASA ADS] (In the text)
- Zukic, M., &
Torr, D. G. 1995, Thin Films for Optical Coatings, Thin Films for
Optical Coatings, ed. R. E. Hummel, & K. H. Guenther (New York:
CRC Press), 79
(In the text)
- Zukic, M. 1998,
Fabry-Perot Etalons within 120-155 nm FUV Range, private
commun.
(In the text)
Copyright ESO 2006
![\begin{figure}
\par\includegraphics[width=7.2cm]{6035fg01.eps} \end{figure}](/articles/aa/full/2007/02/aa6035-06/img21.gif)
![\begin{figure}
\par\includegraphics[width=7cm]{6035fg02.eps} \end{figure}](/articles/aa/full/2007/02/aa6035-06/img26.gif)
![\begin{figure}
\par\includegraphics[width=7cm]{6035fg03.eps} \end{figure}](/articles/aa/full/2007/02/aa6035-06/img29.gif)
![\begin{figure}
\par\includegraphics[width=7cm]{6035fg04.eps} \end{figure}](/articles/aa/full/2007/02/aa6035-06/img30.gif)
![\begin{figure}
\par\includegraphics[width=7cm]{6035fg05.eps} \end{figure}](/articles/aa/full/2007/02/aa6035-06/img33.gif)
![\begin{displaymath}T = \left(\Omega^{2}/ (1-R)^{2}\right) /\left[ 1 + \left\{ 4 ...
... \pi n
d \cos(\theta) / \lambda) \right\} / (1-R)^{2} \right]
\end{displaymath}](/articles/aa/full/2007/02/aa6035-06/img66.gif)
![\begin{displaymath}T = (1-R)^{2} \left[1- 2R\cos ( 4\pi ~n~ d \cos(\theta)/\lambda)+
R^{2} \right]^{-1}.
\end{displaymath}](/articles/aa/full/2007/02/aa6035-06/img70.gif)
![\begin{figure}
\par\includegraphics[width=7cm]{6035fg07.eps} \end{figure}](/articles/aa/full/2007/02/aa6035-06/img74.gif)
![\begin{figure}
\par\includegraphics[width=7cm,clip]{6035fg08.eps} %
\end{figure}](/articles/aa/full/2007/02/aa6035-06/img76.gif)
![\begin{figure}
\par\includegraphics[width=7cm]{6035fg09.eps} \end{figure}](/articles/aa/full/2007/02/aa6035-06/img79.gif)
![\begin{figure}
\par\includegraphics[width=7cm]{6035fg10.eps} \end{figure}](/articles/aa/full/2007/02/aa6035-06/img80.gif)
![\begin{figure}
\par\includegraphics[width=7cm]{6035fg12.eps} \end{figure}](/articles/aa/full/2007/02/aa6035-06/img122.gif)
![\begin{figure}
\par\includegraphics[width=7cm]{6035fg13.eps} \end{figure}](/articles/aa/full/2007/02/aa6035-06/img123.gif)
![\begin{displaymath}{\it FWHM}_{\rm eff} = \left[({\it FWHM})^{2} + (\alpha^{2} \lambda /2)^{2} \right]^{1/2}.
\end{displaymath}](/articles/aa/full/2007/02/aa6035-06/img128.gif)
![\begin{figure}
\par\includegraphics[width=7cm]{6035fg14.eps} \end{figure}](/articles/aa/full/2007/02/aa6035-06/img133.gif)
![\begin{figure}
\par\includegraphics[width=7.4cm]{6035fg16.eps} \end{figure}](/articles/aa/full/2007/02/aa6035-06/img141.gif)
![\begin{figure}
\par\includegraphics[width=7.3cm]{6035fg17.eps} \end{figure}](/articles/aa/full/2007/02/aa6035-06/img151.gif)
![\begin{figure}
\par\includegraphics[width=7cm]{6035fg18.eps} \end{figure}](/articles/aa/full/2007/02/aa6035-06/img156.gif)
![\begin{eqnarray*}I({\rm s})&=& I_{0} \sum^{3}_{i=1} \Big [T_{i}\left((1-R+L)^{2}...
...s) / \lambda_{i})\right \} / (1-R)^{2}
]^{-1} \Big]+I_{\rm dk}.
\end{eqnarray*}](/articles/aa/full/2007/02/aa6035-06/img160.gif)
![\begin{figure}
\par\includegraphics[width=7cm]{6035fg19.eps} \end{figure}](/articles/aa/full/2007/02/aa6035-06/img163.gif)