D. Bewsher1 - D. E. Innes2 - C. E. Parnell3 - D. S. Brown3
1 - ESA Research and Scientific Support Department, NASA/GSFC, Mailcode 682.3, Greenbelt, MD 20771, USA
2 - Max-Planck-Institut für Aeronomie, Katlenburg-Lindau 37191, Germany
3 - Mathematical Institute, University of St Andrews, North Haugh, St Andrews, Fife, KY16 9SS, Scotland
Received 27 April 2004 / Accepted 1 November 2004
Abstract
Blinkers are brightenings at network cell junctions that are traditionally
identified with SOHO/CDS and explosive events or high velocity events are identified
in high resolution UV spectra obtained from HRTS and SOHO/SUMER. Criteria are
determined to facilitate objective automatic identification of both blinkers
and explosive events in both SOHO/CDS and SOHO/SUMER data. Blinkers are
identified in SUMER data, if the temporal resolution of the data is reduced
to that of CDS. Otherwise short lived, localised intensity enhancements that
make up the blinker are identified. Explosive events are identified in CDS
data when the line width is significantly increased, and occasionally if there
is an enhancement in the wing of the line profile. A theoretical statistical
model is presented which hypothesises that blinkers and explosive events are
random and not connected in any way. The results given in this paper suggest
that this hypothesis can not be rejected and our probability interpretation of
the recent results of Brkovic & Peter (2004, A&A, 422, 709) are inconclusive.
Key words: Sun: transition region
There has been much discussion as to the relationship between blinkers and explosive events (Harrison et al. 2003; Brkovic & Peter 2004; Peter & Brkovic 2003).
Blinkers are small-scale intensity enhancements that were first observed by Harrison (1997) using the SOHO/CDS instrument (Harrison et al. 1995). More recently, a number of authors have used automated identification methods to observe blinkers in the quiet-Sun (QS) (Brkovic et al. 2001; Bewsher et al. 2002) and in active-regions (AR) (Parnell et al. 2002).
Both SOHO/CDS and SOHO/SUMER data have been used to determine the dynamics of blinkers.
Bewsher et al. (2003) used SOHO/CDS O V, formed at a temperature of
![]() K,
to show that blinkers are preferentially more red-shifted than the whole of the
transition region and have a maximum line shift of 30 km s-1 in the
QS and 40 km s-1 in ARs. They also found the line widths of blinkers
to be preferentially larger than the whole of the transition region
with a maximum line width of 45 km s-1 in both QS and ARs.
Madjarska & Doyle (2003) used SOHO/SUMER N V data,
formed at a temperature of
K,
to show that blinkers are preferentially more red-shifted than the whole of the
transition region and have a maximum line shift of 30 km s-1 in the
QS and 40 km s-1 in ARs. They also found the line widths of blinkers
to be preferentially larger than the whole of the transition region
with a maximum line width of 45 km s-1 in both QS and ARs.
Madjarska & Doyle (2003) used SOHO/SUMER N V data,
formed at a temperature of
![]() K, to calculate
the Doppler shift of three blinkers and found that they were
predominantly red-shifted, ranging from 5-25 km s-1, which
agrees with the results of Bewsher et al. (2003). Using SOHO/SUMER O VI data, Peter & Brkovic (2003) found that the line width of a single blinker decreased over the blinker's lifetime, reaching a minimum at the peak of the blinker's intensity, in contrast to the line shift which reaches its maximum at this time.
K, to calculate
the Doppler shift of three blinkers and found that they were
predominantly red-shifted, ranging from 5-25 km s-1, which
agrees with the results of Bewsher et al. (2003). Using SOHO/SUMER O VI data, Peter & Brkovic (2003) found that the line width of a single blinker decreased over the blinker's lifetime, reaching a minimum at the peak of the blinker's intensity, in contrast to the line shift which reaches its maximum at this time.
A number of mechanisms have been suggested to explain blinkers (Harrison et al. 1999; Peter & Brkovic 2003; Bewsher et al. 2002; Parnell et al. 2002; Priest et al. 2002; Bewsher et al. 2003; Madjarska & Doyle 2003), but as yet, none of the suggested mechanisms have been verified.
Explosive events have been characterised by strong non-Gaussian enhancements in the wings of their line profiles resulting from a high velocity component ranging from ![]() to
to ![]() km s-1. Detection of satellite components shifted to the red or blue from the centre of a line profile have also been used to identify explosive events. Dere (1994) found that brightenings were not associated with explosive events in all cases. Like blinkers, explosive events have been identified in the quiet Sun and active regions. They have also been found in coronal holes (Dere et al. 1991,1989). They were first observed using HRTS, but are commonly identified now with SOHO/SUMER (Wilhelm et al. 1995).
km s-1. Detection of satellite components shifted to the red or blue from the centre of a line profile have also been used to identify explosive events. Dere (1994) found that brightenings were not associated with explosive events in all cases. Like blinkers, explosive events have been identified in the quiet Sun and active regions. They have also been found in coronal holes (Dere et al. 1991,1989). They were first observed using HRTS, but are commonly identified now with SOHO/SUMER (Wilhelm et al. 1995).
Explosive events have been found to be associated with regions of complex weak field or on the edges of unipolar field (Porter & Dere 1991). Dere et al. (1991) and Dere (1994) associated explosive events with magnetic reconnection that occurred during the cancellation of magnetic flux and Innes et al. (1997) presented a model of the magnetic reconnection configuration required for an explosive event to occur. Innes & Tóth (1999) used a compressible MHD simulation to reproduce many explosive event features seen in observational data, including the high Doppler shifted line profiles. A suite of 6 papers (Roussev et al. 2001b; Roussev & Galsgaard 2002; Roussev et al. 2002; Galsgaard & Roussev 2002; Roussev et al. 2001a,c) have presented the results of various configurations of 2D dissipative numerical magnetohydrodynamics models of explosive events. The model shows the bi-directional jet associated with the explosive event to have a velocity which is of the order of the Alfvén speed, as would be expected from the reconnection that is thought to cause these events. The models also included non-equilibrium ionisation calculations of the spectra resulting from the numerical simulations. They found that the transition region response to the reconnection events was dependent on the initial conditions, but the dynamics of the events did not vary that much.
Table 1 shows the general properties of blinkers (Bewsher et al. 2002,2003) and explosive events (Brkovic & Peter 2004; Dere et al. 1989; Cook et al. 1987). Comparing the results from this table, we see that blinkers are 60 times less frequent than explosive events, 20 times larger in area, and 20 times longer in lifetime. The intensity enhancement factors of both phenomena, however, are approximately the same. One should be careful when making such comparisons, however, as the resolution of the instruments and the observational method used to identify the events are vastly different.
Table 1: Properties of blinkers and explosive events.
The properties and dynamics of blinkers and explosive events appear to be very different, which leads us to suggest that either (i) the two phenomena really are different or (ii) the differences in instrument resolution and sensitivity cause them to appear different.
Speculation whether blinkers and explosive events are the same phenomena or not continues even though much research has been carried out on each individual phenomenon. When investigating explosive events and two "blinker-like regions'', Chae et al. (2000) suggested that blinkers were made up of many SUMER unit brightenings, and were "closely related'' to explosive events. Madjarska & Doyle (2003), however, have suggested that blinkers are not related to explosive events, but are the "on-disk'' signature of spicules. The research of Peter & Brkovic (2003) lead them to claim that "explosive events are most probably not related to... transition region blinkers''. Analysis of five quiet Sun SUMER data sets, where events in SUMER called blinkers were identified automatically and explosive events were identified by eye, led Brkovic & Peter (2004) to conclude that "blinkers and explosive events are two independent phenomena''. It is unclear, however, whether blinkers observed in CDS can also be identified in SUMER (Madjarska & Doyle 2003). Brkovic et al. (2002), however, have shown that the variability in intensity in SUMER and CDS is similar if the resolution of the SUMER data is reduced to that of CDS.
In all of the studies above, none of the authors have compared blinkers automatically identified in SOHO/CDS data with explosive events automatically identified in a co-aligned SOHO/SUMER data set. In this paper, we do just that. In Sect. 2, we describe the data used and the automatic identification techniques. In Sect. 3, the blinker/explosive event examples are shown. Section 4 discusses whether wing enhancements are actually observable in CDS data and Sect. 5 provides a simple theoretical statistical model to determine whether our results and those of Brkovic & Peter (2004) are as one would expect if the phenomena are random and unconnected. Finally we make our concluding remarks in Sect. 6.
The data used in this paper are taken from two Solar and Heliospheric Observatory (SOHO) instruments; the Coronal Diagnostic Spectrometer (CDS; Harrison et al. 1995) and the Solar Ultraviolet Measurements of Emitted Radiation (SUMER; Wilhelm et al. 1995) and from the Transition Region and Coronal Explorer (TRACE; Handy et al. 1999).
The CDS data used are a series of O V feature-tracking rastered images formed at a temperature of
![]() K. The run started at 12:30 UT on 19th June 1998 and lasted for eight hours. The data covers an area of
K. The run started at 12:30 UT on 19th June 1998 and lasted for eight hours. The data covers an area of
![]() ,
has pixels of size
,
has pixels of size
![]() ,
a 10 s exposure time and a cadence of 151 s. The coordinates of the centre of the first raster are 220'' E and 250'' N. A full description of the preparation of the data can be found in Bewsher et al. (2002).
,
a 10 s exposure time and a cadence of 151 s. The coordinates of the centre of the first raster are 220'' E and 250'' N. A full description of the preparation of the data can be found in Bewsher et al. (2002).
The SUMER data are a series of Si IV single-slit line profiles formed at a temperature of
![]() K. The observation run started at 12.32 UT and lasted for 4 h until 16:32 UT. The
K. The observation run started at 12.32 UT and lasted for 4 h until 16:32 UT. The
![]() slit was used, but the only the central 240'' was telemetered, after binning over two spatial pixels. The data has a 15 s cadence and a pixel size of
slit was used, but the only the central 240'' was telemetered, after binning over two spatial pixels. The data has a 15 s cadence and a pixel size of
![]() .
The coordinates of the centre of the first single slit are 220'' E and 260'' N. The SUMER data tracks the same part of the Sun within 1'' throughout the time sequence. A full description of the data and the preparation used can be found in Innes (2001).
.
The coordinates of the centre of the first single slit are 220'' E and 260'' N. The SUMER data tracks the same part of the Sun within 1'' throughout the time sequence. A full description of the data and the preparation used can be found in Innes (2001).
A series of TRACE 1550, 1600 and 1700 Å images were also taken simultaneously with the SUMER and CDS data, which enabled a series of C IV images to be simulated. This data is the same as that analysed by Innes (2001).
The alignment of the CDS and SUMER data is not made solely by using the headers of both data sets, since this alignment is known to have an error of approximately 5''. A better alignment was achieved by first aligning the SUMER data to the TRACE C IV data and then aligning the TRACE data to the CDS data. The estimated final alignment error is approximately 2''-3''. We analyse 3.5 h of coincident SUMER and CDS S11484 data from 12:30 UT until 15.49 UT.
In the subsequent subsections, we explain the criteria that we set to automatically and identify blinkers and explosive events in both CDS and SUMER. Our criteria enable comparisons to be made between both phenomena as seen in both data sets.
Even though, we have been careful to align the CDS and SUMER data very closely, it is possible that the different spatial resolutions of the instruments led them to see different things. Since CDS has a broad point spread function (6'' in Solar-X and 8'' in Solar-Y) (Pauluhn et al. 1999), it is possible for the SUMER slit to be sitting in a position where CDS sees a feature, but SUMER does not. For this reason, we do not assume anything about the features that we see until we have tested them with our criteria. We use CDS data so that we identify whole blinkers and not just a small slice of them.
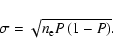
For the CDS and SUMER data sets, the error thresholds (
![]() and
and
![]() )
are calculated to equal 3.5 photons/pixel/s (p/p/s) and 4.9 counts/pixel/s (c/p/s), respectively.
)
are calculated to equal 3.5 photons/pixel/s (p/p/s) and 4.9 counts/pixel/s (c/p/s), respectively.
We follow the example of Winebarger et al. (1999) and set two criteria for the identification of explosive events. A positive test from either criteria implies the existence of an explosive event.
First, we look for a significant line width; defined as the value, v, below which 95% of the line widths occur. If the line width is greater than this value, then an explosive event is said to have occurred. For the CDS data, the significant line width, ![]() is found to be 34.4 km s-1 and for the SUMER data set, the significant line width,
is found to be 34.4 km s-1 and for the SUMER data set, the significant line width, ![]() ,
is equal to 25.0 km s-1. Since we determine the line width criteria from all of the individual pixels in the data set, and then compare with a summed group of pixels (the blinker or the explosive event) our criteria is an upper limit. Since summing over a number of pixels reduces the noise and the spread of the data.
,
is equal to 25.0 km s-1. Since we determine the line width criteria from all of the individual pixels in the data set, and then compare with a summed group of pixels (the blinker or the explosive event) our criteria is an upper limit. Since summing over a number of pixels reduces the noise and the spread of the data.
The relative line shifts and widths of the CDS data and blinkers are calculated
using the method of Bewsher et al. (2003). The actual velocities given are determined
using the typical transition region background Doppler shift and width
as determined in Bewsher et al. (2003) which uses standard
results from a number of authors (Hansteen et al. 2000; Chae et al. 1998; Achour et al. 1995; Chae et al. 1998; Mariska et al. 1978; Peter & Judge 1999; Dere & Mason 1993; Teriaca et al. 1999), i.e., the background O V Doppler shift is 7 km s-1, and the background O V line width is 28 km s-1. The ![]() noise associated with the CDS Doppler shifts and line widths are 9.0 and 3.6 km s-1, respectively.
noise associated with the CDS Doppler shifts and line widths are 9.0 and 3.6 km s-1, respectively.
Since, there is also no calibration line in the SUMER data set, we calculate relative Doppler shifts in the same way as we do the CDS data, i.e., with respect to a reference line centre position calculated from the whole data set. We determine the actual velocities by using a typical transition region Si IV Doppler shift of 7 km s-1 (see Bewsher et al. 2003, for details of how the typical velocity was calculated). We calculate relative line widths with respect to a reference width of 21 km s-1 for the SUMER data and a time varying reference width which is the modal value from each raster for the CDS data. The reference line centre position is also used when calculating the line width velocity. The ![]() (or full width of the fit) error associated with the SUMER Doppler shifts and line widths were calculated using a Monte Carlo simulation and found to be of the order of 1-2 km s-1. This is consistent with Peter & Judge (1999) who found the error on Si IV Doppler shift measurements to be 1.7 km s-1.
(or full width of the fit) error associated with the SUMER Doppler shifts and line widths were calculated using a Monte Carlo simulation and found to be of the order of 1-2 km s-1. This is consistent with Peter & Judge (1999) who found the error on Si IV Doppler shift measurements to be 1.7 km s-1.
Second, we consider the skewness of the line which is used to determine whether an enhancement in the wing of the line profile is present. Skewness is a dimensionless quantity which is mathematically defined as a measure of asymmetry of a distribution. In this case, the line profile. How to calculate the skewness and examples of skewed Gaussians and skewness values are given in Appendix A. Here the significant skewness limit is calculated by considering the skewnesses of the line profiles of all the pixels in the data set and determining a non-significant range that excludes the top and bottom 2% of values. For the CDS data, the non-significant skewness range is [-0.58,0.40]. The non-significant skewness range for the SUMER data is [-0.92,0.27]. As with the criteria for the line width, these non-significant bounds are maximum limits, since summing a number of pixels reduces the noise and the spread of the data, i.e., if anything is found in the blinker (or explosive event), then it is very likely to be real and present in all the pixels that make up the blinker (or explosive event). Unlike Winebarger et al. (1999) and Innes (2001), we do not set a limit on the flux that must be present in the wing for a positive explosive event test. The criteria were chosen so that a minimum of the 8 events identified by Innes (2001) were detected. In fact, a total of 12 events were identified (see Sect. 3.5). More importantly, however, by setting specific criteria, the automated method can be used on both SUMER and CDS data sets, and enables a true comparison of the results from both data sets.
![\begin{figure}
\par\mbox{\includegraphics[width=3.4cm,clip]{1171fig1a.eps} \incl...
...171fig1b.eps} }\\
\mbox{\hspace*{2.5cm} (a) \hspace*{2.4cm} (b)}
\end{figure}](/articles/aa/full/2005/10/aa1171/img23.gif) |
Figure 1:
a) SUMER Si IV single slit image and b) CDS O V raster. The |
| Open with DEXTER | |
Figure 1 shows a) a SUMER Si IV single slit image and b) the corresponding CDS O V raster taken at 12:46 UT. The dashed line on the CDS data marks the position of the SUMER slit and the ![]() s mark the mid-points of the
s mark the mid-points of the
![]() and
and
![]() blinkers. Both SUMER and CDS images are shown in false colour where a dark region corresponds to a brightening. The SUMER image is an intensity plot of wavelength (x-axis) versus position along the slit (y-axis). At the top of the SUMER Si IV frame, an explosive event (S1) can be seen, but its full spatial extent can not be gauged due to the observational data available; this fact should be kept in mind throughout this paper. In this locality in the CDS O V raster, three blinkers, C1, C2 and C3 are also observed. The middle blinker (C2) is the nearest spatially to the explosive event. This is the only example, within our 3.5 h sequence of co-aligned CDS and SUMER data, of a blinker and an explosive event together.
blinkers. Both SUMER and CDS images are shown in false colour where a dark region corresponds to a brightening. The SUMER image is an intensity plot of wavelength (x-axis) versus position along the slit (y-axis). At the top of the SUMER Si IV frame, an explosive event (S1) can be seen, but its full spatial extent can not be gauged due to the observational data available; this fact should be kept in mind throughout this paper. In this locality in the CDS O V raster, three blinkers, C1, C2 and C3 are also observed. The middle blinker (C2) is the nearest spatially to the explosive event. This is the only example, within our 3.5 h sequence of co-aligned CDS and SUMER data, of a blinker and an explosive event together.
![\begin{figure}
\par\includegraphics[width=8.8cm,clip]{1171fig2a.eps}\\
\hspace...
...]{1171fig2d.eps} }\\
\mbox{ \hspace*{2cm}(c) \hspace*{4.5cm}(d)}
\end{figure}](/articles/aa/full/2005/10/aa1171/img24.gif) |
Figure 2:
a) SUMER Si IV lightcurve for the
explosive event, S1. b) CDS O V lightcurve
for blinker, C2 (solid) and the lightcurve of
the CDS pixels that refer directly to SUMER region
S1 (dashed). The |
| Open with DEXTER | |
Figure 2a shows the lightcurve of the explosive event, S1, whilst Fig. 2b shows the lightcurve of the whole blinker, C2 (solid) and the lightcurve of the CDS pixels that correspond directly to the SUMER region S1 (dashed). The start and end of the blinker are marked with ![]() s. The dotted, dashed and dot-dashed vertical lines refer to the times of the frame shown in Fig. 1 (t2, the time nearest the maximum velocity of the explosive event), the CDS frame before (t1) and the CDS frame after (t3), respectively. Line profiles are shown in
Figs. 2c and 2d from SUMER Si IV for the explosive event, S1, and for the CDS blinker C2, respectively, at times t1 (dashed), t2 (dotted) and t3 (dot-dash). The SUMER and CDS reference Gaussians for time t2 are plotted for comparison (solid).
s. The dotted, dashed and dot-dashed vertical lines refer to the times of the frame shown in Fig. 1 (t2, the time nearest the maximum velocity of the explosive event), the CDS frame before (t1) and the CDS frame after (t3), respectively. Line profiles are shown in
Figs. 2c and 2d from SUMER Si IV for the explosive event, S1, and for the CDS blinker C2, respectively, at times t1 (dashed), t2 (dotted) and t3 (dot-dash). The SUMER and CDS reference Gaussians for time t2 are plotted for comparison (solid).
In this case, it appears that we are seeing the same brightening event with both CDS and SUMER, as the lightcurves follow the same general pattern. As expected, however, the better spatial resolution of the SUMER instrument provides more variation in the intensity (Brkovic et al. 2002).
The SUMER lightcurve is analysed using BLIP to determine whether it meets the
![]() criteria for being a blinker. The peak (shown with a
criteria for being a blinker. The peak (shown with a ![]() )
nearest to time t3, is identified as a blinker. The start and end of this event are marked with a
)
nearest to time t3, is identified as a blinker. The start and end of this event are marked with a ![]() and a +, respectively. The SUMER event that BLIP actually identifies as a blinker is just a small localised intensity change, and is only a small part of the larger, longer-lived CDS blinker that is seen. The reason for this is the higher temporal resolution of the SUMER. Indeed, if the SUMER data is reduced to the temporal resolution of the CDS data then an event with a similar lifetime to the CDS blinker is found in SUMER.
and a +, respectively. The SUMER event that BLIP actually identifies as a blinker is just a small localised intensity change, and is only a small part of the larger, longer-lived CDS blinker that is seen. The reason for this is the higher temporal resolution of the SUMER. Indeed, if the SUMER data is reduced to the temporal resolution of the CDS data then an event with a similar lifetime to the CDS blinker is found in SUMER.
All the properties of blinker C2 are comparable with the average characteristics for blinkers, except for its peak factor. C2 has the highest peak factor of all the 131 blinker identified in this CDS data set. The example shown here is different from the blinker analysed in Peter & Brkovic (2003) which led them to suggest that the smaller, shorter-lived blinkers are actually explosive events.
Table 2: Doppler shifts and line widths (km s-1) of explosive event S1 and blinker C2.
Table 2 shows the Doppler shifts and the line widths of the whole lines and where appropriate, any significant wings.
We test the blinker C2 line profiles for the presence of an explosive event using the criteria stated in Sect. 2.2. The CDS line widths of C2 at times t1, t2 and t3 are greater than ![]() ,
and therefore, meet the explosive event criteria. The skewnesses of the C2 line profiles, however, fall in the non-significant range (-0.049, -0.076 and 0.027 at times t1, t2 and t3, respectively) and therefore fail the skewness test at all times. Since the blinker line profiles met one of the criteria, we say that CDS has possibly found an explosive event.
,
and therefore, meet the explosive event criteria. The skewnesses of the C2 line profiles, however, fall in the non-significant range (-0.049, -0.076 and 0.027 at times t1, t2 and t3, respectively) and therefore fail the skewness test at all times. Since the blinker line profiles met one of the criteria, we say that CDS has possibly found an explosive event.
In comparison, wing enhancements can clearly be seen on both sides of the explosive event, S1 line profile. The explosive event was identified because at times t2 and t3 it has significant broadenings. S1 also has a significant skewness (0.28) at time t3, but the skewnesses at times t1 and t2 (-0.10 and 0.05, respectively) fail our criteria.
Thus, in this case, our analysis indicates that a possible explosive event is visible in the CDS line profiles at times t1, t2 and t3, but in the SUMER line profiles at times t2 and t3 only! The identification of explosive events with CDS must be approached with care, and the criteria may need to be adapted. In this case, the CDS explosive event criteria appear to be too lenient. The sensitivity and resolution of CDS and SUMER are leading us to identify an explosive event in CDS when it is not present in the better resolution SUMER data. Sufficient spectral resolution is also necessary to distinguish between a lone blinker, or in this case, an explosive event brightening and a blinker.
![\begin{figure}
\par\mbox{\includegraphics[width=3.4cm,clip]{1171fig3a.eps}\hspac...
...171fig3b.eps} }\\
\mbox{\hspace*{2.5cm} (a) \hspace*{2.3cm} (b)}
\end{figure}](/articles/aa/full/2005/10/aa1171/img27.gif) |
Figure 3: As Fig. 1, but with a) SUMER Si IV and b) CDS O V frames taken at time 13:33 UT. |
| Open with DEXTER | |
The second scenario is a situation involving a blinker, but no explosive event. Figure 3 shows the same two types of frames as those shown in Fig. 1, but these frames are taken at time 13:33 UT. Two blinkers, C4 and C5, observed in the CDS O V data, lie along the SUMER slit. In the SUMER Si IV data, the two regions that correspond to C4 and C5 are labelled S2 and S3, but neither region appears to contain an explosive event that can be detected by eye. These examples are two out of ten observed in this dataset, where there are blinkers present in the CDS data along the SUMER slit, but no explosive events seen in the SUMER data. We investigate blinker C4 and the corresponding SUMER region, S2 in more detail.
![\begin{figure}
\par\includegraphics[width=8.8cm,clip]{1171fig4a.eps}\\
\hspace...
...]{1171fig4d.eps} }\\
\mbox{\hspace*{2cm}(c) \hspace*{4.5cm} (d)}
\end{figure}](/articles/aa/full/2005/10/aa1171/img28.gif) |
Figure 4: As for Fig. 2, but for SUMER region S2, and blinker C4. |
| Open with DEXTER | |
Figure 4 is similar to Fig. 2 and shows the lightcurves and line profiles of SUMER region S2 and blinker C4.
As in the previous section, the CDS and SUMER lightcurves show the same general pattern, but there is more variation in the SUMER intensities. We analyse the full temporal resolution SUMER lightcurve with BLIP, and find that no blinker with
![]() is identified. If we analyse a reduced temporal resolution SUMER lightcurve (with intensities only taken at the times nearest to the CDS times), then again, BLIP does not find a blinker which meets the
is identified. If we analyse a reduced temporal resolution SUMER lightcurve (with intensities only taken at the times nearest to the CDS times), then again, BLIP does not find a blinker which meets the ![]() criteria. So, even though the lightcurves show the same pattern of variations, the magnitude of those fluctuations is not sufficient for a blinker to be identified in SUMER. All properties of blinker C4, are comparable with the mean properties shown in Table 1.
criteria. So, even though the lightcurves show the same pattern of variations, the magnitude of those fluctuations is not sufficient for a blinker to be identified in SUMER. All properties of blinker C4, are comparable with the mean properties shown in Table 1.
Table 3: Doppler shifts and line widths (km s-1) of SUMER region S2 and blinker C4.
Table 3 shows the Doppler shifts and line widths of blinker C4 and SUMER region S2. The line width and skewness of blinker C4 fail to meet our criteria for an explosive event. Similarly, SUMER region S2 fails the explosive event tests.
Similarly, if we investigate the SUMER S3 region and the CDS blinker, C5, we find the same story. Indeed, in total we found 10 such examples in our dataset. In all cases blinkers could be identified in CDS but not in SUMER and neither showed any evidence of an explosive event.
![\begin{figure}
\par\mbox{\includegraphics[width=3.4cm,clip]{1171fig5a.eps}\hspac...
...171fig5b.eps} }\\
\mbox{\hspace*{2.5cm} (a) \hspace*{2.3cm} (b)}
\end{figure}](/articles/aa/full/2005/10/aa1171/img31.gif) |
Figure 5: As Fig. 3, but SUMER Si IV and CDS O V frames taken at time 15:00 |
| Open with DEXTER | |
Figure 5 is similar to Figs. 1 and 3. At the top of the SUMER Si IV frame (Fig. 5a), a bi-directional explosive event can be seen; it is labelled S4. In Fig. 5b, the corresponding CDS O V region, C6, shows no blinker. This is one of seven cases found where an explosive event is observed in the SUMER data, but no associated blinker is seen in the CDS data.
![\begin{figure}
\par\includegraphics[width=8.8cm,clip]{1171fig6a.eps}\\
\hspace...
...]{1171fig6d.eps} }\\
\mbox{\hspace*{2cm} (c) \hspace{4.5cm} (d)}
\end{figure}](/articles/aa/full/2005/10/aa1171/img32.gif) |
Figure 6: As in Fig. 2, but for explosive event S4, and for CDS region C6. |
| Open with DEXTER | |
Figure 6 shows the lightcurves and line profiles of SUMER region S4 and CDS region C6. In this case, the lightcurves of SUMER region S4 and CDS region C6 do not correlate particularly well. There is clear evidence of an explosive event in the SUMER spectra, however, with enhancements seen on both sides of the line profile. As before, we analyse the SUMER lightcurve with BLIP to determine whether any blinkers are present. The SUMER peak intensity nearest to time t2, meets the
![]() criteria for a blinker, and the start, peak and end of the "blinker'' are marked with a
criteria for a blinker, and the start, peak and end of the "blinker'' are marked with a ![]() ,
,
![]() and a +, respectively. As in the case of the SUMER lightcurve S1, BLIP identifies a localised intensity enhancement which is much shorter than the larger, longer-lived brightening that is clearly present.
and a +, respectively. As in the case of the SUMER lightcurve S1, BLIP identifies a localised intensity enhancement which is much shorter than the larger, longer-lived brightening that is clearly present.
A blinker is not identified in the CDS data, because not all of the pixels that make up the region have significant peaks at the same time. The blinker seen in Fig. 5b to the right of region C6, is not associated with the explosive event since it does not lie beneath the SUMER slit during its lifetime.
Table 4: Doppler shifts and line widths (km s-1) of SUMER region S4 and CDS region C6.
As in previous sections, we analyse both the SUMER and CDS line profiles with the explosive event tests. Table 4 shows the Doppler shifts and line widths of the SUMER region S4, and the CDS region, C6. The CDS line profiles fail the line width and skewness criteria at all times. There is, therefore, no evidence of an explosive event in the CDS line profiles.
The SUMER line profiles, however, meet the line width test at time t2, but like the CDS line profiles, fail the skewness test at all times. Even though the profiles look skewed, the presence of wings on both sides of the profile reduces the overall skewness in the line, hence it does not meet the skewness criteria.
In this case, therefore, there is evidence of both a blinker and an explosive event in the SUMER data, but no evidence of either event in the CDS data.
We have found another 6 cases where a SUMER explosive event occurs without a CDS blinker, of which we could identify 2 as blinkers in SUMER and 3 showed signs of an explosive event in CDS.
We use BLIP to identify blinkers in the SUMER data. Firstly, we use the full resolution SUMER data and then a reduced time resolution version of the SUMER data. To achieve the reduced SUMER time resolution, we just pick the data at the times that are closest in time to the CDS rasters. Since the SUMER data is only a single slit, for comparison, we also analyse a single slit of the CDS data for blinkers. The properties of the blinkers identified with
![]() and
and
![]() from all 3 of these data sets are shown in Table 5.
from all 3 of these data sets are shown in Table 5.
Table 5: Properties of blinkers identified in full and reduced time resolution SUMER data and in a single slit of the CDS data.
The mean intensity enhancement factors of the blinkers found in all three runs are comparable. As expected, the area of the blinkers found with the SUMER data are smaller than those blinkers identified in CDS. This is due to the smaller size of the SUMER pixels with respect to the CDS pixel size and the limited spatial extent of the SUMER data. The lifetimes of the blinkers found in CDS and in the reduced time resolution SUMER data are comparable, but again the full temporal resolution of the SUMER data leads to the identification of shorter lived events. The frequency of events identified in SUMER is also higher than that found with the CDS, as many smaller shorter lived events are identified. Also, as the SUMER data has a greater number of pixels, and events identified are smaller, a greater number of events can be identified.
All of the 11 blinkers found in the CDS data had some counterpart in the reduced SUMER data, i.e. there was some intensity enhancement that spatially overlapped with the CDS blinker that met the criteria for a blinker at some point during the lifetime of the CDS blinker. Of the 35 blinkers identified in the SUMER reduced resolution data, 18 were small localised brightenings that made up the 11 blinkers identified in CDS. The remaining 17 blinkers did not have a counterpart in CDS. All of the SUMER full resolution blinkers have counterparts in the SUMER reduced blinkers. Of the 16 full resolution SUMER blinkers, 11 are part of 5 larger CDS blinkers, the other 5 are small localised brightenings that did not have a counterpart in CDS.
Here, we ask the analogous question of whether explosive events can be identified in CDS without using the SUMER data for comparison. Using the criteria stated in Sect. 2.2, we identify explosive events in a single column of the CDS data that aligns with the SUMER slit and in the full resolution SUMER data for comparison. We find that 80% of SUMER and CDS pixels record the same result, i.e. that there is a significant line width, a significant skewness or both. This clearly shows that our explosive event criteria is fairly good at producing the same result with both CDS and SUMER data
We also add 2 further criteria for explosive events, namely that (i) the explosive event must occur in 3 or more pixels, and that (ii) it must be visible for 3 or more time steps.We do this so that we can be more confident in our identification of real events rather than anomalies in the data. It should be noted that these further criteria were not used by Innes (2001).
Using these extra criteria, we find 3 explosive events in the CDS data which considering the larger size of the CDS pixels and the lower spectral and temporal resolution of CDS, is comparable with the 8 explosive events identified by Innes (2001). These 3 explosive events have a mean lifetime of 10.7 min and a mean area of 20 Mm2. Both of these properties are higher than typical for explosive events. Both of these characteristics, however, are smaller than those for blinkers, suggesting that blinkers and explosive events are different classes of events. Of the 3 explosive events found in the single slit of CDS data, 1 of the explosive events was identified purely using the skewness criteria, the other 2 were identified by their increased line width. Only one of the explosive events identified in CDS with the extra criteria coincides with those found by Innes (2001). Obviously our event size and lifetime criteria stop us from identifying the events that Innes (2001) did.
As a further test, we also identify explosive events in the full resolution SUMER data. 12 explosive events are found with a mean area and lifetime of 2.1 Mm2 and 2.3 min, respectively, which is comparable to the typical explosive event characteristics shown in Table 1. Of the 12 explosive events found in the SUMER data, 3 were identified using the skewness criteria and the other 9 were identified using the line width criteria. Of the 12 explosive events identified, 4 are the same as those identified by Innes (2001). Again it appears that the grouping of pixels to meet the extra explosive event criteria can rule out some short lived or small events found by Innes (2001). It may be necessary to include alternative explosive event criteria that set limits on the amount of flux in the wings as Winebarger et al. (1999) and Innes (2001) did.
Only one of the explosive events identified in CDS was identified with the skewness criteria. But would we expect to identify explosive events in CDS with this criteria, given the resolution of CDS? If so, what size of wing could we detect?
To determine this, we assume that a theoretical line profile is comprised of two Gaussian profiles: one core Gaussian with amplitude A1, line centre ![]() and width
and width ![]() ;
and one wing Gaussian with amplitude A2, line centre
;
and one wing Gaussian with amplitude A2, line centre ![]() and the same width
and the same width ![]() .
For a given line shift (velocity) and amplitude of the wing Gaussian, we can calculate the fraction of the whole line profile that is made up of the wing component.
.
For a given line shift (velocity) and amplitude of the wing Gaussian, we can calculate the fraction of the whole line profile that is made up of the wing component.
![\begin{figure}
\par\includegraphics[width=7cm,clip]{1171fig7.ps} \end{figure}](/articles/aa/full/2005/10/aa1171/img36.gif) |
Figure 7: Contour plot of the fraction of the CDS profile made up of the wing Gaussian when the amplitude and the velocity of the wing Gaussian are varied. The solid line marks the 80 km s-1 velocity of the SUMER explosive event S1, and the dotted and dashed lines mark the amplitude expected from the whole and 2% of the SUMER explosive event producing the 80 km s-1 velocity observed, respectively. |
| Open with DEXTER | |
Figure 7 shows a contour plot of the fraction of the line profile that is made up of the wing component given the velocity and amplitude of the wing component. In the case of the explosive event, S1 and blinker, C2, the area of the SUMER explosive event is 0.12 times the area of the CDS blinker. If we assume that the whole of the plasma in the SUMER region is giving rise to the explosive event, then a velocity of 80 km s-1 (Fig. 7 solid line) would show up as a wing which has between one fifth and one tenth the flux of the whole CDS profile. The whole of the SUMER region, however, will not contribute to the explosive event, and if we assume that only 2% of the plasma (as our data suggests) in the SUMER region gives rise to the explosive event (i.e. 0.0024 of the CDS blinker), then the wing will contribute less than a fourtieth of the whole CDS profile. It is no surprise, therefore, that we have been unable to identify wing enhancements in the CDS line profiles, and furthermore it is unlikely that this method would be successful in identifying explosive events in CDS data.
Let us make the hypothesis that blinkers and explosive events are not physically related and the occurrence of a blinker has no bearing (either positive or negative) on whether an explosive event will occur there.
Then, if we have observations containing a known set of blinkers, the case that an explosive event will coincide with one of these blinkers can be represented as a Bernoulli trial with parameter
![]() .
Therefore, multiple explosive events will have a binomial distribution with parameters
.
Therefore, multiple explosive events will have a binomial distribution with parameters
![]() and P. The mean number of coincidences is
and P. The mean number of coincidences is
| (1) |
 |
(2) |
This probability experiment is similar to the following. Suppose we have a mat on which we have drawn several large circles (the blinkers), now suppose we toss a coin (explosive event) randomly onto the mat. What is the probability that the coin lands inside one of the circles?
The simplest probability to calculate is the probability that the centre of the coin (explosive event) occurs within the circle (blinker). This is equal to the area of the circles divided by the area of the mat. Note that if the radius of the coin is much smaller than the radii of the circles, then this is approximately the probability that ![]() of the coin overlaps the circle.
of the coin overlaps the circle.
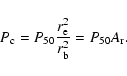
For our blinker observations, we can calculate the percentage volume (area![]() time) of blinkers in the CDS data analysed in Sect. 3 is 6.7%. We assume that this is also representative of the SUMER data, which is contained within the CDS field of view. We note that this percentage volume found is higher than the 4% and 5% given in Bewsher et al. (2002) and Brkovic et al. (2001), respectively.
time) of blinkers in the CDS data analysed in Sect. 3 is 6.7%. We assume that this is also representative of the SUMER data, which is contained within the CDS field of view. We note that this percentage volume found is higher than the 4% and 5% given in Bewsher et al. (2002) and Brkovic et al. (2001), respectively.
Brkovic & Peter (2004) provided us with a breakdown of their results (private communication) for each dataset analysed. In the following, datasets A-E refer to their data from 97-04-22, 97-04-25, 98-05-12, 98-05-16 and 97-04-23, respectively. The percentage coverage of blinkers in SUMER datasets A-E were 23.1%, 18.7%, 19.6%, 11.5% and 35.5%, respectively.
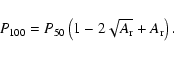
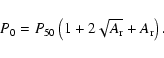
Assuming that the explosive events are smaller than the blinkers, we define three probabilities; P100 is the probability that an explosive event is completely enclosed by a blinker; P50 is the probability that the centre of an explosive event coincides with a blinker (i.e. approximately ![]() of an explosive event overlaps a blinker); and P0 is the probability that (0,100]% of an explosive event overlaps a blinker or at least the edges of the explosive event and blinker touch.
of an explosive event overlaps a blinker); and P0 is the probability that (0,100]% of an explosive event overlaps a blinker or at least the edges of the explosive event and blinker touch.
If the area of an explosive event is greater than the area of a blinker then; P100 is the probability that the explosive event completely covers a blinker; P50 is the probability that the centre of the explosive event coincides with the the blinker; and P0 remains the same. It may also be useful to define a fourth probability; ![]() ,
which is the probability that the explosive event coincides with the centre of the blinker. The derivations and equation for these probabilities are given in Appendix B.
,
which is the probability that the explosive event coincides with the centre of the blinker. The derivations and equation for these probabilities are given in Appendix B.
The values of P100 and P0 gives us a range of probabilities which may be valid depending on the definition of coincidence. For example, does a ![]() overlap count as a coincidence?
overlap count as a coincidence?
All of the defined probabilities are dependent on the ratio of the explosive event and the blinker areas. The area ratio for the different datasets is given in Table 6. The area ratio of explosive events and blinkers identified in this paper suggests that blinkers are considerably larger than explosive events. Three out of the five datasets analysed by Brkovic & Peter (2004) have the mean explosive event area greater than the mean blinker area (i.e. area ratio is greater than 1) and the other two datasets have explosive events being smaller than blinkers (i.e. area ratio less than 1). But in many cases, the area ratios of Brkovic & Peter (2004) are very near to 1 (i.e. the area of explosive events and blinkers are similar).
Table 6: Mean number of explosive events expected to coincide with the blinkers and the standard deviation from the mean. R (N) indicates whether the hypothesis can be rejected (or not). In the cases marked *, the probability is either greater than 1.0 and hence has broken down, or the probability is less than 0.01.
Table 6 shows the percentage blinker coverage calculated from the number of blinkers identified in CDS data in this paper and in SUMER data by Brkovic & Peter (2004). It also shows the ratio of explosive event area to blinker area calculated from the mean properties of explosive events and blinkers identified in SUMER by Brkovic & Peter (2004) and from mean properties of explosive events identified in SUMER and blinkers in CDS given in Sects. 3.4 and 3.5. The expected number of explosive events coinciding with the blinkers calculated from the probability analysis for the observational results given in this paper (BIPB) and given in Brkovic & Peter (2004) (BP A-E) are also given in Table 6. The number of explosive events observed (![]() ), the number of explosive events coincident with blinkers, the mean number of explosive events expected and the standard deviation from the mean for the three different values of P are also all given. Given these values and a two standard deviation (approx
), the number of explosive events coincident with blinkers, the mean number of explosive events expected and the standard deviation from the mean for the three different values of P are also all given. Given these values and a two standard deviation (approx ![]() )
confidence interval, we also state whether we can reject our hypothesis (R) or accept it (A).
)
confidence interval, we also state whether we can reject our hypothesis (R) or accept it (A).
Brkovic & Peter (2004) gave the number of pixels that showed blinker or explosive event characteristics in their paper, but were able to provide us with the number of blinker and explosive events (i.e. groups of adjacent pixels that all show a blinker or explosive event characteristic) so that we could make a true comparison. These are the number of blinkers and explosive events in Table 6. Unfortunately, they were not able to provide us with how many of these explosive event "groups'' were coincident with blinker "groups'' and vice versa. Therefore, we have assumed that the percentage of explosive events that are coincident with blinkers is the same percentage of explosive event pixels that are coincident with blinker pixels. This gives us a lower bound to the number of explosive events that occur with blinkers, the true number may be higher.
In the P0 case for the Brkovic & Peter (2004) dataset E, we find that the calculation in Appendix A breaks down. This is because the extended annuli (where explosive events partially overlap a blinker) around blinkers may intersect giving an area greater than the total area. This may happen when there is a high percentage coverage of blinkers, and explosive events are large. Thus we take a maximum probability of P0=0.99 in Table 6 for comparison.
The data presented in this paper suggests that we can not reject our hypothesis for any of the probabilities. For most of the Brkovic & Peter (2004) cases, the hypothesis is rejected for the given probabilities because the number of explosive events coinciding with a blinker is greater than two standard deviations away from the mean given by the binomial distribution. The two cases when the results of Brkovic & Peter (2004) lead us to accept our hypothesis are in the P0 case, where the events can be anything from touching to completely overlapping.
Table 7: Comparison of the theoretical probabilities suggested by the model and an ideal probability calculated from the observations.
However, if we reverse this process and calculate what the ideal probability would be from the observed data (Table 7), we see that in all of the Brkovic & Peter (2004) cases, the ideal probability lies between P50 and P0. This may reflect the selection criteria used to decide whether an explosive event coincides with a blinker.
The calculation using the data presented in this paper suggests that we can not reject our hypothesis. The calculations using data from Brkovic & Peter (2004) are less conclusive. In order to come to a conclusion, two things are required; (i) specific values of how many explosive events were coincident with blinkers and (ii) a more rigorous definition of when explosive events coincide with blinkers - how much must they overlap in order to be classed as coinciding?
It is clear that using our criteria, blinkers are only identified in SUMER data when the temporal resolution of the data has been reduced to that of CDS. Else small localised brightenings that make up the blinker are identified or the blinker may even be missed (e.g. SUMER region S2). CDS data is needed for identifying blinkers, however, because of the spatial coverage of the instrument. Identifying blinkers with SUMER means that only a small area of these large events are sampled. SUMER is necessary, however, for completing detailed spectral studies of blinkers.
It is also clear that our 2 criteria method for automatically identifying explosive events successfully identifies explosive event in both SUMER and CDS. In fact, 80% of SUMER and CDS pixels register the same result to the 2 explosive event tests. It is more likely that CDS can successfully identify an explosive events when there is a significant increase in the line width, but can not be relied upon for successful identification if a wing enhancement is present. SUMER is essential, therefore, for successful identification of explosive events.
We hypothesised that blinkers and explosive events are random and not physically related in anyway. We then used a binomial probability model to determine whether the results from this paper and those of Brkovic & Peter (2004) supported our hypothesis or not.
Using the percentage coverage of blinkers and the mean properties of blinkers identified in CDS and explosive events in SUMER given in this paper, we support the hypothesis stated. However, the results of Brkovic & Peter (2004) are less conclusive. The higher blinker coverage and larger explosive event to blinker area ratio has given us some extreme probabilities and have broken some of the assumptions made. However, in each case, the ideal probability lies in the [P50, P0] range.
It is unclear whether the events that Brkovic & Peter (2004) have identified in SUMER are actually the counterparts of blinkers observed in CDS. Madjarska & Doyle (2003) raised some concerns about identifying blinkers in SUMER, suggesting that CDS was necessary for successful identification. It is also unclear whether the blinkers identified using the automated routines detailed in Brkovic et al. (2001) and Bewsher et al. (2002) actually identify the same events.
So are blinkers and explosive events the same phenomenon? Our results show that it is unlikely, which our probability analysis also supports. A recent paper by Harrison et al. (2003), also raises doubts as to a link between blinkers and explosive events. In fact, in most recent papers referring to links between blinkers and explosive events (e.g. Brkovic & Peter 2004; Peter & Brkovic 2003), the current feeling is that there is no link between the events.
The dynamics of the transition region are very complex, fast and on small scales and, unfortunately beyond the capabilities of SUMER and CDS. We require the next generation of solar spectrometers with fast high resolution spectral imaging before we can begin to understand the source of the variability and the true link between blinkers and explosive events.
Acknowledgements
SOHO is a mission of international cooperation between ESA and NASA. CDS was built and is operated by a consortium led by the Rutherford Appleton Laboratory and including the Mullard Space Science Laboratory, the NASA Goddard Space Flight Center, Oslo University and the Max-Planck-Institute for Extraterrestrial Physics, Garching. The SUMER project is financially supported by the DARA, CNES, NASA and the ESA PRODEX programme.
D.B. is supported by an European Space Agency (ESA) External Fellowship at NASA/GSFC. CEP and DSB would like to thank the UK's Particle Physics and Astronomy Research Council for financial support.
This work started at the "Small scale transient activity'' workshop at the Institut d'Astrophysique Spatiale, Orsay, France in December 2001. The discussions of working group 2: "Blinker and explosive event joint analysis'' provided valuable input to this paper.
For a random sample of values,
![]() ,
skewness (sk) is defined as
,
skewness (sk) is defined as
 |
(A.1) |
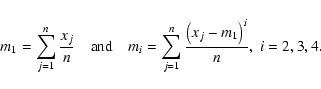 |
(A.2) |
As the wing moves further from the centre of the core of the line profile, the skewness increases. In the cases given in Fig. A.1a, all the skewness values are negative. If the wings were placed at the same position but on the right hand side of the core profile, the skewness would be the same magnitude, but the sign would be reversed, i.e. all the negative skewnesses would become positive.
Next, we consider profiles with 2 wings. If wing profiles of equal size are placed at equal distances on either side if the centre of the core, then the skewness will equal 0, since the symmetry of the line is not affected. If the size of the wings or the displacement of the centre of the wing from the core is not equal, the skewness will be non zero. Figure A.1b shows a symmetric line profile with no wings and 2 profiles with equally sized wings placed at 0.25 units to the left and 0.5 units to the right of the centre of the core (dotted). A further profile which has equally sized wings placed at 0.5 units to the left and 0.75 units to the right of the centre of the core is also plotted (dashed). Again the skewness values calculated for the profiles are given on the graphs.
In the cases where there are 2 wings, the skewness values are lower than when there was a single wing. This is because the wings partially balance the symmetry of the line profile and hence the lines are more symmetric than the cases shown where there is a single wing. Therefore, the skewness criteria will be more useful for identifying explosive events characterised with a single jet, rather than a bi-directional jet.
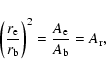
If the centre of the explosive event is on the edge of the blinker (a distance ![]() from the blinker centre), then approximately 50% of the explosive event coincides with the blinker. For the explosive event to be completely enclosed by the blinker, the centre of the explosive event must be at most
from the blinker centre), then approximately 50% of the explosive event coincides with the blinker. For the explosive event to be completely enclosed by the blinker, the centre of the explosive event must be at most
![]() from the centre of the blinker. Similarly, explosive events that have any kind of overlap with the blinker must have a centre that is at most
from the centre of the blinker. Similarly, explosive events that have any kind of overlap with the blinker must have a centre that is at most
![]() from the centre of the blinker. Where the centres of the blinker and explosive event are exactly
from the centre of the blinker. Where the centres of the blinker and explosive event are exactly
![]() apart their edges touch, but the two don't actually overlap.
apart their edges touch, but the two don't actually overlap.
The case where the centre of the explosive event coincides with the blinker (approximately 50% overlap), P50 is equal to
 |
(B.1) |
The case where the explosive event is enclosed within the blinker (100% overlap) P100 is equal to
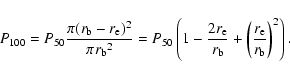 |
(B.2) |
 |
(B.3) |
 |
(B.4) |
 |
(B.5) |
 |
(B.6) |
![\begin{figure}\par\subfigure[]{\includegraphics[width=4.5cm,clip]{1171figa1a.eps...
... \subfigure[]{\includegraphics[width=4.5cm,clip]{1171figa1b.eps} }
\end{figure}](/articles/aa/full/2005/10/aa1171/img52.gif)