

Up: The co-orbital corotation torque
Subsections
![\begin{figure}
\par\includegraphics[width=8cm,clip]{surfdens.ps}
\end{figure}](/articles/aa/full/2002/20/aa1942/Timg118.gif) |
Figure 1:
This plot shows the disk surface density response to the planet
potential, at the end of run R1744. The rotation is anti-clockwise. The one-armed shock triggered by the planet in the disk is clearly visible, as well as the shallow dip surrounding the orbit, the relative depth of which amounts to  15% of the disk surface density. 15% of the disk surface density. |
The disk response to the perturbing potential of a planet on a uniform circular orbit is illustrated at Fig. 1. The planet excites waves in the disk at all wavenumbers
(Goldreich & Tremaine 1979), which corotate
with the planet, and the superposition
of which leads to a one-armed spiral shock (Goodman & Rafikov 2001). This latter is in advance w.r.t. the planet in the inner disk, which corresponds to the positive inner Lindblad torque, while it is delayed w.r.t. the
planet in the outer disk, which corresponds to the negative outer Lindblad torque. The balance between the one-sided Lindblad torque and the viscous torque, for a steady flow in the planet frame, enables one to evaluate the depth of the dip which surrounds the orbit (Masset 2001), which, as long as it is shallow, scales
proportionally to the planet mass square and inversely proportionally to the disk viscosity. The dynamics of the co-orbital region, i.e. the horseshoe region, is better seen in the
 plane, as shown in the
following sections.
plane, as shown in the
following sections.
4.2 An illustrative example
Let one consider the runs R1751 and R3351,
which correspond respectively
to:
 ,
h=0.05 and
,
h=0.05 and
 and to: q=10-4, h=0.05 and
.
The aspect of the streamlines at time
and to: q=10-4, h=0.05 and
.
The aspect of the streamlines at time
 in the frame corotating with the planet
in either case
is represented at Figs. 2 and 3.
in the frame corotating with the planet
in either case
is represented at Figs. 2 and 3.
![\begin{figure}
\par\includegraphics[width=8.3cm,clip]{sfig1bis.ps}
\end{figure}](/articles/aa/full/2002/20/aa1942/Timg122.gif) |
Figure 2:
Streamlines
aspect in the co-orbital region for run R1751.
The thick line represents the outer downstream separatrix. |
![\begin{figure}
\par\includegraphics[width=8.1cm,clip]{sfig1.ps}
\end{figure}](/articles/aa/full/2002/20/aa1942/Timg123.gif) |
Figure 3:
Same as Fig. 3
for run R3350. The separatrix lies further from the planet orbit than in run R1751. |
The streamlines are found integrating the velocity field, which is bilinearly
interpolated from the values at the interfaces between adjacent zones. As most
of the motion in the co-orbital region can be accounted for by a linear shear vy=2Axwhere A is the Oort's constant, this bilinear interpolation gives satisfactory results,
and in particular enables one to search for the precise position of the separatrix
between the librating and circulating streamlines. The separatrix position is defined
by its distance  to the orbit in opposition with the planet, i.e. at azimuth
 ,
as indicated in Figs. 2 and 3.
The value of
is determined with a dichotomic search. If a guess of
gives
a circulating (resp. librating) streamline, a smaller (resp. higher) value is tried.
The search is iterated until a sufficient precision is achieved. Because the bilinear
interpolation of the velocity field is well adapted to the kinematics of the co-orbital
region, the precision that can be achieved on the separatrix position is much smaller
than the radial zone size, and in that sense such a precision is illusory. However,
this allows to investigate the behavior of the librating zone width when varying any
parameter of the problem, the grid resolution being fixed.
An estimate of the error on the corotation torque and on the separatrix position due
to finite resolution effect can be found in Appendix A.
For the run R1751, the separatrix position is found to be:
,
as indicated in Figs. 2 and 3.
The value of
is determined with a dichotomic search. If a guess of
gives
a circulating (resp. librating) streamline, a smaller (resp. higher) value is tried.
The search is iterated until a sufficient precision is achieved. Because the bilinear
interpolation of the velocity field is well adapted to the kinematics of the co-orbital
region, the precision that can be achieved on the separatrix position is much smaller
than the radial zone size, and in that sense such a precision is illusory. However,
this allows to investigate the behavior of the librating zone width when varying any
parameter of the problem, the grid resolution being fixed.
An estimate of the error on the corotation torque and on the separatrix position due
to finite resolution effect can be found in Appendix A.
For the run R1751, the separatrix position is found to be:
 ,
while
for the run R3351, the separatrix position is found to be:
,
while
for the run R3351, the separatrix position is found to be:
 ,
as can be estimated from Figs. 2 and 3.
Therefore the viscous time-scale across the horseshoe zone half-width is:
,
as can be estimated from Figs. 2 and 3.
Therefore the viscous time-scale across the horseshoe zone half-width is:
while the outermost horseshoe turnover time is:
As the viscous time-scale across the horseshoe region is much higher than the horseshoe
turnover time in either case, one expects the corotation torque to saturate.
The total torque exerted by the disk on the planet as a function of time is represented
at Fig. 4.
![\begin{figure}
\par\includegraphics[width=8.6cm,clip]{sfig2.ps}
\end{figure}](/articles/aa/full/2002/20/aa1942/Timg134.gif) |
Figure 4:
Torque on the planet of run R1751 (solid line)
and run R3050 (dashed line)
as a function of time. The outermost horseshoe turnover time is indicated in either case.
The torque is normalized by
 .
The glitch around
t=10 orbits corresponds to an edge effect of the smoothing window (these results are
smoothed over a temporal window of about 10 orbits). .
The glitch around
t=10 orbits corresponds to an edge effect of the smoothing window (these results are
smoothed over a temporal window of about 10 orbits). |
The total torque tends towards a constant value in time on a time-scale of
the order of the outermost horseshoe turnover time.
The initial torque value corresponds to the sum of the
differential Lindblad and corotation torque, this later being positive,
since the surface density is uniform on the co-orbital region. Incidently one can notice that
in both cases
the initial corotation torque value almost cancels out exactly the limit value at large
time,
and that this limit value at large
time is not the same for both planets.
![\begin{figure}
\par\includegraphics[width=8.3cm,clip]{sfig3.ps}
\end{figure}](/articles/aa/full/2002/20/aa1942/Timg135.gif) |
Figure 5:
Torque on the planet of runs R175i
as a function of time, for
 .
The steady state regime is reached faster as the viscosity increases, and tends
towards a partially saturated state function of the viscosity. The glitch at t=4 orbits is an edge effect of the smoothing
window. For this series of runs only the integration time was 150 orbits in order to check that the total torque value
does not vary significantly after 120 orbits. .
The steady state regime is reached faster as the viscosity increases, and tends
towards a partially saturated state function of the viscosity. The glitch at t=4 orbits is an edge effect of the smoothing
window. For this series of runs only the integration time was 150 orbits in order to check that the total torque value
does not vary significantly after 120 orbits. |
Figure 5 shows the behavior of the total normalized torques as a function of time for the case
,
h=0.05, for different viscosities. The bottom curves correspond to low viscosity, and the limit value at large time increases with
viscosity. This limit value reaches a maximum which corresponds roughly to the value at t=0, which corresponds to a totally
unsaturated torque, and then decreases beyond the cut-off viscosity, as the topology of the co-orbital region undergoes a change that
will be discussed further (see Masset 2001).
Figure 6 shows the value of the normalized total torque acting
on the protoplanet as a function of the reduced viscosity, evaluated from runs
R175i. In each case the value of the torque is averaged on the time interval
[90,120] orbits, in order to get rid of the transitory regime of the beginning,
which corresponds, as we mentioned in Sect. 4.2, to the time needed for
the corotation torque to (possibly partially) saturate.
This figure also shows the best fits by the functional dependences given by Masset
(2001), which are respectively:
![\begin{displaymath}
\Gamma_{\rm C}=\Gamma_{\rm C}^{{\rm max}}\cdot \frac 14\left...
...\rm s}^3}-\frac{g(z_{\rm s})}{z_{\rm s}^4g'(z_{\rm s})}\right]
\end{displaymath}](/articles/aa/full/2002/20/aa1942/img136.gif) |
(20) |
for the solid line,
 |
(21) |
for the dashed line, and
 |
(22) |
for the dotted line,
where
 ,
where
,
where
 ,
and where g(z) is a linear combination of the
Airy functions Ai and Bi which cancels out for z=0, e.g.:
,
and where g(z) is a linear combination of the
Airy functions Ai and Bi which cancels out for z=0, e.g.:
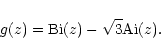 |
(23) |
![\begin{figure}
\par\includegraphics[width=8.6cm,clip]{sfig4.ps}
\end{figure}](/articles/aa/full/2002/20/aa1942/Timg142.gif) |
Figure 6:
Torque on the planet of runs R175i (diamonds). The value
of the separatrix distance used for the fits is
 .
The vertical three-dot-dashed line
shows the cut-off viscosity. Note that the fit maximum value at -0.01 is also the torque value at t=0 (cf. Fig. 4), and corresponds to a fully unsaturated corotation torque. .
The vertical three-dot-dashed line
shows the cut-off viscosity. Note that the fit maximum value at -0.01 is also the torque value at t=0 (cf. Fig. 4), and corresponds to a fully unsaturated corotation torque. |
The fits presented at Fig. 6 have the following functional
form:
 |
(24) |
where
 is one of the three functions given by Eqs. (20),
(21)
or
(22)
and therefore has one free parameter,
the floor level
is one of the three functions given by Eqs. (20),
(21)
or
(22)
and therefore has one free parameter,
the floor level
 ,
which corresponds to the case of a saturated corotation torque and therefore
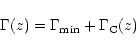
to the sum of the differential Lindblad torque and viscosity independent additional term of Eq. (3),
which scales with the one-sided Lindblad torque, and which turns out to be
,
which corresponds to the case of a saturated corotation torque and therefore
to the sum of the differential Lindblad torque and viscosity independent additional term of Eq. (3),
which scales with the one-sided Lindblad torque, and which turns out to be
 .
Although
is not a fit free parameter, the strong dependence of
.
Although
is not a fit free parameter, the strong dependence of
 upon
and the
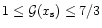
relatively high variation with azimuth of the separatrix distance to the orbit enables one to consider it
as a free parameter within a narrow range (e.g. here in the range
upon
and the
relatively high variation with azimuth of the separatrix distance to the orbit enables one to consider it
as a free parameter within a narrow range (e.g. here in the range
 ,
which can be gathered from
examination of Fig. 2). The value used for the fit of Fig. 6 falls within this range of values, and
it corresponds to the separatrix distance at
,
which can be gathered from
examination of Fig. 2). The value used for the fit of Fig. 6 falls within this range of values, and
it corresponds to the separatrix distance at
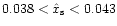
 rad. It should be noted that if one discards the lowest viscosity
points for the fit (for which residual numerical viscosity effects may affect the results), then one can get a good fit by
Eq. (20) as well, with a slightly larger value of
which still falls in the range
.
Despite of the uncertainties introduced by the low viscosity points, the fit correctly accounts for a number of properties of the
corotation torque main term (its absolute value, the half saturation for
rad. It should be noted that if one discards the lowest viscosity
points for the fit (for which residual numerical viscosity effects may affect the results), then one can get a good fit by
Eq. (20) as well, with a slightly larger value of
which still falls in the range
.
Despite of the uncertainties introduced by the low viscosity points, the fit correctly accounts for a number of properties of the
corotation torque main term (its absolute value, the half saturation for
 ,
and the fact that the
partial saturation regime
spans about two orders of magnitude of viscosity).
,
and the fact that the
partial saturation regime
spans about two orders of magnitude of viscosity).
The behavior at high viscosities differs markedly from the fit by Eq. (24). Indeed a cut-off of the corotation torque
is expected when the viscous drift time of a fluid element across the outer half of the
horseshoe region is shorter than half of its libration time. In that case the region
of fluid elements trapped in the co-orbital region has an azimuthal extent shorter than
the azimuthal extent of the horseshoe region. Figures 7
and 8 represent the streamlines for two cases of high viscosity (resp.
 and
and
 ).
).
![\begin{figure}
\par\includegraphics[width=8.1cm,clip]{sfig5.ps}
\end{figure}](/articles/aa/full/2002/20/aa1942/Timg153.gif) |
Figure 7:
Streamline aspect for the run R1759, which corresponds to the peak
value of the total torque of Fig. 6. The four thin solid lines represent
librating streamlines. One is almost exactly closed, the other ones not quite, as
a strictly steady state in the planet frame has not been reached yet. The set of
trapped fluid elements still have an azimuthal extent which is just smaller than  .
The dashed
line corresponds to a unique streamline, which originates in the outer disk and eventually
reaches the inner disk. The thick solid line represents the outer downstream separatrix
between circulating and librating streamlines. The shaded area shows the set of librating
fluid elements, the boundary of which (the thick dot dashed line) is also the outer
upstream separatrix and inner downstream separatrix. .
The dashed
line corresponds to a unique streamline, which originates in the outer disk and eventually
reaches the inner disk. The thick solid line represents the outer downstream separatrix
between circulating and librating streamlines. The shaded area shows the set of librating
fluid elements, the boundary of which (the thick dot dashed line) is also the outer
upstream separatrix and inner downstream separatrix. |
![\begin{figure}
\par\includegraphics[width=8.2cm,clip]{sfig6.ps}
\end{figure}](/articles/aa/full/2002/20/aa1942/Timg154.gif) |
Figure 8:
Streamline aspect for the run R17513. The three thin solid lines represent librating
streamlines. They are approximately closed. The azimuthal extent of the
trapped material (shaded area) is only about 2 rad, and its boundary roughly coincides with the
outer closed streamline. The dotted and dashed lines represent two open streamlines
originating in the outer disk. The thick solid line represents the outer downstream
separatrix. |
The outer downstream separatrix of Fig. 7 roughly coincides with that of Fig. 2. The material lying interior
to it is not librating however, as is illustrated by the dashed streamline. This material undergoes one horseshoe like close encounter with the
planet and goes to the inner disk. The distance between the outer downstream separatrix and the boundary of the trapped region (given
for
 by the outer upstream separatrix) increases with the viscosity and eventually becomes as large as the horseshoe region. In that
case, the material can go from the outer disk to the inner disk without any close encounter with the planet.
Figure 8 shows the example of two open streamlines
(dotted and dashed lines)
which correspond to two fluid elements which reach the inner disk without any
orbit crossing close
encounter with the planet, a situation that is impossible at low viscosities.
Note that the distance of the outer downstream separatrix to the orbit, measured
for
by the outer upstream separatrix) increases with the viscosity and eventually becomes as large as the horseshoe region. In that
case, the material can go from the outer disk to the inner disk without any close encounter with the planet.
Figure 8 shows the example of two open streamlines
(dotted and dashed lines)
which correspond to two fluid elements which reach the inner disk without any
orbit crossing close
encounter with the planet, a situation that is impossible at low viscosities.
Note that the distance of the outer downstream separatrix to the orbit, measured
for
 (instead of
in order for the viscous drift not to
affect sizably the measure at these high viscosities), is in the range
[0.035; 0.04]in Figs. 2, 7 and 8.
Therefore
this value is almost constant over three decades of viscosity, which justifies a posteriori
the choice of a unique value of
(instead of
in order for the viscous drift not to
affect sizably the measure at these high viscosities), is in the range
[0.035; 0.04]in Figs. 2, 7 and 8.
Therefore
this value is almost constant over three decades of viscosity, which justifies a posteriori
the choice of a unique value of
 for the fits of Fig. 6.
Figures 9 to 12 show
the value of the steady state normalized total torque as a function of viscosity
for different planet masses, respectively for disk thickness h=0.03,
h=0.04,
h=0.05, and
h=0.06.
![\begin{figure}
\par\includegraphics[width=8.5cm,clip]{sfig11.ps}
\end{figure}](/articles/aa/full/2002/20/aa1942/Timg158.gif) |
Figure 9:
Total torque exerted on the planet as a function of viscosity, for a disk aspect ratio h=0.03 and five different values of the planet mass. |
It can checked on these figures that the viscosity at which the torque begins to
decrease increases with the planet mass. This is in agreement with the fact that
the cut-off at high viscosity occurs for
 ,
and that
increases with the planet mass.
It can also be checked that the torque saturation occurs at lower viscosities for smaller
masses, as the saturation occurs for
,
and that
increases with the planet mass.
It can also be checked that the torque saturation occurs at lower viscosities for smaller
masses, as the saturation occurs for
 .
.
![\begin{figure}
\par\includegraphics[width=8.6cm,clip]{sfig10.ps}
\end{figure}](/articles/aa/full/2002/20/aa1942/Timg161.gif) |
Figure 10:
Total torque exerted on the planet as a function of viscosity, for a disk aspect ratio h=0.04 and five different values of the planet mass. |
![\begin{figure}
\par\includegraphics[width=8.6cm,clip]{sfig9.ps}
\end{figure}](/articles/aa/full/2002/20/aa1942/Timg162.gif) |
Figure 11:
Total torque exerted on the planet as a function of viscosity, for a disk aspect ratio h=0.05 and five different values of the planet mass. |
![\begin{figure}
\par\includegraphics[width=8.6cm,clip]{sfig12.ps}
\end{figure}](/articles/aa/full/2002/20/aa1942/Timg163.gif) |
Figure 12:
Total torque exerted on the planet as a function of viscosity, for a disk aspect ratio h=0.06 and four different values of the planet mass. |
These results can
be used to try identify the additional corotation torque term of Eq. (3).
The main problem
is to evaluate the residual torque, i.e. to correct the measured torque from the main corotation torque term. This latter
involves the separatrix distance to the orbit
to the fourth power, and it is therefore very sensitive
to any error on the estimate of this separatrix distance. Two solutions
can be adopted: the first one consists in considering that the measured torque value at low viscosity is the
sum of the differential Lindblad torque and the additional corotation torque term (in which case there is no need to
evaluate the main corotation torque term) and the second one consists in correcting the torque measured at large viscosity
- although much before the cut-off - from this main term and attributing the residual to the sum of the differential Lindblad term and the
additional corotation torque term. This latter solution turns out to be easier and more reliable, despite of the difficulty in measuring .
Indeed the disk response at low viscosity may involve a strongly non-linear disk response (the dip around the orbit tends to become
a fully qualified gap), which modifies the differential Lindblad torque in a way that is not trivial to correct. Furthermore, finite numerical viscosity
effects (which are difficult to quantify)
and the long viscous time-scale are two additional factors which may lead to a significant difference between
the ideal low viscosity steady state
situation and the run results after 120 orbits.
![\begin{figure}
\par\includegraphics[width=8.1cm,clip]{aa1942f22.ps}
\end{figure}](/articles/aa/full/2002/20/aa1942/Timg164.gif) |
Figure 13:
Separatrix shape for a low mass, low aspect ratio case. The distance of the separatrix to the orbit varies by
about 23% over the azimuth and therefore its fourth
power varies by a factor 2.3 with azimuth.
 and
and
 stand for the distance to the orbit of the outer and inner separatrices, respectively. They are functions of the azimuth
  .
In this example .
In this example
 rad. rad. |
Evaluating the corotation torque main term involves a precise measurement of the value of .
It can be seen in Fig. 13
how the distance
between the separatrix and the orbit varies with azimuth.
The value for
is chosen to be the arithmetical average of the
outer downstream separatrix position at a given angle
 from outer conjunction and the inner downstream separatrix position
at the corresponding angle
from outer conjunction and the inner downstream separatrix position
at the corresponding angle
 from inner conjunction:
![\begin{displaymath}x_{\rm s}=\frac 12[x_{\rm s}^+(\Delta\theta)+x_{\rm s}^-(2\pi-\Delta\theta)].
\end{displaymath}](/articles/aa/full/2002/20/aa1942/img167.gif) |
(25) |
The value of
is then varied between 1 and  rad, which leads to a dispersion in the corotation torque main
term evaluation, and this leads therefore to a dispersion of the residual torque estimate. The corresponding residual torque estimates
are shown for the four different disk thicknesses in Figs. 14 to 17.
rad, which leads to a dispersion in the corotation torque main
term evaluation, and this leads therefore to a dispersion of the residual torque estimate. The corresponding residual torque estimates
are shown for the four different disk thicknesses in Figs. 14 to 17.
![\begin{figure}
\par\includegraphics[width=8.5cm,clip]{aa1942f21.ps}
\end{figure}](/articles/aa/full/2002/20/aa1942/Timg169.gif) |
Figure 14:
Residual normalized torque as a function of the separatrix distance, for the 3% aspect ratio disk. The dotted line shows the linear regression fit.
The error bars are obtained by taking
respectively the maximum and minimum value of the average of
 and
and
 ,
when ,
when  varies.
 |
![\begin{figure}
\par\includegraphics[width=8.6cm,clip]{aa1942f20.ps}
\end{figure}](/articles/aa/full/2002/20/aa1942/Timg170.gif) |
Figure 15:
Residual normalized torque as a function of the separatrix distance, for the 4% aspect ratio disk. The dotted line shows the linear regression fit. |
![\begin{figure}
\par\includegraphics[width=8.6cm,clip]{aa1942f19.ps}
\end{figure}](/articles/aa/full/2002/20/aa1942/Timg171.gif) |
Figure 16:
Residual normalized torque as a function of the separatrix distance, for the 5% aspect ratio disk. The dotted line shows the linear regression fit. The white square shows a measurement for which the separatrix distance to the orbit is smaller than the radial zone width, which means that the librating region is narrower than two zones in radius. It is therefore discarded for the linear regression fit. |
![\begin{figure}
\par\includegraphics[width=8.6cm,clip]{aa1942f18.ps}
\end{figure}](/articles/aa/full/2002/20/aa1942/Timg172.gif) |
Figure 17:
Residual normalized torque as a function of the separatrix distance, for the 6% aspect ratio disk. The dotted line shows the linear regression fit. |
The results of the linear regression fits performed on these figures are shown in Table 3.
A number of comments can be made from these figures and from the table:
- 1.
- The correction is performed at the peak value of the total term, while the separatrix position is searched for at a slightly
lower viscosity. The correction takes into account a possibly
partial saturation of the corotation torque at its peak value.
- 2.
- The function which is used to correct the main corotation term from partial saturation is the function given by
Eq. (20). Inspection of Fig. 6 shows that using either
Eq. (21)
or Eq. (22) would not change significantly the results, given the uncertainty on ,
and given the fact that at its
peak value the corotation torque is almost fully unsaturated.
- 3.
- The value at
 of the linear regression fit corresponds roughly to the limit value that can be deduced by eye from the limit value at
 in Figs. 9 and 10.
In the case of h=0.05, the uncertainties are considerable, and in the h=0.06 case, no curve reaches the fully saturated regime at
low
in Figs. 9 and 10.
In the case of h=0.05, the uncertainties are considerable, and in the h=0.06 case, no curve reaches the fully saturated regime at
low  .
.
- 4.
- The mean slope
 distribution is compatible with the expectation. It should be mentioned however that the function
 is not expected to be a constant,
and that its value, which is such that:
is not expected to be a constant,
and that its value, which is such that:
 ,
depends on the location
at which the separatrix samples the axisymmetric profiles perturbations.
,
depends on the location
at which the separatrix samples the axisymmetric profiles perturbations.
- 5.
- The variation with mass of the peak value of the total normalized torque for a given aspect ratio can
be accounted for by the slope of the
fit, i.e. this variation is roughly equal to
 .
This
therefore accounts for the increasing peak value with the planet mass, whereas one would expect a constant maximum in the linear regime
(
.
This
therefore accounts for the increasing peak value with the planet mass, whereas one would expect a constant maximum in the linear regime
(
 )
and a decreasing peak value beyond (
)
and a decreasing peak value beyond (
 ).
).
- 6.
- Not all the behavior observed is entirely due to the additional corotation torque term. Indeed
there is no reason to assume that the normalized
differential Lindblad torque is a constant for a given aspect ratio. Although this is certainly true in the linear regime, it is no
longer true
for higher masses. Miyoshi et al. 1999 note that in an infinitesimally thin disk, in the non-linear regime (the threshold
of which they find at
 ,
where
,
where  is the planet Hill radius), the one-sided Lindblad torque is smaller than its linear
estimate. They mention that part of the cut-off comes from material inside the horseshoe region, which exerts an opposite torque on the
perturber, and weakens the linear estimate of the Lindblad torque. As the material in the horseshoe region is librating in the planet frame,
this material in average corotates with the planet, and therefore participates in the corotation torque and no in the Lindblad torque. If one
defines the Lindblad torque as the torque exerted by the circulating material on the planet, which is, in the steady state regime, the only
definition which ensures that the total torque exerted on the planet is the sum of the corotation and Lindblad torques (as the co-orbital
dynamics partitions the disk into librating and circulating fluid elements) then it is not clear whether the behavior observed by Miyoshi et al.
is due to a Lindblad torque non-linear cut-off or to an avatar of the additional corotation torque term. If one performs however a local scattering
calculation (Lin & Papaloizou 1979; Papaloizou & Lin 1984) over the circulating fluid elements, then one expects a q-1 cut-off
of the one-sided Lindblad torque when the separatrix lies further than (2/3)H from the orbit, i.e. when the horseshoe region invades
what would be otherwise the place of disk-perturber angular momentum exchange through Lindblad torques. It should be noted that
on the present data set, the conditions
is the planet Hill radius), the one-sided Lindblad torque is smaller than its linear
estimate. They mention that part of the cut-off comes from material inside the horseshoe region, which exerts an opposite torque on the
perturber, and weakens the linear estimate of the Lindblad torque. As the material in the horseshoe region is librating in the planet frame,
this material in average corotates with the planet, and therefore participates in the corotation torque and no in the Lindblad torque. If one
defines the Lindblad torque as the torque exerted by the circulating material on the planet, which is, in the steady state regime, the only
definition which ensures that the total torque exerted on the planet is the sum of the corotation and Lindblad torques (as the co-orbital
dynamics partitions the disk into librating and circulating fluid elements) then it is not clear whether the behavior observed by Miyoshi et al.
is due to a Lindblad torque non-linear cut-off or to an avatar of the additional corotation torque term. If one performs however a local scattering
calculation (Lin & Papaloizou 1979; Papaloizou & Lin 1984) over the circulating fluid elements, then one expects a q-1 cut-off
of the one-sided Lindblad torque when the separatrix lies further than (2/3)H from the orbit, i.e. when the horseshoe region invades
what would be otherwise the place of disk-perturber angular momentum exchange through Lindblad torques. It should be noted that
on the present data set, the conditions
 and
and
 are almost strictly equivalent. In the h=3% case
(Fig. 14), all points but the bottom one correspond to situation beyond the non-linear threshold, while in the h=6% case
(Fig. 17), all points correspond to a situation where the one-sided Lindblad torque is still in the linear regime (the Hill radius
of the most massive planet is precisely
are almost strictly equivalent. In the h=3% case
(Fig. 14), all points but the bottom one correspond to situation beyond the non-linear threshold, while in the h=6% case
(Fig. 17), all points correspond to a situation where the one-sided Lindblad torque is still in the linear regime (the Hill radius
of the most massive planet is precisely
 ). Therefore the behavior observed for the thinner disks is likely to be contaminated
by a differential Lindblad torque non-linear cut-off (which also conspires to lift the normalized curves as the planet mass increases),
whereas the
behavior observed for the h=0.06 disk is exempt of this contamination and should be due entirely to the additional corotation torque
term of Eq. (3).
). Therefore the behavior observed for the thinner disks is likely to be contaminated
by a differential Lindblad torque non-linear cut-off (which also conspires to lift the normalized curves as the planet mass increases),
whereas the
behavior observed for the h=0.06 disk is exempt of this contamination and should be due entirely to the additional corotation torque
term of Eq. (3).
Despite of the difficulty of these measures,
these results confirm the existence of a term in the total torque which scales roughly as
 ,
in agreement with the expectation that
,
in agreement with the expectation that
 ,
and
,
and
 .
.
Up: The co-orbital corotation torque
Copyright ESO 2002
![\begin{figure}
\par\includegraphics[width=8.3cm,clip]{sfig1bis.ps}
\end{figure}](/articles/aa/full/2002/20/aa1942/img122.gif)
![\begin{figure}
\par\includegraphics[width=8.1cm,clip]{sfig1.ps}
\end{figure}](/articles/aa/full/2002/20/aa1942/img123.gif)

![\begin{figure}
\par\includegraphics[width=8.6cm,clip]{sfig4.ps}
\end{figure}](/articles/aa/full/2002/20/aa1942/img142.gif)
![\begin{figure}
\par\includegraphics[width=8.1cm,clip]{sfig5.ps}
\end{figure}](/articles/aa/full/2002/20/aa1942/img153.gif)
![\begin{figure}
\par\includegraphics[width=8.5cm,clip]{sfig11.ps}
\end{figure}](/articles/aa/full/2002/20/aa1942/img158.gif)
![\begin{figure}
\par\includegraphics[width=8.6cm,clip]{sfig10.ps}
\end{figure}](/articles/aa/full/2002/20/aa1942/img161.gif)
![\begin{figure}
\par\includegraphics[width=8.6cm,clip]{sfig9.ps}
\end{figure}](/articles/aa/full/2002/20/aa1942/img162.gif)
![\begin{figure}
\par\includegraphics[width=8.6cm,clip]{sfig12.ps}
\end{figure}](/articles/aa/full/2002/20/aa1942/img163.gif)
![\begin{figure}
\par\includegraphics[width=8.6cm,clip]{aa1942f20.ps}
\end{figure}](/articles/aa/full/2002/20/aa1942/img170.gif)
![\begin{figure}
\par\includegraphics[width=8.6cm,clip]{aa1942f18.ps}
\end{figure}](/articles/aa/full/2002/20/aa1942/img172.gif)
![\begin{figure}
\par\includegraphics[width=8cm,clip]{surfdens.ps}
\end{figure}](/articles/aa/full/2002/20/aa1942/img118.gif)
![\begin{figure}
\par\includegraphics[width=8.6cm,clip]{sfig2.ps}
\end{figure}](/articles/aa/full/2002/20/aa1942/img134.gif)
![\begin{figure}
\par\includegraphics[width=8.3cm,clip]{sfig3.ps}
\end{figure}](/articles/aa/full/2002/20/aa1942/img135.gif)
![\begin{figure}
\par\includegraphics[width=8.2cm,clip]{sfig6.ps}
\end{figure}](/articles/aa/full/2002/20/aa1942/img154.gif)
![\begin{figure}
\par\includegraphics[width=8.1cm,clip]{aa1942f22.ps}
\end{figure}](/articles/aa/full/2002/20/aa1942/img164.gif)
![\begin{figure}
\par\includegraphics[width=8.5cm,clip]{aa1942f21.ps}
\end{figure}](/articles/aa/full/2002/20/aa1942/img169.gif)
![\begin{figure}
\par\includegraphics[width=8.6cm,clip]{aa1942f19.ps}
\end{figure}](/articles/aa/full/2002/20/aa1942/img171.gif)