Following Standish & Aksnes (1969), Lecar & Cruz-Conzález (1972) and Hernquist (1987) we will measure relaxation using the angular deflection suffered by a test particle moving in a configuration of N field particles fixed in space.
Let us consider a sphere of a given density profile represented by N fixed
particles, which we will hereafter refer to as field particles, and
let us place a test particle of zero mass at the edge of
this sphere either at rest, or with a radial velocity v. In the
limit of
![]() its trajectory
will be a straight line passing through the center of the sphere,
which we will hereafter call the theoretical trajectory. For
a finite N, however, the test particle will be
deflected by a number of encounters with the field particles and
thus it will cross the surface of the sphere at an angle
its trajectory
will be a straight line passing through the center of the sphere,
which we will hereafter call the theoretical trajectory. For
a finite N, however, the test particle will be
deflected by a number of encounters with the field particles and
thus it will cross the surface of the sphere at an angle ![]() from
the corresponding theoretical point. Following Standish & Aksnes
(1969), or Lecar & Cruz-Conzález (1972), we can
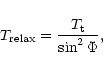
measure the relaxation time as
from
the corresponding theoretical point. Following Standish & Aksnes
(1969), or Lecar & Cruz-Conzález (1972), we can
measure the relaxation time as
We will repeat such calculations here, extending them to non-homogeneous density distributions, different initial velocities of the test particle and a larger range of field particle numbers N. This will allow us to discuss the effect of central concentration, of initial test particle velocities, of softening and of particle number on the relaxation time.
To find the effect of central concentration on the relaxation time we
use three different
mass distributions, namely the homogeneous sphere (hereafter model H),
the Plummer model (hereafter model P) and the Dehnen sphere (Dehnen
1993 - hereafter model D). For the Plummer model the density is
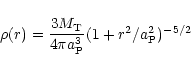 |
(10) |
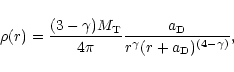 |
(11) |
These three models span a large range of central concentrations. They have the same cut-off radius, but the radius containing 1/10 of the total mass is for model D roughly one fourth of the corresponding radius for model P and roughly an order of magnitude smaller than that of model H. Similarly the radius containing half the mass for model D is roughly half of that of model P and a third of that of model H. These models will thus allow us to explore fully the effect of central concentration on the relaxation time.
We start 1000 test particles from random positions on the surface
of a sphere of radius 20 and with initial radial velocities equal to
![]() times
their theoretical escape velocity (hereafter
times
their theoretical escape velocity (hereafter
![]() ), calculated
from the model. The particles were advanced using a
leap-frog scheme with a fixed time-step of
), calculated
from the model. The particles were advanced using a
leap-frog scheme with a fixed time-step of
![]() .
We made sure this gives a sufficient accuracy by
calculating orbits without the use of GRAPE and with this
time-step. This showed that the energy is
conserved to 8 or 9 digits. We then repeated the exercise using a
Bulirsch-Stoer scheme (Press et al. 1992) and found that the
energy was conserved to 10 digits. Since an accuracy of 8 or 9 digits
is ample for our work, we adopted the leap-frog integrator and the
afore-mentioned time-step.
.
We made sure this gives a sufficient accuracy by
calculating orbits without the use of GRAPE and with this
time-step. This showed that the energy is
conserved to 8 or 9 digits. We then repeated the exercise using a
Bulirsch-Stoer scheme (Press et al. 1992) and found that the
energy was conserved to 10 digits. Since an accuracy of 8 or 9 digits
is ample for our work, we adopted the leap-frog integrator and the
afore-mentioned time-step.
The forces between particles were calculated using one of the Marseille GRAPE-3AF systems, except for the results given in Sects. 5.4 and 5.5, where we used the Marseille GRAPE-4 system.
For each model we take 10 different field particles distributions
and for each we calculate the 1000 test particles trajectories.
For simplicity the test particles are the same in each of the 10 field
particles distributions.
For each of the test particles we calculate ![]() and
the deflection angle from the theoretical (straight line)
orbit,
and
the deflection angle from the theoretical (straight line)
orbit, ![]() .
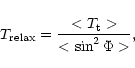
Then the relaxation time is calculated using Eqs. (8) and (9). The errors are obtained using
the bootstrap method (Press et al. 1992). In Figs. 3 to 5 error bars are plotted only when
.
Then the relaxation time is calculated using Eqs. (8) and (9). The errors are obtained using
the bootstrap method (Press et al. 1992). In Figs. 3 to 5 error bars are plotted only when
![]() .
.
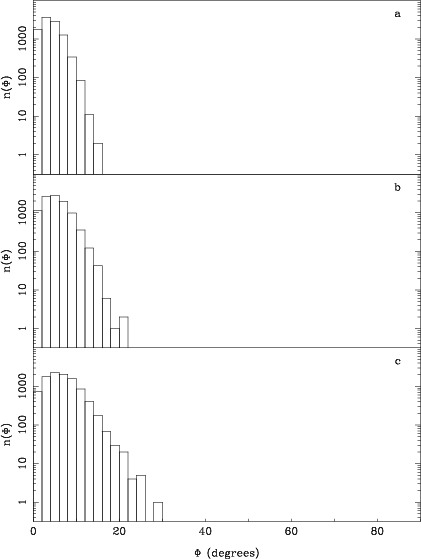 |
Figure 1:
Distribution of the number of test particles orbits that have a given
deflection angle, |
Equations (8) and (9) were derived
assuming small deflection angles. There could, however, be
cases in which a test particle comes very near a given field particle
and is very strongly deviated from its initial trajectory, so that the
deflection angle is greater than
90
![]() .
In that case Eqs. (8) and (9) are certainly not valid, particularly since for a
deflection of 180
.
In that case Eqs. (8) and (9) are certainly not valid, particularly since for a
deflection of 180
![]() they will give the same result as for 0
they will give the same result as for 0
![]() .
It is not easy to treat such deflections accurately, so what
we will do here is to keep track of their number and make sure that
it is sufficiently small so as not to influence our results. We have
thus monitored the number of orbits whose velocity component along the
axis which includes the initial radial velocity changes sign. We will
hereafter for brevity call such orbits looping orbits. None
were found for the homogeneous sphere distribution, and very
few, 3 in 10000 at the most, for the case of the Plummer sphere,
and that for the smallest of the softenings used here
(cf. Sect. 5.3 and Fig. 5). The largest
number of looping orbits was found, as expected, for model D
and the smallest
softening, i.e.
.
It is not easy to treat such deflections accurately, so what
we will do here is to keep track of their number and make sure that
it is sufficiently small so as not to influence our results. We have
thus monitored the number of orbits whose velocity component along the
axis which includes the initial radial velocity changes sign. We will
hereafter for brevity call such orbits looping orbits. None
were found for the homogeneous sphere distribution, and very
few, 3 in 10000 at the most, for the case of the Plummer sphere,
and that for the smallest of the softenings used here
(cf. Sect. 5.3 and Fig. 5). The largest
number of looping orbits was found, as expected, for model D
and the smallest
softening, i.e.
![]() .
For this case,
.
For this case,
![]() and N = 64000, we find of the
order of 30 such orbits in 10000. Although this is considerably
larger than the corresponding number for homogeneous and Plummer
spheres, it is still low enough not to influence much our statistics,
particularly if we take into account that it refers to an exceedingly
small softening. For the more reasonable value
and N = 64000, we find of the
order of 30 such orbits in 10000. Although this is considerably
larger than the corresponding number for homogeneous and Plummer
spheres, it is still low enough not to influence much our statistics,
particularly if we take into account that it refers to an exceedingly
small softening. For the more reasonable value
![]() ,
we
find that there are no looping orbits at all. We can thus safely
conclude that the number
of particles with looping orbits is too low to influence our results.
,
we
find that there are no looping orbits at all. We can thus safely
conclude that the number
of particles with looping orbits is too low to influence our results.
We still have to make sure that the remaining orbits have sufficiently
small deflection angles for Eqs. (8) and (9) to be valid. Figure 1 shows a
histogram of the number of test particles orbits that have a given
deflection angle, ![]() ,
as a function of that angle,
,
as a function of that angle, ![]() ,
for
model D, i.e. the one that should have the largest deflection
angles, with
,
for
model D, i.e. the one that should have the largest deflection
angles, with
![]() ,
,
![]() .
The upper panel
corresponds to N=4000, the middle one to N=2000 and the lower
one to N=1000. Note that we have used a logarithmic scale for the
ordinate, because otherwise the plot would show in all cases only a few
bins near
.
The upper panel
corresponds to N=4000, the middle one to N=2000 and the lower
one to N=1000. Note that we have used a logarithmic scale for the
ordinate, because otherwise the plot would show in all cases only a few
bins near
![]() .
.
For N=1000 there is one particle with deviation of
![]() ,
one
with
,
one
with
![]() and two with
and two with
![]() .
Furthermore only 30
trajectories, of a total of 10000, have a deflection angle larger
than
.
Furthermore only 30
trajectories, of a total of 10000, have a deflection angle larger
than
![]() .
The
numbers are even more comforting for N=2000, where only two
trajectories have a deflection angle larger than
.
The
numbers are even more comforting for N=2000, where only two
trajectories have a deflection angle larger than
![]() ,
and even
more so
for N=4000, where no particles reach that deflection angle. We can
thus conclude that in all but very few cases the small deflection
angle hypothesis leading to Eqs. (8) and (9) is valid.
,
and even
more so
for N=4000, where no particles reach that deflection angle. We can
thus conclude that in all but very few cases the small deflection
angle hypothesis leading to Eqs. (8) and (9) is valid.
Copyright ESO 2001