A&A 431, 757-771 (2005)
DOI: 10.1051/0004-6361:20042009
S. Blondin1 - J. R. Walsh2 - B. Leibundgut1 - G. Sainton3
1 - European Southern Observatory (ESO), Karl-Schwarzschild-Strasse
2, 85748 Garching bei München, Germany
2 -
Space Telescope-European Coordinating Facility (ST-ECF), European
Southern Observatory (ESO), Karl-Schwarzschild-Strasse 2, 85748 Garching bei
München, Germany
3 -
LPNHE CNRS/IN2P3, Université Paris VI & VII, 4 place Jussieu,
75252 Paris Cedex 05, France
Received 14 September 2004 / Accepted 14 October 2004
Abstract
We use a new technique to extract the spectrum of a supernova
from that of the contaminating background of its host galaxy, and apply it to
the specific case of high-redshift Type Ia supernova (SN Ia) spectroscopy. The
algorithm is based on a two-channel iterative technique employing the
Richardson-Lucy restoration method and is implemented in the IRAF code
specinholucy. We run the code both on simulated (SN Ia at z=0.5
embedded in a bright host galaxy) and observed (SNe Ia at various phases up
to z=0.236) data taken with VLT+FORS1 and show the advantages of using such
a deconvolution technique in comparison with less elaborate methods. This
paper is motivated by the need for optimal supernova spectroscopic
data reduction in order to make meaningful comparisons between the low and
high-redshift SN Ia samples. This may reveal subtle evolutionary and
systematic effects that could depend on redshift, and bias the cosmological
results derived from comparisons of local and high-z SNe Ia in recent years.
We describe the various aspects of the extraction in some detail as
guidelines for the first-time user and present an optimal observing strategy
for successful implementation of this method in future high-z SN Ia
spectroscopic follow-up programmes.
Key words: stars: supernovae: general - stars: supernovae: individual: SN 2002bo, SN 2002go, SN 2002gr - instrumentation: spectrographs - methods: data analysis - techniques: spectroscopic
The initial claim made by two independent teams - the High-Z Supernova Search
Team (Schmidt et al. 1998) and the Supernova Cosmology Project (Perlmutter et al. 1999) -
that the apparent dimming of Type Ia supernovae (SN Ia) at redshifts of
![]() implies a present accelerating expansion of the universe
(Riess et al. 1998a; Perlmutter et al. 1999), and its subsequent confirmation
with improved precision (Knop et al. 2003; Barris et al. 2004; Tonry et al. 2003), have
prompted an increased interest in these astrophysical events. On the
theoretical side, much effort and computing time has been devoted to
multi-dimensional modelling of the explosion in order to provide physical
input parameters for spectral synthesis calculations (see Hillebrandt & Niemeyer 2000,
for a review). On the observational side several teams are currently using
SNe Ia both to probe the decelerating expansion at higher (
implies a present accelerating expansion of the universe
(Riess et al. 1998a; Perlmutter et al. 1999), and its subsequent confirmation
with improved precision (Knop et al. 2003; Barris et al. 2004; Tonry et al. 2003), have
prompted an increased interest in these astrophysical events. On the
theoretical side, much effort and computing time has been devoted to
multi-dimensional modelling of the explosion in order to provide physical
input parameters for spectral synthesis calculations (see Hillebrandt & Niemeyer 2000,
for a review). On the observational side several teams are currently using
SNe Ia both to probe the decelerating expansion at higher (
![]() )
redshifts - the Hubble Higher-z Supernova Search (Riess et al. 2004) - and to
measure second order effects (the equation-of-state parameter
)
redshifts - the Hubble Higher-z Supernova Search (Riess et al. 2004) - and to
measure second order effects (the equation-of-state parameter
![]() )
at intermediate (
)
at intermediate (
![]() )
redshifts
- such as ESSENCE (Matheson et al. 2005; Miknaitis et al. 2005) and the CFHT SuperNova
Legacy Survey, or SNLS (Pain & SNLS Collaboration 2002).
)
redshifts
- such as ESSENCE (Matheson et al. 2005; Miknaitis et al. 2005) and the CFHT SuperNova
Legacy Survey, or SNLS (Pain & SNLS Collaboration 2002).
However, the physical parameters governing the SN Ia explosion mechanism are today not fully understood and the empirical parametrisation of the entire SN Ia class - the so-called "Phillips relation'' (see Phillips 1993) - has no physical basis. The aforementioned observational programmes will detect several hundreds of high-z SNe Ia, at which stage the statistical errors in the sample will have reached the systematic error floor. The cosmological effect detected via observations of Type Ia supernovae is indeed a subtle one (see Leibundgut 2001, for a review) and the field is limited by the systematic errors involved in such measurements and their possible evolution with redshift.
Spectroscopy is an ideal way to probe these potential evolutionary effects through systematic comparison of high-z SN Ia spectra with local templates. This requires the extraction of clean SN Ia spectra devoid of background contamination, mainly by the host galaxy and sky lines (for ground-based observations). For high signal-to-noise (hereafter S/N) cases, when the supernova is bright with respect to its immediate underlying background, standard extraction software will in general work well. However, when the supernova is faint compared to the background, e.g. at late phases, heavily superposed on its host galaxy or simply at a high redshift, a more elaborate technique is required to ensure that we are not extracting non-SN flux.
The purpose of this paper is to test such a method that has been implemented
in the IRAF![]() code specinholucy (Lucy & Walsh 2003). It is based on a
two-channel restoration algorithm that restores a point spread function
(PSF)-like component in a 2D image and an underlying extended background
separately. It is of wide astronomical use and has already been
successfully applied to the restoration of point-source spectra in highly
inhomogeneous backgrounds (see Lucy & Walsh 2003), such as is often the case for
high-z SNe Ia embedded in their host galaxy. The fact that the entire 2D
spectrum of the background (with or without the inclusion of the restored
point source spectrum) is restored in such an algorithm means that we have
a firm hold on potential systematic errors associated with the restoration.
This is done by simply comparing the residuals in the restored 2D spectrum
with the statistical noise limit of the input 2D spectrum (the square root
of the number of photoelectrons). Should these residuals fall below this limit
then we can consider the restoration to be successful. This is a clear
advantage over traditional spectral extraction routines where no secure hold
on systematic errors is possible. Furthermore, the very nature of the
algorithm presented in this paper implies that all non PSF-like components in
the input 2D spectrum are automatically allocated to the background channel.
We are making no a priori assumptions on the nature of the
contaminating extended background component and only rely on the point-like
nature of the supernova's spatial profile.
code specinholucy (Lucy & Walsh 2003). It is based on a
two-channel restoration algorithm that restores a point spread function
(PSF)-like component in a 2D image and an underlying extended background
separately. It is of wide astronomical use and has already been
successfully applied to the restoration of point-source spectra in highly
inhomogeneous backgrounds (see Lucy & Walsh 2003), such as is often the case for
high-z SNe Ia embedded in their host galaxy. The fact that the entire 2D
spectrum of the background (with or without the inclusion of the restored
point source spectrum) is restored in such an algorithm means that we have
a firm hold on potential systematic errors associated with the restoration.
This is done by simply comparing the residuals in the restored 2D spectrum
with the statistical noise limit of the input 2D spectrum (the square root
of the number of photoelectrons). Should these residuals fall below this limit
then we can consider the restoration to be successful. This is a clear
advantage over traditional spectral extraction routines where no secure hold
on systematic errors is possible. Furthermore, the very nature of the
algorithm presented in this paper implies that all non PSF-like components in
the input 2D spectrum are automatically allocated to the background channel.
We are making no a priori assumptions on the nature of the
contaminating extended background component and only rely on the point-like
nature of the supernova's spatial profile.
In Sect. 2 we present the algorithm and its application to the case of supernovae embedded in their host galaxy. We dedicate Sects. 3 and 4 to the specific issues of the PSF spectrum - or slit spread function (SSF) - used to restore the point source and of the spatial resolution kernel used to discriminate between the point source and the underlying extended background, respectively, as they are of crucial importance to the proper functioning of specinholucy. In Sects. 5 and 6 we test the algorithm on simulated and observed data, respectively. Section 7 serves the purpose of comparing our technique to alternative spectral extraction methods, and we further discuss the advantages of using our approach alongside an optimal observing strategy for its successful implementation in Sect. 8.
The need for comparisons between the high-z and the local SN Ia spectra in order to make quantitative statements on their potential differences requires the use of such an elaborate two-channel deconvolution technique. The code specinholucy enables a truly quantitative analysis of high-z SN Ia spectra and opens the path for meaningful detections of potential evolutionary signatures in their spectra.
Lucy & Walsh (2003) - subsequently LW03 - have described two iterative techniques
for decomposing a long-slit spectrum into spectra of designated point
sources and an underlying background. The methods are based on a
two-channel restoration (Lucy 1994; Hook & Lucy 1994) using
the Richardson-Lucy (Richardson 1972; Lucy 1974) iterative
restoration. The essence of this technique is to treat the point
source(s) and the extended background as two channels for restoration.
It must be emphasized at the outset that this restoration occurs
purely in the spatial direction and no implied spectral
restoration is undertaken.
Thus, for instance, residuals from fringing corrections should not
be relevant unless the fringes are tilted with respect to the dispersion axis,
in which case an additional inhomogeneous component would be added to the
background.
The first channel contains the point
source(s) which are restored to delta functions using an appropriate
PSF. For a spectrum the PSF must be
specified as a function of wavelength; this is simply the aforementioned
SSF in Lucy & Walsh (2003).
In order to iteratively restore the extended
component, it is necessary to impose a limiting resolution, larger than
that set by the PSF, in order to prevent the second channel
from modelling the point sources as peaks in the extended component.
The resolution limit for the background is set by defining the
restored background to be the convolution of a non-negative auxiliary
function with a wavelength-independent resolution kernel R. Then no feature
whose width is less than R can appear in the restored background.
If the width of R is greater than the PSF, then the convolution of
the model of the extended background ![]() with the PSF cannot fit a point source, which must therefore
be modelled by the first channel.
with the PSF cannot fit a point source, which must therefore
be modelled by the first channel.
Two methods are described in LW03: one for a
homogeneous background (i.e. the spectrum of the background is
homogeneous - does not vary with position); the second,
more general, case allows the spectrum of the background to vary
as a function of position along the slit - termed the inhomogeneous
background case. In the case of a galaxy including an SN the homogeneous
case is appropriate.
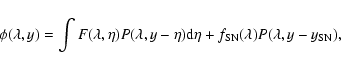
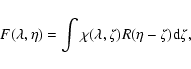
The observed spectrum
![]() ,
where
,
where ![]() is the
dispersion direction and y the cross-dispersion direction, can
then be modelled as:
is the
dispersion direction and y the cross-dispersion direction, can
then be modelled as:
 |
(1) |
 |
(2) |
The unknowns
![]() and
and ![]() are determined by iterative
improvement of the fit of
are determined by iterative
improvement of the fit of ![]() to the observed spectrum, using the
R-L algorithm to improve both the point source spectrum and the
background until convergence is reached. The iteration steps are
described in detail in LW03. There are two convergence criteria:
the fractional change in the spectrum per R-L iteration
summed for all wavelengths; the fractional change in
to the observed spectrum, using the
R-L algorithm to improve both the point source spectrum and the
background until convergence is reached. The iteration steps are
described in detail in LW03. There are two convergence criteria:
the fractional change in the spectrum per R-L iteration
summed for all wavelengths; the fractional change in ![]() per iteration summed over all wavelengths and cross-dispersion range.
In practice, depending on the particular details of the spectrum,
one of these criteria may converge much faster than the other, though
both must be met for the code to converge.
per iteration summed over all wavelengths and cross-dispersion range.
In practice, depending on the particular details of the spectrum,
one of these criteria may converge much faster than the other, though
both must be met for the code to converge.
The situation of an SN observed in a host galaxy is an ideal use of the inhomogeneous case (see LW03, for some other examples). This is the simplest application since there is ideally one point source and a structurally well-resolved galaxy. When the SN is in the outer regions of an early-type galaxy, then the sophistication of the technique is probably not essential and more traditional methods, such as a linear or polynomial fit to the background and extraction, with or without weighting, of the point source, are adequate. However, when the SN is near the centre of a galaxy, or the galaxy does not have a smooth radial profile, or there is line emission in the galaxy host (e.g. for late-type galaxies), then the simple methods fail and a dedicated extraction or a restoration approach is mandatory. In Sect. 7 we compare the technique presented here with other less advanced methods.
The inhomogeneous case is implemented in the IRAF code specinholucy, which is available in the ST-ECF layered package specres. In addition to the input long-slit 2D spectrum, there are two important input parameters: the SSF, which obviously must match as well as possible the cross-dispersion profile as a function of wavelength for the SN observation, and the position of the SN on the slit. The inhomogeneous decomposition technique needs the position of the point source that is to be extracted from the extended background (i.e. the host galaxy). Errors in this position will result in mixing of the two channels in the output-restored spectrum so that for example the background is excavated asymmetrically around the point source. However, this requirement is not as limiting as it sounds since one of the outputs is a 2D restored version of the input 2D long-slit spectrum (including both the SN and the host galaxy) which can be directly compared with the latter spectrum, and a mismatch of the position shows up as a higher frequency component than the resolution kernel in the neighbourhood of the designated SN. The primary output is the spectrum of the SN, which is strictly 1D. If an error image is available for the input long-slit spectrum, it can be supplied to produce Monte Carlo error estimates for the restored output spectra (point source and extended background).
LW03 discuss some of the difficulties with using an empirical SSF. For ground-based data a spectrum of a bright standard star is ideal, but this must be taken in identical conditions to those of the SN spectrum. In practice this is almost impossible to achieve. Even a star on the slit of the same observation as the SN cannot be guaranteed to provide an ideal SSF, since the star may not be centred on the slit as the SN is centered and instrumental optical aberrations can produce off-axis distortions of the spatial profile of a point source. A simple task, specpsf, is provided for constructing model SSFs in the specres package. A number of PSFs (viz stellar images) are provided as input at specified wavelengths; these are sampled by a slit of specified size (relative to the PSFs) and the signal within a slit is integrated across the slit width as a function of offset position (cross-dispersion). The set of point sources are then spline-interpolated in the dispersion direction to provide the 2D spectrum of the point source, the SSF. For an observation with no accompanying SSF, a considerable amount of trial-and-error is required to choose the seeing of a set of model PSFs in order to provide a high quality restoration, and thus successful extraction of the SN spectrum. In the low signal-to-noise cases, it will be the major source of uncertainty in the SN spectrum (see Sect. 5.3). However, all methods that rely on provision of a PSF (in imaging) or an SSF (in spectroscopy) are subject to this difficulty; it usually provides the fundamental limit on the uncertainty of the restoration.
To successfully extract the point source spectrum from the extended background
component one needs in principle to know the width of the point-source
spatial profile at each dispersion coordinate - i.e. the FWHM-wavelength
relation for that object. In practice, however, we often cannot do this because of
poor S/N (this is especially the case in high-z SN Ia spectroscopy) and so
we rely on average quantities, such as the mean seeing during the observation.
One can then imagine reconstructing a more reliable description of the seeing
(![]() )
variation along the dispersion direction (
)
variation along the dispersion direction (![]() )
using for
instance the following seeing-wavelength relation (Schroeder 1987):
)
using for
instance the following seeing-wavelength relation (Schroeder 1987):
 |
(3) |
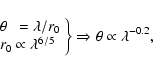
where r0 is the so-called Fried parameter, which describes the quality of a wave that has propagated through atmospheric turbulence (Fried 1965,1975).
However, a specific telescope and
instrument combination can introduce systematic errors due to instrumental
spatial distortions which are not taken into account in the above relation.
Figure 1 shows that one should not rely on measurements by external
seeing monitors on observatory sites - such as the Differential Image Motion
Monitor (DIMM) on the ESO-Paranal site, which measures the image quality via a
differential centroiding method (Sandrock et al. 2000; Sarazin & Roddier 1990). Although
precise, these measurements are inadequate for our purpose since the DIMM
probes a region of sky significantly different from that where the telescope
is pointing (see Patat 2003, Fig. 17). Moreover the optical train is
different and the observation wavelength is restricted to 5000 Å. Even
varying the exponent in the above seeing-wavelength relation does not make it possible
to accurately reproduce the FWHM profile of a bright standard star (Fig. 1). We will see in Sect. 5.3 that errors of
![]() 15% in the determination of the FWHM of the point source can lead
to significant errors in the restored point source flux. One possible
alternative is to construct a synthetic SSF based on the
wavelength-dependent FWHM characteristics of the point source spectrum to
be extracted. This has the prime advantage of extracting the point source with a
PSF spectrum that has been subject to the same seeing variations. To
do so one can either use the SN spectrum itself or carefully align the slit to
include a bright single star as well as the object of interest.
15% in the determination of the FWHM of the point source can lead
to significant errors in the restored point source flux. One possible
alternative is to construct a synthetic SSF based on the
wavelength-dependent FWHM characteristics of the point source spectrum to
be extracted. This has the prime advantage of extracting the point source with a
PSF spectrum that has been subject to the same seeing variations. To
do so one can either use the SN spectrum itself or carefully align the slit to
include a bright single star as well as the object of interest.
![\begin{figure}
\par\resizebox{8.5cm}{!}{\includegraphics[width=10cm]{2009fig1.ps}} \end{figure}](/articles/aa/full/2005/08/aa2009/img38.gif) |
Figure 1:
Top panel: FWHM of the cross-dispersion profile of
the standard star LTT 7987 taken with VLT+FORS1 on UT 11 October 2002. The
single data point with an error bar shows the mean seeing as measured by the
DIMM station - namely
|
| Open with DEXTER | |
The IRAF-implemented code specpsf is illustrated in Fig. 2. A standard star is used to determine the corresponding
FWHM-wavelength relation, from which Gaussian PSF images are generated every
50 Å. The resulting stellar images are run through specpsf and the
profile of the corresponding output PSF spectrum (or SSF) is compared with
that of the input standard star. The errors fall below 0.1% over the whole
wavelength range. We also show a polynomial fit to the data, since in practice
the scatter is significantly larger for low S/N point sources, and such a fit
to the data is more representative of the actual seeing variations in the
dispersion direction. Here the residuals are as high as ![]() 2% in the red
region of the spectrum (mainly due to an increase of sky brightness in this
spectral range), still an order of magnitude below the lower threshold where
errors on the FWHM start to matter (see below).
2% in the red
region of the spectrum (mainly due to an increase of sky brightness in this
spectral range), still an order of magnitude below the lower threshold where
errors on the FWHM start to matter (see below).
![\begin{figure}
\par\resizebox{8.5cm}{!}{\includegraphics[width=10cm]{2009fig2.ps}} \end{figure}](/articles/aa/full/2005/08/aa2009/img39.gif) |
Figure 2: Illustration of SSF synthesis using specpsf. The input spectrum is the same as in Fig. 1. Top panel: FWHM of LTT 7987 (open squares) and of the synthetic SSF (filled triangles). The dashed line shows a polynomial fit to the synthetic SSF. Lower panel: residual plots of the FWHM of the synthesized SSF (open squares) and polynomial fit to the synthetic SSF (filled circles) with respect to the input SSF. |
| Open with DEXTER | |
The astronomer wishing to extract point source spectra using specinholucy has various options for the SSF. In low S/N cases like the ones we describe in this paper the choice of the SSF is by far the most limiting factor and will have a severe impact on the quality of the restoration.
We illustrate the impact of the SSF choice on the restoration of SN 2002go, a Type Ia supernova at z=0.236 (IAUC 7994) slightly offset from the center of its host galaxy (see also Sect. 6). We consider three options for the SSF: (1) a synthetic SSF based on FWHM measurements of SN 2002go itself; (2) a PSF star that happened by chance to be on the same slit as SN 2002go; and (3) a VLT+FORS1 standard star for which the FWHM-wavelength relation was the closest we could find to that of SN 2002go. The resulting cross-dispersion profiles are shown in Fig. 3, and the corresponding mean seeing values are shown in Table 1. Note that the quoted mean values are not representative of the wavelength-dependent nature of the seeing, and one should produce plots such as those shown in Fig. 3 to appreciate the differences between the SSFs. Despite having been observed on the same location of the CCD chip, the SN and the standard star were not observed on the same night and were thus subject to different seeing conditions. The difference is also a function of wavelength, hinting at possible instrumental effects on the spatial profile. These same comments apply to standard stars having been observed on the same night as the object of interest, and we discourage the potential user of this method from using standard stars for the SSF.
![\begin{figure}
\par\resizebox{8.5cm}{!}{\includegraphics[width=10cm]{2009fig3.ps}} \end{figure}](/articles/aa/full/2005/08/aa2009/img40.gif) |
Figure 3: Examples of SSFs used to extract SN 2002go: (1) the supernova itself; (2) a bright PSF star that happened to be on the same slit; (3) the closest FORS1 standard star to match the supernova profile. Top panel: the dashed line is a polynomial fit to the SN profile, from which low S/N points affected by the increase in sky background have been excluded. Lower panel: fractional differences in the SSF FWHM with respect to the polynomial fit. |
| Open with DEXTER | |
Table 1: SSF FWHM data.
More interesting, perhaps, are the quasi-systematic differences in
the profiles of the SN and the PSF star that was accidentally placed
on the same slit. The SN and PSF star should be subject to identical
seeing variations, but the reconstructed profiles differ by as much as
![]() 30%, or 0.2
30%, or 0.2
![]() .
There could be several reasons for this: (a) the
observation is not made at the parallactic angle, and so the dispersion
direction is not along the slit; (b) the star spectrum is located at a
different location on the CCD chip where the spatial distortion differs; (c)
the star is not centred on the slit and we are not measuring its true PSF
profile. FORS1 is equipped with a longitudinal atmospheric dispersion
compensator (LADC)
which has an accuracy
.
There could be several reasons for this: (a) the
observation is not made at the parallactic angle, and so the dispersion
direction is not along the slit; (b) the star spectrum is located at a
different location on the CCD chip where the spatial distortion differs; (c)
the star is not centred on the slit and we are not measuring its true PSF
profile. FORS1 is equipped with a longitudinal atmospheric dispersion
compensator (LADC)
which has an accuracy ![]()
![]() (0.5 pix) over the considered
wavelength
range (Avila et al. 1997), and so (a) should not be relevant. FORS1 is linear at
the <0.4% level (see the FORS1+2 User Manual
(0.5 pix) over the considered
wavelength
range (Avila et al. 1997), and so (a) should not be relevant. FORS1 is linear at
the <0.4% level (see the FORS1+2 User Manual![]() ) and distortions associated
with the instrument's optics should not affect the
whole spectral range at this level, so (b) should not matter either. This
leaves (c) as the probable explanation for this difference, which is
significant enough to be a major source of error in the restoration.
) and distortions associated
with the instrument's optics should not affect the
whole spectral range at this level, so (b) should not matter either. This
leaves (c) as the probable explanation for this difference, which is
significant enough to be a major source of error in the restoration.
The impact of these various SSFs on the restored SN flux is shown in Fig. 4. We view the solid curve as the most accurate restoration,
and one sees that using the other two (wider) SSFs means we are also restoring
part of the extended background component (sky and host galaxy) in the point
source spectrum. In the case of the star that was by chance located on the
same slit the
![]() 20% difference in the FWHM results in an error in the restored SN
flux that can be as high as 100-150%! We see from
the two inlays in Fig. 4 that the slope of the
pseudo-continuum around strong SN Ia spectral features (Ca II H&K and Si II)
changes significantly due to contamination of the underlying background
spectrum, and so the very definition of "line strength'' in this case is very
ambiguous. The fact that the FWHM of the point source varies with wavelength
will cause variable contributions of the background to the restored spectrum,
and will affect the determination of line ratios of distantly spaced lines,
if the PSF vector is not determined properly.
Thus, the extraction has a significant impact on empirical correlations based
on such measurements, as the errors made at this stage will add to those
associated with the subsequent calibration in flux. Examples of such
correlations are given in Nugent et al. (1995) and are used to determine
distances to SNe Ia in Riess et al. (1998b).
20% difference in the FWHM results in an error in the restored SN
flux that can be as high as 100-150%! We see from
the two inlays in Fig. 4 that the slope of the
pseudo-continuum around strong SN Ia spectral features (Ca II H&K and Si II)
changes significantly due to contamination of the underlying background
spectrum, and so the very definition of "line strength'' in this case is very
ambiguous. The fact that the FWHM of the point source varies with wavelength
will cause variable contributions of the background to the restored spectrum,
and will affect the determination of line ratios of distantly spaced lines,
if the PSF vector is not determined properly.
Thus, the extraction has a significant impact on empirical correlations based
on such measurements, as the errors made at this stage will add to those
associated with the subsequent calibration in flux. Examples of such
correlations are given in Nugent et al. (1995) and are used to determine
distances to SNe Ia in Riess et al. (1998b).
One might ask how one can decide which SSF to choose to restore a particular point source spectrum and if it is possible to a posteriori tell whether the chosen SSF was indeed the appropriate one. Indeed, through restoring the complete 2D background spectrum specinholucy enables us to check the accuracy of the restoration at each pixel of the input 2D frame, or simply in the spatial (cross-dispersion) direction by comparing the collapsed spatial profiles of the input and restored 2D spectra. This is illustrated using real data in Fig. 12.
![\begin{figure}
\par\resizebox{8.5cm}{!}{\includegraphics[width=10cm]{2009fig4.ps}} \end{figure}](/articles/aa/full/2005/08/aa2009/img50.gif) |
Figure 4: Impact of the SSF on the restored point source spectrum of SN 2002go. Refer to Fig. 3 for the meaning of the line annotations (1), (2) and (3), noting that (1) corresponds to the polynomial fit to the SN 2002go profile. The two inlays zoom in on the blueshifted Ca II H&K and Si II features, both prominent in SN Ia spectra, and highlight the impact of non-optimal spectral extractions on empirical correlations involving line strengths (see text). |
| Open with DEXTER | |
The choice of the width of the resolution kernel for the background resides
with the user. It is implemented as a Gaussian of user-chosen sigma
![]() in the specinholucy code. It is difficult to
give a general guide to its choice. Obviously it should be wider than the
equivalent maximum Gaussian sigma of the SSF
in the specinholucy code. It is difficult to
give a general guide to its choice. Obviously it should be wider than the
equivalent maximum Gaussian sigma of the SSF
![]() in the
cross-dispersion direction.
The sigma of the kernel has to be tuned and is strongly dependent
on the nature of the
extended source and more specifically on the extended background component in
the vicinity of the point source.
Comparison of the restored background with the input spectrum will
quickly show if narrow features in the extended background, above the noise,
have failed to be modelled through choice of too wide a kernel width (see Fig. 5, left column). If the kernel width is too narrow then the point
source will be partially modelled as a peak in the background channel and the
fluxes in our restored point source spectrum will be underestimated (Fig. 5, right column). The optimal width for the spatial resolution
kernel corresponds to a compromise between the lower spatial frequency of the
extended background cross-dispersion profile and the higher spatial frequency
of the point source cross-dispersion profile. A decent first guess would be
in the
cross-dispersion direction.
The sigma of the kernel has to be tuned and is strongly dependent
on the nature of the
extended source and more specifically on the extended background component in
the vicinity of the point source.
Comparison of the restored background with the input spectrum will
quickly show if narrow features in the extended background, above the noise,
have failed to be modelled through choice of too wide a kernel width (see Fig. 5, left column). If the kernel width is too narrow then the point
source will be partially modelled as a peak in the background channel and the
fluxes in our restored point source spectrum will be underestimated (Fig. 5, right column). The optimal width for the spatial resolution
kernel corresponds to a compromise between the lower spatial frequency of the
extended background cross-dispersion profile and the higher spatial frequency
of the point source cross-dispersion profile. A decent first guess would be
![]() -
-
![]() .
In Fig. 5 (middle column) we have used
.
In Fig. 5 (middle column) we have used
![]() .
From Fig. 5 we further note that, if one
can clearly see the impact of a wide kernel on the spatial residuals
.
From Fig. 5 we further note that, if one
can clearly see the impact of a wide kernel on the spatial residuals
![]() ,
discriminating between the narrow and optimal kernel
widths - respectively 1.5 and 3.8 - is not obvious a priori. The
optimal kernel width in Fig. 5 was chosen such as to maximise the
counts in the point source channel, or
,
discriminating between the narrow and optimal kernel
widths - respectively 1.5 and 3.8 - is not obvious a priori. The
optimal kernel width in Fig. 5 was chosen such as to maximise the
counts in the point source channel, or
![]() ,
whilst keeping the
spatial residuals
,
whilst keeping the
spatial residuals
![]() below the statistical noise limit of
the input 2D frame.
below the statistical noise limit of
the input 2D frame.
![\begin{figure}
\par\resizebox{8.5cm}{!}{\includegraphics[width=10cm]{2009fig5.ps}} \end{figure}](/articles/aa/full/2005/08/aa2009/img57.gif) |
Figure 5:
Impact of the width of the spatial resolution kernel
|
| Open with DEXTER | |
One important test is to ensure we are not capable of restoring a PSF-like
spectrum from a pure extended source. This is particularly relevant to
high-z SN Ia spectroscopy since in many cases one is only able to extract a
spectrum of the supernova host galaxy whereas one is convinced of having
obtained a combined spectrum including the SN. Then the currently widespread
technique of subtracting a galaxy template from this "combined'' (and noisy)
spectrum can sometimes reveal SN-like features where no supernova is present!
This is illustrated later on in Sect. 7.3 where we compare the
specinholucy output with that of a statistical algorithm
(
![]() -fit) which decomposes a 1D spectrum into its SN and galaxy
components using a galaxy spectral template (see also Fig. 14).
-fit) which decomposes a 1D spectrum into its SN and galaxy
components using a galaxy spectral template (see also Fig. 14).
Here we have used the uncontaminated galaxy spectrum of the host of SN 2002bo (see Sect. 6), obtained by constructing a mirror image of the portion of the galaxy profile devoid of supernova signal. We try to extract a point source component from this pure galaxy spectrum at different locations of the galaxy trace, including the centroid, using for this purpose three different SSFs of widths corresponding to the mean and extrema of the seeing values measured by the DIMM station for this observation. We then compare the restored point source flux with the statistical noise limit of the input 2D spectrum at the position of the point source. Should this ratio fall below one this means that no point source was detected. We see from Fig. 6 that in all cases the restored spectrum is inconsistent with that of a PSF-like object over the whole spectral range.
![\begin{figure}
\par\resizebox{8.5cm}{!}{\includegraphics[width=10cm]{2009fig6.ps}} \end{figure}](/articles/aa/full/2005/08/aa2009/img59.gif) |
Figure 6: Restored point source spectra in units of the statistical noise of the input pure galaxy spectrum. The different plots correspond to different positions of the point source to extract, marked by a filled square in the galaxy spatial profiles shown in the right column. The different lines correspond to different seeing conditions. The horizontal dashed line marks the limit below which no point source was detected in the background. Note the change of scale in the lower plot, where no flux at all is restored in many bandpasses. The peak above the dashed line in the uppermost plot is due to bad cosmic ray removal. |
| Open with DEXTER | |
In this section we present tests of the algorithm on simulated data, namely 2D
spectra of a Type Ia supernova (SN Ia) at z=0.5 embedded in a late-type
galaxy. We have chosen to reproduce a situation where a one hour-long exposure
is taken at the ESO Very Large Telescope VLT-UT1 (8.2 m) using the FOcal
Reducer Spectrograph (FORS1) in Long-Slit Spectroscopy (LSS) mode. The grism
corresponds to 300V, and the slit width is 1
![]() .
The reason behind chosing
these specific settings is that they correspond to those used for the real
data on which the algorithm will be tested further in Sect. 6. In
what follows we assume a
.
The reason behind chosing
these specific settings is that they correspond to those used for the real
data on which the algorithm will be tested further in Sect. 6. In
what follows we assume a
![]() cosmology (where
cosmology (where
![]() is the
dimensionless Hubble constant), and so the luminosity distance corresponding
to z=0.5 is
is the
dimensionless Hubble constant), and so the luminosity distance corresponding
to z=0.5 is
![]() Gpc. The factors used to scale down
the fluxes as the SN and galaxy are artificially redshifted to z=0.5 are
listed in Table 2. The additional factor of (1+z) comes from
the fact that we are integrating the flux over a finite bandpass, where the
wavelength axis has been diluted by that same factor.
Gpc. The factors used to scale down
the fluxes as the SN and galaxy are artificially redshifted to z=0.5 are
listed in Table 2. The additional factor of (1+z) comes from
the fact that we are integrating the flux over a finite bandpass, where the
wavelength axis has been diluted by that same factor.
Table 2: Distances and flux scaling.
The simulated 2D spectra are a combination of a 2D supernova spectrum and a 2D background spectrum, itself consisting of a galaxy and a sky spectrum. We vary the phase of the SN, i.e. the brightness and the input spectrum, and its position within the galaxy from 0.75 to 1.75, in units of FWHM of the galaxy trace. Random poisson noise is added to the image using the gain and read noise characteristics of FORS1 so as to degrade the overall S/N of the image and thereby reproduce plausible observing conditions.
The 2D supernova spectra are synthesized using the 1D, flux-calibrated spectra
of the Type Ia supernova SN 1994D in NGC 4526 (cz=448 km s-1) as
obtained from the SUSPECT
database![]() . Where spectral
coverage at a given phase was lacking (i.e. at -6 d, +0 d, +6 d, +8 d and
+14 d), approximate synthetic spectra were obtained from the two observed
spectra closest in phase using the UBVRI photometry published in
Patat et al. (1996). The same technique was applied to observed spectra whose
wavelength range did not extend below 3650 Å in the blue
(at -8 d and +10 d), so as to make sure to cover the Ca II H&K
(3934 Å, 3968 Å) absorption trough blueshifted to
. Where spectral
coverage at a given phase was lacking (i.e. at -6 d, +0 d, +6 d, +8 d and
+14 d), approximate synthetic spectra were obtained from the two observed
spectra closest in phase using the UBVRI photometry published in
Patat et al. (1996). The same technique was applied to observed spectra whose
wavelength range did not extend below 3650 Å in the blue
(at -8 d and +10 d), so as to make sure to cover the Ca II H&K
(3934 Å, 3968 Å) absorption trough blueshifted to ![]() 3750 Å, prominent
in SNe Ia optical spectra (see Filippenko 1997 for a review).
Each spectrum is then redshifted to z=0.5 and rebinned to the pixel scale
of FORS1 equipped with a 300V grism and a 1
3750 Å, prominent
in SNe Ia optical spectra (see Filippenko 1997 for a review).
Each spectrum is then redshifted to z=0.5 and rebinned to the pixel scale
of FORS1 equipped with a 300V grism and a 1
![]() slit
(
slit
(![]() 2.66 Å pix-1). The flux (in units of erg s-1 cm-2 Å-1) is scaled down to take into account the change in luminosity
distance as the source is artificially placed at z=0.5 - assuming SN 1994D
to be at the same distance as its host galaxy - and is converted to counts
(ADU) using a FORS1 sensitivity function. At this stage we have a 1D supernova
spectrum in ADUs as a function of wavelength, corresponding to a one-hour
integration on FORS1. Finally, a 2D supernova spectrum is synthesized by
replicating this 1D spectrum along the lines of a 2D image array (i.e. along
the dispersion axis) and multiplying each image column by a 1D Gaussian
profile normalised to unity of FWHM corresponding to 1
2.66 Å pix-1). The flux (in units of erg s-1 cm-2 Å-1) is scaled down to take into account the change in luminosity
distance as the source is artificially placed at z=0.5 - assuming SN 1994D
to be at the same distance as its host galaxy - and is converted to counts
(ADU) using a FORS1 sensitivity function. At this stage we have a 1D supernova
spectrum in ADUs as a function of wavelength, corresponding to a one-hour
integration on FORS1. Finally, a 2D supernova spectrum is synthesized by
replicating this 1D spectrum along the lines of a 2D image array (i.e. along
the dispersion axis) and multiplying each image column by a 1D Gaussian
profile normalised to unity of FWHM corresponding to 1
![]() seeing. Note
that the flux vector is normalised to an airmass of 1, and no scaling was
applied to account for observations (usually) made at higher airmasses.
seeing. Note
that the flux vector is normalised to an airmass of 1, and no scaling was
applied to account for observations (usually) made at higher airmasses.
The supernova data used in this simulation are summarised in Table 3. The quoted R-band magnitudes are only approximate and are affected by systematic effects because of the lack of any k-correction. For comparison the mean number of counts (in ADUs) per pixel is 105.7 and 19.8 for galaxy and sky (including sky lines), respectively.
Table 3: SN 1994D data used in the simulation.
For the galaxy spectrum we choose to artificially place SN 1994D in NGC 6181, an SC galaxy part of Kennicutt's spectrophotometric atlas of galaxies (Kennicutt 1992) . The reason behind this is the prominent [O II] emission at 3727 Å present in its spectrum (see Fig. 7), which could then serve as an diagnostic tool for probing the efficiency of our algorithm in restoring a clean point source spectrum. If successful, the restored 1D spectrum of the point source should be devoid of [O II] flux residuals.
![\begin{figure}
\par\resizebox{8.5cm}{!}{\includegraphics[width=10cm]{2009fig7.ps}} \end{figure}](/articles/aa/full/2005/08/aa2009/img70.gif) |
Figure 7: Absolute flux-calibrated galaxy and sky spectra used in the simulation. The spectra are shown in observed wavelength at z=0.5, and without shot noise for sake of clarity. The prominent [O II] emission and the Ca II H&K absorption in NGC 6181 are labelled accordingly. Overplotted (dashed lines) are the spectra of SN 1994D at maximum intensity (top) and ten days before maximum (bottom). |
| Open with DEXTER | |
The spectrum of NGC 6181 was redshifted to z=0.5 and rebinned to the pixel
scale of FORS1 using the same procedure as for the supernova spectrum. The
flux was scaled down to take into account the change in luminosity distance, and
converted to counts (again in ADUs) using the same sensitivity function as for
the supernova. The resulting galaxy has a magnitude
![]() in
a redshifted B-band filter (very roughly corresponding to the R-band at
z=0.5) i.e. more than an order of magnitude brighter than when the supernova
is at its faintest (see Table 3).
in
a redshifted B-band filter (very roughly corresponding to the R-band at
z=0.5) i.e. more than an order of magnitude brighter than when the supernova
is at its faintest (see Table 3).
Next, a galaxy spatial luminosity profile was constructed based on a standard
bulge+disk model. The bulge component is usually described analytically
using the so-called r1/4 law and the disk component follows an
exponential decline with distance r from the nucleus
(de Vaucouleurs 1959; Freeman 1970). One can derive a global analytical form of
the surface brightness profile
![]() of spiral galaxies, as a function
of the effective radius
of spiral galaxies, as a function
of the effective radius ![]() of the bulge only. In doing so we assume a
bulge-to-total luminosity ratio B/T = 0.4 (Ratnatunga et al. 1999) and a ratio
between the effective radii of the bulge and disk components
of the bulge only. In doing so we assume a
bulge-to-total luminosity ratio B/T = 0.4 (Ratnatunga et al. 1999) and a ratio
between the effective radii of the bulge and disk components
![]() (Ratnatunga et al. 1999; Kent 1985):
(Ratnatunga et al. 1999; Kent 1985):
| |
= | ||
| = | ![$\displaystyle 0.76931\ \Sigma_{\rm S,e} \exp \left(-7.6692 \left[
\left({\frac{1.6617r}{r_{\rm e}}}\right)^{1/4} - 1\right]\right)$](/articles/aa/full/2005/08/aa2009/img76.gif) |
||
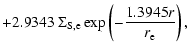 |
(4) |
The angular size of NGC 6181 is 2.5![]()
![]() 1.1
1.1![]() (NASA/IPAC
Extragalactic Database
(NASA/IPAC
Extragalactic Database![]() ), which
corresponds to
), which
corresponds to
![]() at z=0.5, and in turn to
at z=0.5, and in turn to
![]() pixels on a FORS1 image. Assuming the slit was placed along
the major axis of NGC 6181 the effective radius of the
disk
pixels on a FORS1 image. Assuming the slit was placed along
the major axis of NGC 6181 the effective radius of the
disk ![]() is 22.5 pixels. The derived luminosity profile is then normalised
to unity and is multiplied into each column of the 2D galaxy image array. Each
column is further convolved with a Gaussian profile of FWHM corresponding to
1
is 22.5 pixels. The derived luminosity profile is then normalised
to unity and is multiplied into each column of the 2D galaxy image array. Each
column is further convolved with a Gaussian profile of FWHM corresponding to
1
![]() seeing to reproduce similar observing conditions as for the
supernova. The resulting spatial profile
seeing to reproduce similar observing conditions as for the
supernova. The resulting spatial profile
![]() is shown in Fig. 8. Notice how at these redshifts the core spatial profile of
galaxies is entirely seeing-dominated, and one must rely on the broad extended
wings of the profile to differentiate between a galaxy and a point source.
is shown in Fig. 8. Notice how at these redshifts the core spatial profile of
galaxies is entirely seeing-dominated, and one must rely on the broad extended
wings of the profile to differentiate between a galaxy and a point source.
![\begin{figure}
\par\resizebox{8.5cm}{!}{\includegraphics[width=10cm]{2009fig8.ps}} \end{figure}](/articles/aa/full/2005/08/aa2009/img86.gif) |
Figure 8:
Smoothed galaxy spatial profile used in the simulation,
resulting from the convolution of a standard spiral galaxy luminosity profile
and a 1
|
| Open with DEXTER | |
The sky 2D spectrum (the second background component for ground-based
observations) is generated by uniformly replicating an observed 1D sky
spectrum with the required settings (300V grism, 1
![]() slit) along lines
of an image array, and scaled to the required exposure time (3600 s in our
case). It is thus by construction perfectly flat and monochromatic in the
spatial direction. We do not have to worry about spatial distortions of sky
lines, and sky background removal in the input 2D spectrum is rendered trivial.
slit) along lines
of an image array, and scaled to the required exposure time (3600 s in our
case). It is thus by construction perfectly flat and monochromatic in the
spatial direction. We do not have to worry about spatial distortions of sky
lines, and sky background removal in the input 2D spectrum is rendered trivial.
We now move on to outlining the steps made in carrying out the simulation. Far from being redundant these are the same steps that one should in principle go through when applying this technique to real data. They include determining the position (and slope) of the supernova spectral trace, its FWHM as a function of wavelength, synthesizing a corresponding SSF and running the specinholucy code with the optimal settings. For the purpose of this simulation and for ease in computing statistics these steps have been made automatic, though we strongly advise to make them highly interactive when dealing with real data.
One of the inputs to the specinholucy routine is a position table containing the (x,y, slope pix-1) of the supernova spectral trace. Since in the case of high-z SNe Ia we are limited in S/N we cannot simply give an approximate position and rely on cross-correlations with the SSF to determine a more accurate one. Here we must input the exact SN trace position to which the SSF profiles will be shifted. The results of our simulation (see Sect. 5.3) show the impact of positional accuracy on the point source restoration.
To some extent one should base the method used to determine the trace position
on the characteristics of the instrument used for the observation. In the
case of FORS1 we know from observations of standard stars that the position of
a point source does not vary by more than one pixel across the whole CCD
chip. Thus, a ![]() 1 pix accuracy can almost routinely be achieved by
summing up each of the spatial channels and finding the maximum intensity
(other than the galaxy) in a given cross-dispersion region. Clearly this will
be problematic for cases where the SN is close to the centroid of the galaxy
trace or when its phase is far from maximum (-10 d or +14 d). Alternatively
one can try to fit the background around the SN trace and subtract this fit
from the overall profile. The residuals can then be fit with a Gaussian
profile and the trace position is taken to be the profile centre.
1 pix accuracy can almost routinely be achieved by
summing up each of the spatial channels and finding the maximum intensity
(other than the galaxy) in a given cross-dispersion region. Clearly this will
be problematic for cases where the SN is close to the centroid of the galaxy
trace or when its phase is far from maximum (-10 d or +14 d). Alternatively
one can try to fit the background around the SN trace and subtract this fit
from the overall profile. The residuals can then be fit with a Gaussian
profile and the trace position is taken to be the profile centre.
The result of this operation is a relation between SN trace position and dispersion coordinate x, which is fit linearly so as to determine the trace position and slope. We now have our input (x,y, slope pix-1) table necessary to run specinholucy. A plot of the error made in determining the trace position using this approach is shown in Fig. 9. The position is best determined when the signal-to-noise ratio is high, namely when the contrast is high between the SN and the underlying background, as expected.
![\begin{figure}
\par\resizebox{8.5cm}{!}{\includegraphics[width=10cm]{2009fig9.ps}} \end{figure}](/articles/aa/full/2005/08/aa2009/img87.gif) |
Figure 9:
SN trace position residuals as a function of the SN phase, for
different locations of the SN with respect to the galaxy centroid. Each curve
corresponds to a specific SN position, given in units of FWHM
|
| Open with DEXTER | |
To construct a synthetic SSF we need to know the FWHM of the SN trace as a
function of the dispersion coordinate. We proceed in a way analogous to
determining the SN trace position, except we are now interested in the width
of the Gaussian fit to the residual signal left over after sky and galaxy
subtraction rather than the Gaussian centre. A similar relation between
FWHM![]() and dispersion coordinate is established and a table of
(FWHM
and dispersion coordinate is established and a table of
(FWHM![]() ,
wavelength) values is elaborated and serves as input for
the SSF synthesis using specpsf. A plot of the error made in
determining the trace FWHM using this approach is shown in Fig. 10.
Again, the FWHM is better determined for cases with a higher SN flux relative
to the galaxy background.
,
wavelength) values is elaborated and serves as input for
the SSF synthesis using specpsf. A plot of the error made in
determining the trace FWHM using this approach is shown in Fig. 10.
Again, the FWHM is better determined for cases with a higher SN flux relative
to the galaxy background.
![\begin{figure}
\par\resizebox{8.5cm}{!}{\includegraphics[width=10cm]{2009fg10.ps}} \end{figure}](/articles/aa/full/2005/08/aa2009/img89.gif) |
Figure 10: SN trace FWHM residuals as a function of the SN phase, for different locations of the SN with respect to the galaxy centroid. The curves and plotting symbols have the same meaning as in Fig. 9. |
| Open with DEXTER | |
Once we have determined the position (and slope) of the SN trace and synthesized an SSF spectrum using its FWHM-wavelength dependency, we can run specinholucy on the input sky-subtracted 2D spectrum. We refer the reader to Lucy & Walsh (2003) and to the IRAF help pages for the specinholucy task for a more complete description of the input parameters. A centroid fitting is used to determine the SSF peak at each column, and no subsampling (in the spatial direction) is performed since the resulting PSF profile is not oversampled with respect to the input 2D spectrum. A cubic spline is used as the interpolation method to shift the SSF to the position of the point source - which is defined exactly in the input position table. Note that no input statistical image to determine the statistical error at each pixel is used in these simulations.
The only input parameter made to vary from one run to the other is the width
![]() of the Gaussian used for the spatial resolution kernel.
We see from Fig. 8 that the galaxy spatial profile is entirely
seeing-dominated, meaning that the widths of the SN and galaxy traces are
comparable at each wavelength. This in turn implies that the spatial frequency
of the galaxy profile will vary hugely when varying the SN position from
0.75 to 1.75 FWHM
of the Gaussian used for the spatial resolution kernel.
We see from Fig. 8 that the galaxy spatial profile is entirely
seeing-dominated, meaning that the widths of the SN and galaxy traces are
comparable at each wavelength. This in turn implies that the spatial frequency
of the galaxy profile will vary hugely when varying the SN position from
0.75 to 1.75 FWHM
![]() .
To avoid confusion in the point/extended source
discrimination we must use a narrow (wide) spatial resolution kernel when
the SN is close to (far from) the galaxy centroid, where the spatial frequency
is high (low).The input values for the smoothing kernel were chosen such as
to minimise the mean flux residuals in restoring all phases of the SN spectrum
at a given position. For all runs the convergence criteria for the SN and
background spectra per R-L iteration (see Sect. 2) were set to
0.1% and 1%, respectively.
.
To avoid confusion in the point/extended source
discrimination we must use a narrow (wide) spatial resolution kernel when
the SN is close to (far from) the galaxy centroid, where the spatial frequency
is high (low).The input values for the smoothing kernel were chosen such as
to minimise the mean flux residuals in restoring all phases of the SN spectrum
at a given position. For all runs the convergence criteria for the SN and
background spectra per R-L iteration (see Sect. 2) were set to
0.1% and 1%, respectively.
Two runs (A and B) were executed: in run A we use the SN position and FWHM as determined using the method outlined in Sects. 5.2.1 and 5.2.2, whilst in run B we use the known values of the SN trace position and FWHM to synthesize the SSF and restore the SN spectrum. This enables us to investigate the joint impact of the errors in the SN position and FWHM on the accuracy of the SN spectral restoration (see Sect. 5.3).
To evaluate the efficiency of the method we compare the (known) input SN spectrum with its restored version. More specifically we compute the ratio of the flux residuals with the statistical variation in the input 2D spectrum. Should this ratio fall below one this means that we are statistical noise-limited and cannot improve on the restoration.
In this simulation we compare the flux residuals both over the whole observed
spectral range (5500 Å-8500 Å) and around the region of host galaxy
[O II] 3727 Å emission. This region is simply defined in wavelength space
(in Å) as
![]() ,
where
FWHM
,
where
FWHM
![]() is the width of the [O II] line in the input
non-redshifted spectrum of NGC 6181 and z=0.5 is the redshift of the
simulation. For both cases the flux residual
is the width of the [O II] line in the input
non-redshifted spectrum of NGC 6181 and z=0.5 is the redshift of the
simulation. For both cases the flux residual ![]() is evaluated at each
pixel according to:
is evaluated at each
pixel according to:
 |
(5) |
where
![]() and
and
![]() are the input and restored SN fluxes,
respectively.
are the input and restored SN fluxes,
respectively.
![]() and
and
![]() are the galaxy and sky
fluxes at the location of the SN, defined as an interval centred on the exact
SN trace position and of width the FWHM of the SN trace. It is important to
compute the statistical noise as that in the total signal at the
position of the supernova (i.e. including the underlying background) and not
just in the SN signal itself. If
are the galaxy and sky
fluxes at the location of the SN, defined as an interval centred on the exact
SN trace position and of width the FWHM of the SN trace. It is important to
compute the statistical noise as that in the total signal at the
position of the supernova (i.e. including the underlying background) and not
just in the SN signal itself. If
![]() one can in principle
consider the SN restoration to have converged.
one can in principle
consider the SN restoration to have converged.
The simulation results are summarised in Fig. 11. Both runs A and B (see Sect. 5.2.3) are shown in order to evaluate the impact of the error made in the determination of the SN trace position and FWHM on the restoration of the supernova spectrum.
![\begin{figure}
\par\includegraphics[width=14cm]{2009fg11.ps} \end{figure}](/articles/aa/full/2005/08/aa2009/img97.gif) |
Figure 11:
Top panel: flux residuals |
| Open with DEXTER | |
These plots clearly show that the limiting factor of this two-channel
restoration technique (as for any other spectral extraction method) is the
contrast between the point source and the underlying background. The overall
flux is systematically restored to the statistical noise limit when the
supernova is at its brightest stages
(
![]() ), irrespective of its
position with respect to the centroid of the galaxy trace. In this phase
regime the error in the SN trace position and FWHM is also at its lowest
(see Figs. 9 and 10) and has little impact on the
quality of the restoration - as shown by the dashed lines in Fig. 11. This is not always the case for the [O II] flux residuals,
where the added background noise due to the presence of this emission line
affects the restoration (cf. at positions 0.75 and 1.00, in units of
FWHM
), irrespective of its
position with respect to the centroid of the galaxy trace. In this phase
regime the error in the SN trace position and FWHM is also at its lowest
(see Figs. 9 and 10) and has little impact on the
quality of the restoration - as shown by the dashed lines in Fig. 11. This is not always the case for the [O II] flux residuals,
where the added background noise due to the presence of this emission line
affects the restoration (cf. at positions 0.75 and 1.00, in units of
FWHM
![]() ).
).
One sees the dramatic impact of the error made in the SN trace position and
FWHM at low S/N, namely when the SN is outside the
![]() range and close to the
centroid of the galaxy (at positions of 0.75, 1.00 and 1.25). For errors in
the position
range and close to the
centroid of the galaxy (at positions of 0.75, 1.00 and 1.25). For errors in
the position ![]() 0.3 pix and FWHM
0.3 pix and FWHM
![]() ,
the
restoration fails to reach the statistical noise limit. These are the main
sources of systematic error in the restoration method and great care should be
taken when determining the SN trace position and FWHM when applying it to
real data.
,
the
restoration fails to reach the statistical noise limit. These are the main
sources of systematic error in the restoration method and great care should be
taken when determining the SN trace position and FWHM when applying it to
real data.
In this Sect. we apply this restoration technique to real supernova data.
An outline of the steps involved (determination of the SN trace position and
FWHM; SSF synthesis; running of specinholucy) has already been given
in Sect. 5.2. We simply provide the input parameters that were
used to run the code (see Table 4). All the data were
collected by the authors via the ESO observing programme 170.A-0519 and are
available through the ESO Science Archive
Facility![]() . The observations were made with
VLT+FORS1 in Long Slit Spectroscopy (LSS) mode with a 300V grism and a
1
. The observations were made with
VLT+FORS1 in Long Slit Spectroscopy (LSS) mode with a 300V grism and a
1
![]() slit. The results of the two-channel restoration are shown in Figs. 12 and 13, whilst the individual objects are
presented in Table 5. On average
slit. The results of the two-channel restoration are shown in Figs. 12 and 13, whilst the individual objects are
presented in Table 5. On average ![]() 150 iterations were
needed to reach convergence for the restoration of the point source spectra,
corresponding to
150 iterations were
needed to reach convergence for the restoration of the point source spectra,
corresponding to ![]() 2 min on a 2.4 GHz Pentium 4 processor.
2 min on a 2.4 GHz Pentium 4 processor.
There is one important distinction to be made in the calculation of the flux
residuals here as opposed to that made for the simulation in Sect. 5.2.4. For observed cases we do not know how the total flux
![]() separates into the individual components
separates into the individual components
![]() ,
,
![]() and
and
![]() ,
and so our evaluation of the accuracy of the
restoration is restricted to the calculation of the mean total flux
residuals
,
and so our evaluation of the accuracy of the
restoration is restricted to the calculation of the mean total flux
residuals
![]() :
:
 |
(6) |
Figure 12 illustrates what has been said about an
a posteriori check of the adequacy of both the SSF and the spatial
resolution kernel. In all cases we not only fit the SN trace but also the
underlying background such that the flux residuals
![]() .
For the case of SN 2002bo a secondary point
source (indicated by an arrow) in its vicinity had to be included in the input
position table - and hence allocated to the point source channel - for the
restoration to succeed.
.
For the case of SN 2002bo a secondary point
source (indicated by an arrow) in its vicinity had to be included in the input
position table - and hence allocated to the point source channel - for the
restoration to succeed.
Figure 13 on the other hand shows the flux residuals in the
dispersion direction, and one can immediately appreciate the successful
allocation of (extended) atmospheric absorption features and sky emission
lines to the background channel. Moreover one can immediately pick out the
spectral regions affected by systematic errors in the restoration
(
![]() )
and only use those where
)
and only use those where
![]() for analysis. The (spectral) residuals in this
case were evaluated in the dispersion direction by evaluating the
spatial residuals in a region centred on the SN position and of extent
for analysis. The (spectral) residuals in this
case were evaluated in the dispersion direction by evaluating the
spatial residuals in a region centred on the SN position and of extent
![]() .
This ensures that we are only including the point source
and its immediately underlying background.
.
This ensures that we are only including the point source
and its immediately underlying background.
Table 4: Specinholucy parameters.
Table 5: Supernova observation summary.
![\begin{figure}
\par\includegraphics[width=14cm]{2009fg12.ps} \end{figure}](/articles/aa/full/2005/08/aa2009/img111.gif) |
Figure 12:
Top panel: normalised average spatial profiles of the
input (dashed line) and restored (solid line) 2D background spectra. Two runs
of specinholucy were executed, one including the point source in the
restored 2D background spectrum and the other excluding it, so as to
appreciate how well the background underneath the SN was fit.
Lower panel: wavelength-averaged spatial residuals in units of
the statistical noise of the input 2D spectrum. For all cases we have
|
| Open with DEXTER | |
![\begin{figure}
\par\includegraphics[width=15cm]{2009fg13.ps}\end{figure}](/articles/aa/full/2005/08/aa2009/img112.gif) |
Figure 13:
Top panel: normalised restored point source spectra
(solid line) and underlying background, both including (dashed line) and
excluding (dotted line) the point source. The spectra have been normalised to
the integral of the underlying background flux. The symbol |
| Open with DEXTER | |
We choose to compare our method with alternative techniques, namely a standard extraction using IRAF, an iterative Gaussian extractor and a statistical decomposition of a 1D flux-calibrated spectrum into SN and galaxy contributions. The reason for including the latter (1D) approach is to highlight the need for the SN-galaxy separation to occur at the earliest stages of the reduction process, and not as part of a post-processing chain of data analysis. The results are summarised in Fig. 14. Note that algorithms similar to ours do exist (though unlike ours they are not publicly available), and should these be of interest to the reader we refer him/her to Lucy & Walsh (2003), Sect. 6.
![\begin{figure}
\par\includegraphics[width=15cm]{2009fg14.ps} \end{figure}](/articles/aa/full/2005/08/aa2009/img114.gif) |
Figure 14:
Top panel: restored supernova spectra using
specinholucy (solid line) and other methods presented in Sect. 7. The spectra are normalised to the maximum flux value of the
specinholucy output. Due to the specificities of
|
| Open with DEXTER | |
For most purposes IRAF and similar reduction software are sufficient for extracting a high S/N supernova spectral trace. The extraction can be further optimised by e.g. tracing the point source signal along the dispersion direction or variance-weighting the output flux. However, the hold on systematic errors is null and one tends to evaluate the resulting spectrum on purely qualitative grounds. In the case of high-z SN Ia spectroscopy the extraction of the SN spectrum is often considered successful when the cross-correlation with a local SN Ia template spectrum is maximal. This clearly bypasses the specificity of the high-z spectrum and affects the search for systematic spectral differences between high-z SN Ia spectra and their local counterparts.
Of equal concern is the arbitrary definition of the SN "background'' in IRAF.
One specifies a set of spatial coordinates in the vicinity of the SN trace to
be fit by some user-defined polynomial ... and essentially hopes for the
best! In particular one has to find a compromise between the varying width of
the SN cross-dispersion profile (i.e. its FWHM-wavelength relation) and the
varying structure of the underlying background. Cases such as that encountered
for SN 2002bo - namely the contamination of the close SN background by a
secondary point source - are extremely delicate to handle in a coherent way
with standard spectral reduction packages and lead in this case to
![]() 40% errors in the SN flux. Other errors in the extraction using
IRAF are due to the varying spectrum of the underlying background, to strong
sky emission lines and to the overall increase in sky noise at long
wavelengths. The extracted spectrum of SN 2002go for instance is clearly
affected by sky residuals, and more specifically the Si II feature (6355 Å)
blueshifted to
40% errors in the SN flux. Other errors in the extraction using
IRAF are due to the varying spectrum of the underlying background, to strong
sky emission lines and to the overall increase in sky noise at long
wavelengths. The extracted spectrum of SN 2002go for instance is clearly
affected by sky residuals, and more specifically the Si II feature (6355 Å)
blueshifted to ![]() 6150 Å and characteristic of Type Ia supernovae lies in
the same region as the atmospheric A-band at z=0.236, and is clearly
contaminated by it. Any measure of line strengths and ratios in this region
will thus also be affected, leading to significant errors in empirical
correlations based on such measurements, e.g. the "Nugent relation'' (see
Nugent et al. 1995; and Sect. 3.3 in this paper). In cases where
the signal-to-noise ratio is low (cf. SN 2002gr) there is obvious
contamination from the underlying background in the SN spectrum, leading to
significant errors; in fact, in many bandpasses no SN flux is output at all,
where specinholucy is able to restore the SN contribution over the
whole wavelength range.
6150 Å and characteristic of Type Ia supernovae lies in
the same region as the atmospheric A-band at z=0.236, and is clearly
contaminated by it. Any measure of line strengths and ratios in this region
will thus also be affected, leading to significant errors in empirical
correlations based on such measurements, e.g. the "Nugent relation'' (see
Nugent et al. 1995; and Sect. 3.3 in this paper). In cases where
the signal-to-noise ratio is low (cf. SN 2002gr) there is obvious
contamination from the underlying background in the SN spectrum, leading to
significant errors; in fact, in many bandpasses no SN flux is output at all,
where specinholucy is able to restore the SN contribution over the
whole wavelength range.
In applying specinholucy to the restoration of supernova spectra we need to degrade the resolution of the background channel to discriminate between the SN and its underlying background. To illustrate the advantages of using a two-channel restoration we have written a software (gaussextract) that iteratively extracts the point source spectrum using the same synthetic SSF as for the specinholucy run. As in specinholucy, each dispersion channel is treated independently and the process is iterated till some minimal fractional change in the restored SN flux is achieved. For the sake of comparison with specinholucy, gaussextract runs the same convergence criteria for the point source flux. The difference here is that the SN and underlying background are jointly extracted in the same channel, leading to significant contamination by sky lines and host galaxy in the output SN spectrum (cf. SN 2002bo in Fig.14).
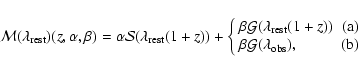
![]() -fit is a software package developed by Grégory Sainton
(see Sainton 2004) to rapidly identify the supernova
type and redshift in the SuperNova Legacy Survey (SNLS). The goal is to
quickly identify
candidates from their spectrum, for which the SN phase
and the fraction of host galaxy light can be estimated. The algorithm is
based on a
-fit is a software package developed by Grégory Sainton
(see Sainton 2004) to rapidly identify the supernova
type and redshift in the SuperNova Legacy Survey (SNLS). The goal is to
quickly identify
candidates from their spectrum, for which the SN phase
and the fraction of host galaxy light can be estimated. The algorithm is
based on a ![]() fitting of the observed (and reduced) 1D
spectrum to known template spectra. More specifically the observed
spectrum is compared with a model made of a fraction
fitting of the observed (and reduced) 1D
spectrum to known template spectra. More specifically the observed
spectrum is compared with a model made of a fraction ![]() of SN
(
of SN
(
![]() )
and a fraction
)
and a fraction ![]() of galaxy (
of galaxy (
![]() ). The
following model spectra
). The
following model spectra
![]() are built :
are built :
 |
(7) |
It should be noted that, contrary to the other methods presented in this
section,
![]() -fit is a post-processing tool and thus cannot
be required to correct for systematic errors made in the reduction process
(most likely using standard software packages such as IRAF or
MIDAS
-fit is a post-processing tool and thus cannot
be required to correct for systematic errors made in the reduction process
(most likely using standard software packages such as IRAF or
MIDAS![]() ), such as improper
removal of sky lines. These errors will propagate in the
), such as improper
removal of sky lines. These errors will propagate in the
![]() -fit
result, as seen in the output spectrum of SN 2002go where the Si II feature is
also affected by the atmospheric A-band. SN 2002gr on the other hand
illustrates the limits of using a
-fit
result, as seen in the output spectrum of SN 2002go where the Si II feature is
also affected by the atmospheric A-band. SN 2002gr on the other hand
illustrates the limits of using a ![]() minimisation technique to separate
the SN from the underlying background in low signal-to-noise cases.
minimisation technique to separate
the SN from the underlying background in low signal-to-noise cases.
The advantages of this purely statistical approach is that no a priori assumption is made about the underlying background. The host galaxy contamination is removed using a galaxy template or better still the SN host galaxy itself. The determination of the supernova type and redshift is greatly improved upon and the enhanced accuracy of this approach is discussed in Sainton (2004). The disadvantage is that we are limited by the database of local SNe, and any spectral peculiarities will not be independently accounted for, if they are not reproduced in local SN spectra. Also, the fact that in both cases we use the observed SN host galaxy itself as a template to decompose the extracted SN trace into a supernova and a galaxy component - case (b) in the above system of equations - illustrates what we were implying in Sect. 4 about the propagation of supernova "features'' in the final SN spectrum through the inherent imperfections of the galaxy template removal approach.
We have presented the advantages of using a more elaborate spectral extraction algorithm for obtaining supernova spectra devoid of background contamination, and hence make possible a truly quantitative analysis of high-z Type Ia supernova spectra. This will allow us in the future to set constraints on potential evolutionary effects that could affect SNe Ia as function of redshift. Not only are we able to extract the PSF-like components of an input spectrum, we can also restore the entire 2D spectrum and hence get a hold on systematic errors linked with the restoration process. We thus have a quantitative way of judging whether the extracted SN spectrum is optimal for subsequent analysis and whether we are not mistakenly "seeing'' SN-like features in a pure galaxy spectrum, as is sometimes the case in low S/N high-z SN Ia spectra.
However, there are some caveats mainly associated to the complexity of specinholucy. Errors associated with the use of an inappropriate SSF for restoring the point-source channel or a mis-evaluation of the width of the spatial resolution kernel necessary for the point-source/extended background discrimination will strongly affect the restoration (see Sect. 3). Through restoration of the 2D background spectrum one is however able to produce diagnostic plots to critically evaluate the error in each case and repeat the restoration with different settings (see Fig. 5).
Note that a valuable by-product of this novel technique is the acquisition of
a host galaxy spectrum with no contamination from the supernova flux! Galaxies
at
![]() are at most a few arcseconds in size and one can essentially
obtain integrated spectra of high-z SN host galaxies by centering a slit on
both the SN and its host. This in turn makes it possible to study of properties of
high-z SN Ia host galaxies and compare them with integrated spectra of local
SN Ia hosts (Sullivan et al. 2003; Ghallager & Garnavich 2004; Williams et al. 2003).
are at most a few arcseconds in size and one can essentially
obtain integrated spectra of high-z SN host galaxies by centering a slit on
both the SN and its host. This in turn makes it possible to study of properties of
high-z SN Ia host galaxies and compare them with integrated spectra of local
SN Ia hosts (Sullivan et al. 2003; Ghallager & Garnavich 2004; Williams et al. 2003).
Thus, specinholucy provides the high-z supernova community with a reliable tool to obtain clean SN Ia spectra and in turn to derive accurate physical quantities associated with the ejecta. Two of the authors (Stéphane Blondin and Bruno Leibundgut) are part of the ESSENCE project, and Grégory Sainton is part of the SNLS collaboration. Both teams recognise the need for a quantitative analysis of their results in order to constrain potential systematic effects that could distort the cosmological results derived from observations of high-z SNe Ia. We have shown specinholucy to be the ideal tool for this purpose. In fact, the VLT data taken for the ESSENCE project will be shown in their restored form via specinholucy in Matheson et al. (2005).
Acknowledgements
Many thanks to John Moustakas for providing the zero-point for the spectrum of NGC 6181 and to Mattia Vaccari for deriving the galaxy luminosity profile used in the simulation. We further would like to thank the anonymous referee for many detailed and useful comments on the original manuscript.