Because some features are hardly detectable by eye in an image, we
often transform it before display. Histogram equalization is
one the most well-known methods for contrast enhancement.
Such an approach is generally useful for images
with a poor intensity distribution. Since edges play a fundamental
role in image understanding, a way to enhance the contrast is to
enhance the edges. For example, we can add to the original image its Laplacian
(
![]() ,
where
,
where ![]() is a parameter). Only
features at the finest scale are enhanced (linearly). For a high
is a parameter). Only
features at the finest scale are enhanced (linearly). For a high
![]() value, only the high frequencies are visible.
value, only the high frequencies are visible.
Since the curvelet transform is well-adapted to represent images containing edges,
it is a good candidate for edge enhancement. Curvelet coefficients
can be modified in order to enhance edges in an image.
The idea is to not modify curvelet coefficients
which are either at the noise level, in order to not amplify the noise,
or larger than a given threshold. Largest coefficients corresponds to
strong edges which do not need to be amplified. Therefore, only curvelets
coefficients with an absolute value in
![]() are modified,
where
are modified,
where
![]() and
and
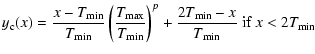
![]() must be fixed. We define the
following function
must be fixed. We define the
following function ![]() which modifies the values of the curvelet coefficients:
which modifies the values of the curvelet coefficients:
The curvelet enhancement method consists of the following steps:
![\begin{figure}
\par\includegraphics[width=6.5cm,clip]{fig_sat512.ps}\hspace*{1mm...
...ce*{1mm}
\includegraphics[width=6.5cm,clip]{fig_sat_contrast_cur.ps}\end{figure}](/articles/aa/full/2003/05/aa2574/img92.gif) |
Figure 9: Top, Saturn image and its histogram equalization. Bottom, Saturn image enhancement the Laplacian method and by the curvelet transform. |
Figure 9 shows respectively a part of the Saturn image, the histogram equalized image, the Laplacian enhanced image and the curvelet multiscale edge enhanced image (parameters were p=0.5, c=3, and l=0.5). The curvelet multiscale edge enhanced image shows clearly better the rings and edges of Saturn.
Copyright ESO 2003
![\begin{figure}
\par\includegraphics[width=8.8cm,clip]{fig_velde_mod.ps}\end{figure}](/articles/aa/full/2003/05/aa2574/img85.gif)