In this section we describe some of the results of the optically
thick radiation driven winds of some test models. We discuss
the properties of the models and investigate the dependence of the
resulting mass-loss rates on the input parameters. We do this for
the models calculated in Variant A0 (constant L(r)) and variant
B0 (power-law dependence of ![]() ). These tests are useful for
describing and understanding the models, and for comparing the
results for different parameters.
). These tests are useful for
describing and understanding the models, and for comparing the
results for different parameters.
For the stellar parameters of the test model we have chosen the
values of a characteristic WN 5 star: WR139. This star is a member of
a well studied binary system and its distance and stellar parameters
are well determined (Nugis et al. 1998; Nugis & Lamers
2000). The
adopted parameters are discussed below in Sect. 6 and
listed in Table 4. The luminosity is
![]()
![]() ,
the observed mass-loss rate is
,
the observed mass-loss rate is
![]()
![]() and the terminal velocity of the wind
is 1785 km s-1. The adopted radius of the sonic point is
and the terminal velocity of the wind
is 1785 km s-1. The adopted radius of the sonic point is
![]() .
This is much smaller than the empirically
determined "core''-radius of the star,
.
This is much smaller than the empirically
determined "core''-radius of the star,
![]()
![]() ,
derived
from the empirical wind models with an adopted
,
derived
from the empirical wind models with an adopted ![]() law by
Hamann & Schwarz (1992). The reason for this smaller choice will
be justified below in Sect. 6.
Note that for the final set of optically thick wind models (Variants
A1 and B1) we will determine the sonic point radius from the demand
that
law by
Hamann & Schwarz (1992). The reason for this smaller choice will
be justified below in Sect. 6.
Note that for the final set of optically thick wind models (Variants
A1 and B1) we will determine the sonic point radius from the demand
that
![]() is equal to the OPAL value for the particular density,
temperature and chemical composition.
is equal to the OPAL value for the particular density,
temperature and chemical composition.
Here we describe the results of a set of models that were calculated
with a fixed, pre-specified mass-loss rate. For these models ![]() is
fixed and the effective optical depth at the sonic point is a parameter
that has to be solved.
The results of the test models are listed in Table 1.
The first part gives the results of Variant B0, i.e. for a power-law
opacity of the type
is
fixed and the effective optical depth at the sonic point is a parameter
that has to be solved.
The results of the test models are listed in Table 1.
The first part gives the results of Variant B0, i.e. for a power-law
opacity of the type
![]() ,
for various values of n.
The last line gives the results for Variant A0, i.e. with a fixed
value of L(r). We discuss some properties of the models.
,
for various values of n.
The last line gives the results for Variant A0, i.e. with a fixed
value of L(r). We discuss some properties of the models.
| n |
|
|
|
|
|
|
|||
| 105K | 10-14 cm g-1 |
|
10-4 | 10-4 | cm2 g-1 | ||||
| (1) | (2) | (3) | (4) | (5) | (6) | (7) | (8) | (9) | (10) |
| 3.01 | 21.2 | 1.809 | 2.34 | 34.75 | 1.01 | -0.233 | 101 | 0.756 | 5.09 |
| 3.10 | 20.7 | 1.799 | 3.72 | 34.65 | 1.18 | -2.829 | 98.6 | 0.756 | 5.00 |
| 3.30 | 19.8 | 1.781 | 6.97 | 34.48 | 1.54 | -7.128 | 94.3 | 0.756 | 4.95 |
| 3.50 | 19.2 | 1.768 | 10.45 | 34.35 | 1.88 | -10.21 | 91.25 | 0.755 | 5.03 |
| 4.00 | 18.2 | 1.746 | 20.20 | 34.14 | 2.68 | -15.23 | 86.25 | 0.755 | 5.85 |
| 4.50 | 17.6 | 1.732 | 31.36 | 34.00 | 3.44 | -18.30 | 83.21 | 0.755 | 10.0 |
| 4.70 | 17.5 | 1.727 | 36.19 | 33.96 | 3.74 | -19.20 | 82.25 | 0.755 | 80.0 |
| - | 22.6 | 1.837 | 1.45 | 35.02 | 0.805 | +7.013 | 108.5 | 0.757 | 5.92 |
The value of the optical depth
![]() at the sonic point is similar
for all models. This was already predicted in the
previous section where we showed that the gravity force and the
radiative force should cancel each other at the sonic point
(Eqs. (39) and (40)). All models show that the
temperature at the sonic point is about
at the sonic point is similar
for all models. This was already predicted in the
previous section where we showed that the gravity force and the
radiative force should cancel each other at the sonic point
(Eqs. (39) and (40)). All models show that the
temperature at the sonic point is about
![]() K. The value
of
K. The value
of
![]() needed to reach this temperature is about 20. The high
sonic temperature is needed because the mass-loss rate is basically
determined by the energy conservation at the sonic point. The velocity
gradient implies a gain in potential
and kinetic energy that has to be provided under the constraint of
constant total energy. For the pre-chosen mass-loss rate this can only
be achieved at high temperature, and hence at high effective optical
depth.
The optical depth of order 20 at the sonic point, with the
given mass-loss rate and terminal velocity, requires a high column
density above the sonic point, which implies a high value of the
velocity law exponent
needed to reach this temperature is about 20. The high
sonic temperature is needed because the mass-loss rate is basically
determined by the energy conservation at the sonic point. The velocity
gradient implies a gain in potential
and kinetic energy that has to be provided under the constraint of
constant total energy. For the pre-chosen mass-loss rate this can only
be achieved at high temperature, and hence at high effective optical
depth.
The optical depth of order 20 at the sonic point, with the
given mass-loss rate and terminal velocity, requires a high column
density above the sonic point, which implies a high value of the
velocity law exponent ![]() of about 5 in the supersonic part of the
wind for most models.
The models with high values of
of about 5 in the supersonic part of the
wind for most models.
The models with high values of ![]() require a larger value of
require a larger value of
![]() because the opacity drops steeply outwards and so
the density
because the opacity drops steeply outwards and so
the density
![]() has to drop slowly outwards,
implying a high value of
has to drop slowly outwards,
implying a high value of ![]() .
In fact there is an upper limit for the opacity exponent nin our models. If
.
In fact there is an upper limit for the opacity exponent nin our models. If ![]() the opacity decreases so rapidly
outwards that the required value of
the opacity decreases so rapidly
outwards that the required value of
![]() cannot be
reached by any
cannot be
reached by any ![]() -type velocity law. The slowest velocity law
with
-type velocity law. The slowest velocity law
with
![]() still has a density decrease of
still has a density decrease of
![]() and so the maximum column density above the sonic
point is
and so the maximum column density above the sonic
point is
![]() .
We also found that there is a lower limit for the exponent n of the
opacity law that can produce optically thick radiation driven wind
models. If n < 3 then the opacity does not increase through
the sonic point, so the wind cannot be accelerated through the
sonic point. We conclude that optically thick radiation driven
winds for WR-stars with an opacity of the type
.
We also found that there is a lower limit for the exponent n of the
opacity law that can produce optically thick radiation driven wind
models. If n < 3 then the opacity does not increase through
the sonic point, so the wind cannot be accelerated through the
sonic point. We conclude that optically thick radiation driven
winds for WR-stars with an opacity of the type
![]() near the sonic point can only exist for a
small range of n of approximately 3 < n < 5.
near the sonic point can only exist for a
small range of n of approximately 3 < n < 5.
The data in Table 1 show that
the radiative luminosity in the comoving frame is very close to the
total luminosity L*. The difference is less than about a factor
10-2. This justifies our assumption that in the calculation of
the radiative acceleration (Eq. (17)) we can substitute L*for L(r). Note that in models with variant B0 the value of
![]() ,
that is calculated from the energy Eq. (19) is larger
than the value of
,
that is calculated from the energy Eq. (19) is larger
than the value of ![]() ,
but less than L*.
In the case of Variant A0, which has a constant L(r), the comoving
luminosity is slightly smaller than
,
but less than L*.
In the case of Variant A0, which has a constant L(r), the comoving
luminosity is slightly smaller than ![]() but again the difference
is very small.
It is interesting to compare the advected luminosity
with the difference between
but again the difference
is very small.
It is interesting to compare the advected luminosity
with the difference between ![]() and
and
![]() .
We see that in
all these models the advective luminosity is much larger than this
difference. So at the critical point, the energy
balance (Eq. (19)) is practically reduced to
.
We see that in
all these models the advective luminosity is much larger than this
difference. So at the critical point, the energy
balance (Eq. (19)) is practically reduced to
![]() .
(This property was already used to derive
an estimate for mass-loss rate in Eq. (44).)
.
(This property was already used to derive
an estimate for mass-loss rate in Eq. (44).)
For this set of test models
we have solved the full set of equations described
above, for calculating the mass-loss rate of optically thick radiation
driven wind models. In these calculations the mass-loss rate is
determined basically from the predicted velocity gradient near the
sonic point which is required by the sonic point conditions.
The velocity gradient implies a potential and kinetic energy gain
that has to be provided under the constraint of constant total energy.
Table 2 gives the results for Variant B0, i.e.
with an opacity-law of the form
![]() for n=3.5 and
with fixed
for n=3.5 and
with fixed
![]() .
In this case we have adopted a pre-chosen set of values for
.
In this case we have adopted a pre-chosen set of values for
![]() and we derive the mass-loss rate.
and we derive the mass-loss rate.
|
|
|||
|
|
105 K | ||
| 2.0 | 0.098 | 1.074 | 2.89 |
| 3.0 | 0.140 | 1.163 | 3.32 |
| 5.0 | 0.228 | 1.296 | 3.87 |
| 10.0 | 0.462 | 1.516 | 4.56 |
| 20.0 | 0.960 | 1.784 | 5.05 |
| 30.0 | 1.477 | 1.964 | 5.25 |
| 50.0 | 2.531 | 2.214 | 5.38 |
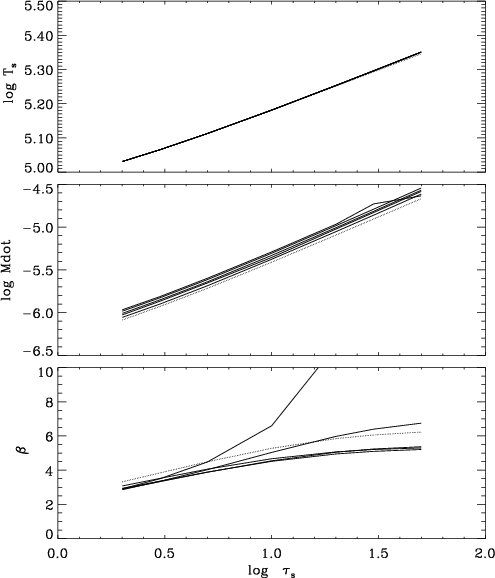
Figure 1 shows the mass-loss rates and the values of ![]() for a series of test models for WR139, for different values of n.
We see that the mass-loss rate scales almost linearly with the adopted
value of
for a series of test models for WR139, for different values of n.
We see that the mass-loss rate scales almost linearly with the adopted
value of
![]() as it is expected according to the approximate
formula (46). The mass-loss rates are not very sensitive
to the values of n.
as it is expected according to the approximate
formula (46). The mass-loss rates are not very sensitive
to the values of n.
In this section we study the influence of the sonic radius on
the mass-loss rates of WR-stars. We also investigate the influence of
the choices for determining ![]() (Variants A0 or B0) on the
mass-loss rates, predicted for the models.
Table 3 gives the results for a series of test models for
WR139, for various values of the ratio
(Variants A0 or B0) on the
mass-loss rates, predicted for the models.
Table 3 gives the results for a series of test models for
WR139, for various values of the ratio
![]() and for
different values of
and for
different values of
![]() .
We give the results for both variants
(A0 and B0). The values of the sonic point temperature
.
We give the results for both variants
(A0 and B0). The values of the sonic point temperature ![]() are
slightly different for Variants A0 and B0. However, this difference
is so small, less than a factor 10-3, that we only listed the
values of
are
slightly different for Variants A0 and B0. However, this difference
is so small, less than a factor 10-3, that we only listed the
values of ![]() for variant A0.
We see that the results of the two variants are quite similar.
The difference in the mass-loss rates and in
for variant A0.
We see that the results of the two variants are quite similar.
The difference in the mass-loss rates and in ![]() is less than
about 25 percent, with mass-loss rates of Variant B0
being slightly higher than those of Variant A0. The values
of
is less than
about 25 percent, with mass-loss rates of Variant B0
being slightly higher than those of Variant A0. The values
of ![]() of Variant B0 are slightly smaller than those of
Variant A0.
This is because Variant B0 has higher mass-loss rates,
so a slightly steeper velocity law is needed to produce the same
value of
of Variant B0 are slightly smaller than those of
Variant A0.
This is because Variant B0 has higher mass-loss rates,
so a slightly steeper velocity law is needed to produce the same
value of
![]() .
The mass-loss rates increase with increasing adopted location of the
sonic point. In the range of
.
The mass-loss rates increase with increasing adopted location of the
sonic point. In the range of
![]() the mass-loss rate
for a fixed value of
the mass-loss rate
for a fixed value of
![]() increases almost linearly with
increases almost linearly with
![]() .
This is in accord with the prediction of the approximate formula
(46).
.
This is in accord with the prediction of the approximate formula
(46).
|
|
|
|
|
|
|||
|
|
|
K | |||||
| A0 | A0 | B0 | A0 | B0 | |||
| 1.0 | 1.0 | 2.0 | 152 000 | 0.049 | 0.058 | 3.22 | 2.81 |
| 1.0 | 1.0 | 3.0 | 164 500 | 0.070 | 0.083 | 3.72 | 3.23 |
| 1.0 | 1.0 | 5.0 | 183 400 | 0.114 | 0.136 | 4.35 | 3.77 |
| 1.0 | 1.0 | 10.0 | 214 700 | 0.232 | 0.276 | 5.12 | 4.45 |
| 1.0 | 1.0 | 20.0 | 252 900 | 0.485 | 0.576 | 5.67 | 4.94 |
| 1.0 | 1.0 | 30.0 | 278 700 | 0.750 | 0.891 | 5.88 | 5.14 |
| 1.0 | 1.0 | 50.0 | 314 900 | 1.301 | 1.543 | 6.05 | 5.28 |
| 2.0 | 1.0 | 2.0 | 107 400 | 0.082 | 0.098 | 3.32 | 2.89 |
| 2.0 | 1.0 | 3.0 | 116 300 | 0.118 | 0.140 | 3.84 | 3.32 |
| 2.0 | 1.0 | 5.0 | 129 600 | 0.192 | 0.228 | 4.49 | 3.87 |
| 2.0 | 1.0 | 10.0 | 151 700 | 0.389 | 0.462 | 5.28 | 4.56 |
| 2.0 | 1.0 | 20.0 | 178 500 | 0.809 | 0.960 | 5.85 | 5.05 |
| 2.0 | 1.0 | 30.0 | 196 500 | 1.247 | 1.477 | 6.06 | 5.25 |
| 2.0 | 1.0 | 50.0 | 221 700 | 2.143 | 2.531 | 6.23 | 5.38 |
| 4.0 | 2.0 | 2.0 | 76 000 | 0.138 | 0.165 | 3.40 | 2.94 |
| 4.0 | 2.0 | 3.0 | 82 300 | 0.198 | 0.235 | 3.93 | 3.37 |
| 4.0 | 2.0 | 5.0 | 91 700 | 0.323 | 0.384 | 4.59 | 3.93 |
| 4.0 | 2.0 | 10.0 | 107 300 | 0.654 | 0.778 | 5.40 | 4.61 |
| 4.0 | 2.0 | 20.0 | 126 300 | 1.365 | 1.620 | 5.97 | 5.08 |
| 4.0 | 2.0 | 30.0 | 139 100 | 2.108 | 2.499 | 6.19 | 5.26 |
| 4.0 | 2.0 | 50.0 | 157 000 | 3.635 | 4.298 | 6.35 | 5.37 |
| 4.0 | 1.0 | 2.0 | 75 900 | 0.138 | 0.164 | 3.40 | 2.94 |
| 4.0 | 1.0 | 3.0 | 82 200 | 0.198 | 0.235 | 3.93 | 3.37 |
| 4.0 | 1.0 | 5.0 | 91 600 | 0.321 | 0.382 | 4.59 | 3.93 |
| 4.0 | 1.0 | 10.0 | 107 100 | 0.649 | 0.770 | 5.40 | 4.61 |
| 4.0 | 1.0 | 20.0 | 125 900 | 1.343 | 1.589 | 5.97 | 5.09 |
| 4.0 | 1.0 | 30.0 | 138 300 | 2.055 | 2.425 | 6.19 | 5.27 |
| 4.0 | 1.0 | 50.0 | 155 500 | 3.481 | 4.086 | 6.36 | 5.39 |
1 ![]() is in units of
is in units of
![]() .
.
We conclude from these tests that the mass-loss rates predicted by optically thick radiation driven wind models show the following properties:
| Star | Sp. Type |
|
|
Y | Z |
|
|||
| ( |
( |
( |
(10-5) | (km s-1) | |||||
| (
|
|||||||||
| 2 | WN 2b | 5.27 | 10.0 | 0.863 | 0.983 | 0.0172 | 0.40 | 3100 | 3.29 |
| 139 | WN 5+O 6V | 5.21 | 9.3 | 0.824 | 0.936 | 0.0172 | 0.92 | 1785 | 4.96 |
| 136 | WN 6b | 5.73 | 19.1 | 1.235 | 0.866 | 0.0173 | 6.25 | 1605 | 9.20 |
| 22 | WN 7+OB | 6.08 | 55.3 | 1.622 | 0.546 | 0.0176 | 4.20 | 1790 | 3.06 |
| 105 | WN 9 | 5.81 | 21.8 | 1.315 | 0.624 | 0.0176 | 2.80 | 1200 | 2.54 |
| 111 | WC 5 | 5.31 | 10.6 | 0.891 | 0.381 | 0.619 | 1.00 | 2415 | 5.82 |
| 42 | WC 7+O 7V | 5.23 | 9.5 | 0.837 | 0.497 | 0.503 | 1.28 | 1645 | 6.11 |
| 103 | WC 9 | 5.20 | 9.2 | 0.818 | 0.585 | 0.415 | 2.40 | 1190 | 8.75 |
Copyright ESO 2002