In order to apply more systematically the method proposed here, we may
ask whether the few cited cluster-lenses are representative of some
generic cluster or if they correspond to very peculiar configurations.
To answer this question, we simulated a typical cluster at redshift
z=0.2 with the following characteristics. A main clump is described
with the potential of Eq. (6), the so-called HK mass
density, with a=50 kpc and s=500 kpc. These values are typical of
cluster-lenses at this redshift (Smith et al. 2001). The central velocity
dispersion is varied from 800 to 1400 km s-1 to allow a variation
of the Einstein radius. In addition, 12 individual galaxies are added
in the mass distribution, following the prescription used by
Natarajan & Kneib (1996) and for a total contribution of 30% of the total
mass. Their individual masses are scaled with respect to their
luminosity Li by the Faber-Jackson relation:
 |
(19) |
 |
(20) |
To simulate the background sources, we used the Hubble Deep Field
(HDF) image acquired by the HST (Williams et al. 1996). From
Fernández-Soto et al. (1999), 946 galaxies were extracted from the deepest zone
of the F814W image, up to a magnitude limit
AB(8140)=28.0 and over
an angular area of 3.92 arcmin2. These authors also provide a
catalog of photometric redshifts for all these objects. In addition,
for about 10% of them, a spectroscopic redshift is available. We
used this redshift distribution (spectroscopic redshift preferably
used when available) as a sample of galaxy-sources to be lensed by the
simulated clusters. In order to increase the statistical significance of this
simulation, we generated a source catalogue with 10 times the number
of galaxies extracted from the HDF image.
We then distributed these sources at random angular positions over
the central inner
![]() arcsec2. We checked that this
region includes the external radial caustic line, so that no multiple
images are lost. The increase in the galaxy density
is then corrected for in the final results.
arcsec2. We checked that this
region includes the external radial caustic line, so that no multiple
images are lost. The increase in the galaxy density
is then corrected for in the final results.
|
|
(km s-1) | 800 | 1000 | 1200 | 1400 | |
|
|
(arcsec) | 5 | 14 | 28 | 40 | |
| 0 |
|
78 | 73 | 69 | 65 | |
| n0* | 0 | 0 | 0 | 0 | ||
| 1 |
|
107 | 107 | 99 | 66 | |
| n1* (3) | 29 | 34 | 34 | 26 | ||
| 2 | n2 | 0 | 0.068 | 0.14 | 0.10 | |
| n2* | 0.11 | 0.41 | 2.3 | 13 | ||
| 3 | n3 | 0.12 | 0.60 | 8.0 | 41 | |
| n3* | 0.034 | 0.068 | 1.7 | 3.9 | ||
| j | 4 | n4 | 0.034 | 0.011 | 0.034 | 0.057 |
| n4* | 0.011 | 0.011 | 0.034 | 0.011 | ||
| 5 | n5 | 0.022 | 0.011 | 0.11 | 0.011 | |
| n5* | 0.011 | 0 | 0 | 0.011 | ||
| 6 | n6 | 0.011 | 0 | 0 | 0.011 | |
| n6* | 0 | 0 | 0 | 0.011 | ||
| 7 | n7 | 0.011 | 0 | 0.011 | 0.011 | |
| n7* | 0 | 0.011 | 0 | 0 | ||
| 8 | n8 | 0 | 0.011 | 0 | 0 | |
| n8* | 0 | 0 | 0 | 0 | ||
| total | (j>2) |
|
0.18 | 0.70 | 8.3 | 41 |
|
|
0.17 | 0.50 | 4.0 | 17 | ||
| (1) Including 0.6 galaxies at |
|
| (2) Including 5.2 galaxies at |
|
| (3) Including 4.6 galaxies at |
Table 1 presents for each value of the central velocity
dispersion the number of systems found with their image multiplicity.
We also determined the number of systems in which each image could be
observed (with a magnitude
AB(8140)<24.5, corresponding to typical
HST integration time of 10 ksec). Objects with
AB(8140)>28.0 could be observed due to the lens effect
if the magnification exceeds a factor of 25. This
very rare configuration is neglected in our simulations for simplicity. For a
cluster massive enough (
![]() km s-1, corresponding
to
km s-1, corresponding
to
![]() for our potential model), numerous systems
of multiple images (mainly triple images) are formed and a significant
fraction could be observable. Although these simulations are quite
simple and cannot be used for realistic statistics of image formation,
it gives us confidence that the use of multiple image families for the
determination of the cosmological parameters is achievable and
should be applied on a large number of rich clusters.
for our potential model), numerous systems
of multiple images (mainly triple images) are formed and a significant
fraction could be observable. Although these simulations are quite
simple and cannot be used for realistic statistics of image formation,
it gives us confidence that the use of multiple image families for the
determination of the cosmological parameters is achievable and
should be applied on a large number of rich clusters.
Another popular density profile to be tested is the so-called Navarro,
Frenk & White (NFW) density profile found in many simulations of dark
matter and cluster formation (Navarro et al. 1997):
 |
(23) |
To create a simulated lens configuration we need to fix some arbitrary
values of the cosmological parameters
![]() ,
,
![]() as well as the cluster lens redshift
as well as the cluster lens redshift
![]() .
The numerical code LENSTOOL developed by one of us
(Kneib 1993) can then trace back the source of a given image or
determine the images of an elliptical source galaxy at a redshift
.
The numerical code LENSTOOL developed by one of us
(Kneib 1993) can then trace back the source of a given image or
determine the images of an elliptical source galaxy at a redshift
![]() .
The initial data are several sets of multiple images at
different redshifts. In all cases we do not take into account the
central de-magnified images, which are generally not detected. With
these observables, we can recover some parameters of the potential
while we scan a grid in the
.
The initial data are several sets of multiple images at
different redshifts. In all cases we do not take into account the
central de-magnified images, which are generally not detected. With
these observables, we can recover some parameters of the potential
while we scan a grid in the ![]() ,
,
![]() plane. The
likelihood of the result is obtained via a
plane. The
likelihood of the result is obtained via a ![]() -minimization (with
a parabolic or a Monte Carlo method), where
-minimization (with
a parabolic or a Monte Carlo method), where ![]() is computed in
the source plane as:
is computed in
the source plane as:
![]() computed from Eq. (24) in the source plane is
mathematically equivalent to
computed from Eq. (24) in the source plane is
mathematically equivalent to ![]() computed in the image plane,
written as:
computed in the image plane,
written as:
 |
(25) |
If ![]() is the number of fitted parameters for the potential, there
is a total of
is the number of fitted parameters for the potential, there
is a total of
![]() adjustable parameters (including
adjustable parameters (including ![]() and
and
![]() )
and
)
and ![]() independant data points. We compute a
independant data points. We compute a
![]() -distribution for
-distribution for
![]() degrees of freedom. In practice,
in our simulation we try to recover only the most important parameters,
like
degrees of freedom. In practice,
in our simulation we try to recover only the most important parameters,
like ![]() (or
(or
![]() ),
), ![]() or
or ![]() ,
to limit the
number of degrees of freedom. This would be the case in a real application.
,
to limit the
number of degrees of freedom. This would be the case in a real application.
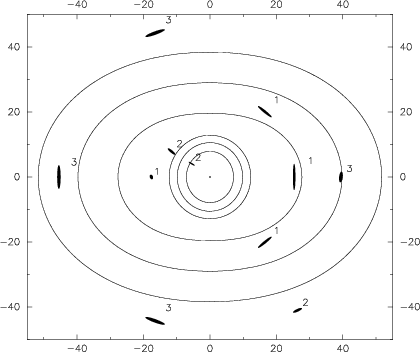
| Family | Type | ni | ||
| i=1 | Tangential | 4 | 0.6 | 6 |
| i=2 | Radial | 3 | 1. | 4 |
| i=3 | Tangential | 4 | 4. | 6 |
This preliminary step corresponds to the "ideal'' case where we
recover the same type of potential we used to generate the images.
Moreover, the morphology of the cluster is regular without
substructure, and we included one radial system among the families of
multiple images. These images are known to probe the
cluster core efficiently. Finally, the redshift distribution of the sources is
wide and the selected redshifts are well separated, for an optimal
sampling of the E-term. One could ask whether any such lens
configuration has already been detected among the known cluster
lenses. It seems that the case of MS2137.3-2353 (
![]() )
is quite
close to this type of configuration (Mellier et al. 1993) with at least 3
families of multiple images, including a radial one. Uunfortunately, no
spectroscopic redshift has been determined for any of the images so far.
)
is quite
close to this type of configuration (Mellier et al. 1993) with at least 3
families of multiple images, including a radial one. Uunfortunately, no
spectroscopic redshift has been determined for any of the images so far.
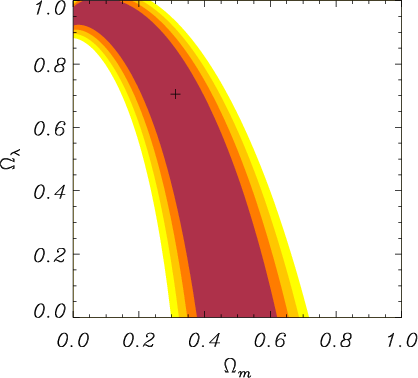 |
Figure 7:
|
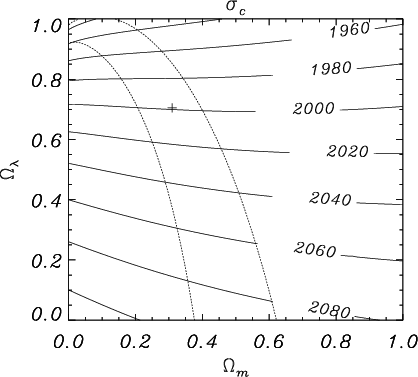 |
Figure 8:
Solid lines: distribution of the best-fit velocity dispersion
|
Although the reconstruction with a potential model different from the
initial "real'' one does not perfectly fit the data, the results are
quite satisfactory. The confidence levels are even tighter than in the
previous case, but the HK-type potential is characterised by one
additional parameter or equivalently one degree of freedom less (![]() ), compared to the pseudo-elliptical NFW profile. Nevertheless we
find a minimum reduced
), compared to the pseudo-elliptical NFW profile. Nevertheless we
find a minimum reduced ![]() rather far from 0.
rather far from 0.
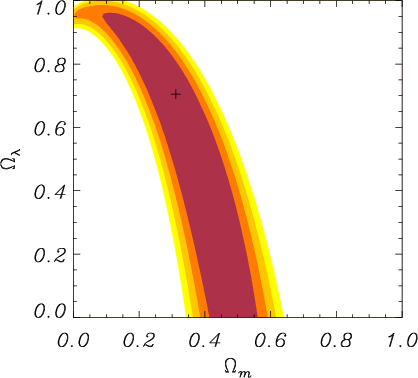 |
Figure 9:
|
Several other mass profiles were tested as we wanted to discriminate
between the different families of density profiles and test their
sensitivity in the estimate of the cosmological parameters after the
lens reconstruction. We used 5 types of profiles, namely:
i) the pseudo-elliptical NFW profile
(Golse & Kneib 2002),
ii) the singular isothermal ellipsoid (SIE) with
![]() ,
R being the elliptical coordinate (Eq. (21)),
,
R being the elliptical coordinate (Eq. (21)),
iii) the isothermal ellipsoid with core radius (CIE), obtained by
replacing R by
![]() in the previous expression
(see Kovner 1989),
in the previous expression
(see Kovner 1989),
iv) the HK profile (Eq. (6)),
v) and the King profile characterised by
 |
(26) |
| Input profile | HK | King | CIE | NFW | SIE |
| Fitted profile | |||||
| HK ( |
0. | 23. | 72. | 460. | 4500. |
| King ( |
33. | 0. | 33. | 150. | 1500. |
| CIE ( |
23. | 0.26 | 0. | 87. | 2800. |
| NFW ( |
6.2 | 21. | 18. | 0. | 680. |
| SIE ( |
0.14 | 0.011 | 0.28 | 76. | 0. |
| |
Figure 10:
|
In the preceding sections we considered 3 systems of multiple images. As
the method proposed is based on the difference of angular distance
ratios for different redshift planes, we now investigate the influence
of the number of image families. The potential model is again an
HK-type profile at
![]() with
with
![]() km s-1,
km s-1,
![]() (i.e. 65 kpc),
(i.e. 65 kpc),
![]() (i.e. 700 kpc) and
(i.e. 700 kpc) and
![]() .
With systems of images, we consider only 2
free parameters for the cluster, because there are not enough
observables to yield results for more parameters, while in the other
cases, 3 parameters are fitted. In all cases, these parameters are
strongly constrained by the fit. Table 4 reports the
errors on the fitted parameters in the optimisation process, for the different sets of multiple images detailed in Table 5.
The differences in the fitted parameters between the different cases
are small, as they are already well constrained with a single multiple images
system.
.
With systems of images, we consider only 2
free parameters for the cluster, because there are not enough
observables to yield results for more parameters, while in the other
cases, 3 parameters are fitted. In all cases, these parameters are
strongly constrained by the fit. Table 4 reports the
errors on the fitted parameters in the optimisation process, for the different sets of multiple images detailed in Table 5.
The differences in the fitted parameters between the different cases
are small, as they are already well constrained with a single multiple images
system.
| Nb of systems | |||
| 2 | 1400+60-60 | 13.5+0.25-0.15 | - |
| 3 | 1400+70-60 | 13.5+0.3-0.2 | 146+2-2 |
| 4 | 1400+60-60 | 13.5+0.3-0.2 | 146+14-6 |
The expected constraints on
![]() tighten when
the number of families of multiple images increases
(Fig. 10), especially when their redshift distribution is
wide. 2 families would only provide marginal information on the
cosmological parameters whereas 4 spectroscopically measured systems
would give very tight error bars, provided they are well
distributed in redshift.
tighten when
the number of families of multiple images increases
(Fig. 10), especially when their redshift distribution is
wide. 2 families would only provide marginal information on the
cosmological parameters whereas 4 spectroscopically measured systems
would give very tight error bars, provided they are well
distributed in redshift.
| Nb of systems | Family | Type | ni | ||
| 2 | i=1 | Tangential | 4 | 0.6 | 6 |
| i=2 | Radial | 3 | 1. | 4 | |
| i=1 | Tangential | 4 | 0.6 | 6 | |
| 3 | i=2 | Radial | 3 | 1. | 4 |
| i=3 | Tangential | 4 | 2. | 6 | |
| i=1 | Tangential | 4 | 0.6 | 6 | |
| 4 | i=2 | Radial | 3 | 1. | 4 |
| i=3 | Tangential | 4 | 2. | 6 | |
| i=4 | Radial | 3 | 4. | 4 |
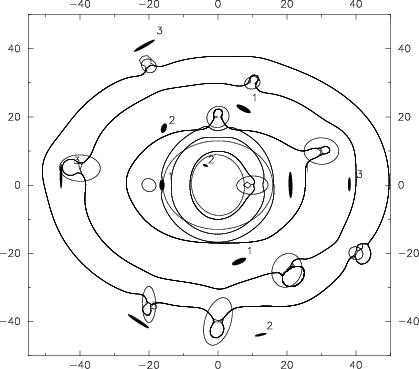 |
Figure 11:
Multiple images generated by a cluster at
|
The images were reconstructed using a main cluster potential with the
same kind of shape as the initial one and the contribution of the
galaxies scaled with
![]() .
In addition, we fixed
.
In addition, we fixed
![]() proportional to
proportional to ![]() to avoid an increase of the number of free
parameters. Consequently, any variation in
to avoid an increase of the number of free
parameters. Consequently, any variation in ![]() means a
rescaling of the total mass of the cluster. So at first order we find
that
means a
rescaling of the total mass of the cluster. So at first order we find
that
![]() is constant when we scan the
is constant when we scan the
![]() plane. Keeping the geometrical parameters
fixed (
plane. Keeping the geometrical parameters
fixed (
![]() ,
,
![]() ,
and
,
and
![]() ), we
obtain the confidence levels in the
), we
obtain the confidence levels in the
![]() plane
plotted in
Fig. 12
and the following constraints on the potential
parameters:
plane
plotted in
Fig. 12
and the following constraints on the potential
parameters:
![]() km s-1,
km s-1,
![]() and
and
![]() .
.
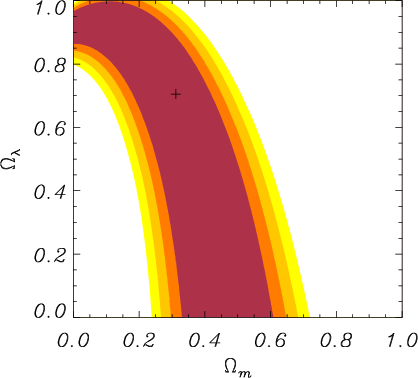 |
Figure 12:
|
To test the influence of the individual galaxies, we tried a
reconstruction without their contribution. For the geometrical
parameters first optimised we obtain
![]() ,
,
![]() ,
,
![]() and
and
![]() ,
still
close to the generating values. The confidence levels in the
,
still
close to the generating values. The confidence levels in the
![]() plane are plotted in Fig. 13.
The contours are slightly shifted and widened compared to the "good''
ones (Fig. 12) but not significantly different. The
minimum reduced
plane are plotted in Fig. 13.
The contours are slightly shifted and widened compared to the "good''
ones (Fig. 12) but not significantly different. The
minimum reduced ![]() is 17. So we are able to correctly retrieve
the cluster potential, even without the individual galaxies
(
is 17. So we are able to correctly retrieve
the cluster potential, even without the individual galaxies
(
![]() km s-1,
km s-1,
![]() and
and
![]() ). Adding their contribution is
nevertheless useful to determine precisely the minimum region and to
tighten the confidence levels. It becomes quite critical in more
complex cases or when a single galaxy strongly perturbs the location
of an image.
). Adding their contribution is
nevertheless useful to determine precisely the minimum region and to
tighten the confidence levels. It becomes quite critical in more
complex cases or when a single galaxy strongly perturbs the location
of an image.
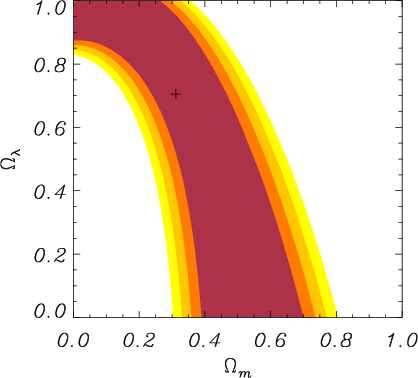 |
Figure 13:
|
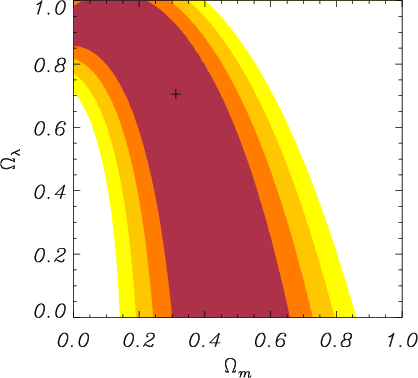 |
Figure 15:
|
Fixing again the initial values of
![]() to
the
to
the ![]() CDM model (0.3,0.7), we obtain the confidence levels
plotted in Fig. 15. The contours are widened compared
to the case of a single potential (in this case, the number of degrees
of freedom is reduced from 11 to 6, but they still give reasonable
constraints). Moreover we note that there is little variation in the
fitted parameters:
CDM model (0.3,0.7), we obtain the confidence levels
plotted in Fig. 15. The contours are widened compared
to the case of a single potential (in this case, the number of degrees
of freedom is reduced from 11 to 6, but they still give reasonable
constraints). Moreover we note that there is little variation in the
fitted parameters:
![]() km s-1,
km s-1,
![]() km s-1,
km s-1,
![]() ,
and
,
and
![]() .
This configuration is close
to the case of the cluster Abell 370, modeled with a bi-modal mass
distribution (Kneib et al. 1993b; Bézecourt et al. 1999b) needed to reproduce the peculiar
shape of the central multiple-image system. Unfortunately, up to now
only two redshifts are known for the multiple images identified in A370!
.
This configuration is close
to the case of the cluster Abell 370, modeled with a bi-modal mass
distribution (Kneib et al. 1993b; Bézecourt et al. 1999b) needed to reproduce the peculiar
shape of the central multiple-image system. Unfortunately, up to now
only two redshifts are known for the multiple images identified in A370!
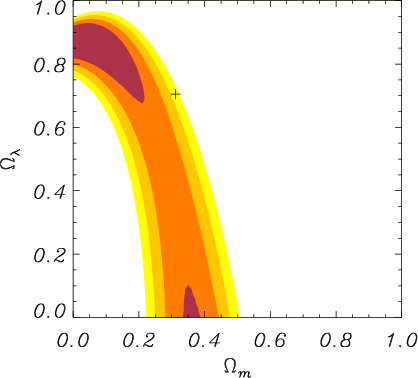 |
Figure 17:
|
Last, we generated another system of 3 families of multiple images
produced by a cluster consisting of a main clump (
![]() km
s-1) and a smaller one (
km
s-1) and a smaller one (
![]() km s-1) representing
22% of the total mass (Fig. 16). We chose to miss the
small clump in the mass recovery as this may happen when dealing with
some "dark clumps''. Fitting the configuration with a single main
cluster, we found in a first round the geometrical parameters, which
then remain constant in the
km s-1) representing
22% of the total mass (Fig. 16). We chose to miss the
small clump in the mass recovery as this may happen when dealing with
some "dark clumps''. Fitting the configuration with a single main
cluster, we found in a first round the geometrical parameters, which
then remain constant in the ![]() -optimisation:
-optimisation:
![]() ,
,
![]() ,
,
![]() and
and
![]() .
We note in
particular that the ellipticity is larger than the one used to
generate the main clump (
.
We note in
particular that the ellipticity is larger than the one used to
generate the main clump (
![]() ). This seems to be the
response of the fitting process in order to mimic the missing second
clump.
). This seems to be the
response of the fitting process in order to mimic the missing second
clump.
The parameters left free are again ![]() ,
,
![]() and
and
![]() .
The confidence contours are shown in
Fig. 17. We found the following values of the
parameters:
.
The confidence contours are shown in
Fig. 17. We found the following values of the
parameters:
![]() km s-1,
km s-1,
![]() and
and
![]() .
However in this case, we do not
recover correctly the set of cosmological parameters used to
generate the system:
.
However in this case, we do not
recover correctly the set of cosmological parameters used to
generate the system:
![]() is excluded
at the 3-
is excluded
at the 3-![]() level. Moreover the shape of the contours is not the
one expected from the lensing degeneracy. This could be considered to
be a signature of an incorrect fiducial mass distribution due to a
missing clump in the mass reconstruction. This example demonstrates
that the initial guess and the modeling of the different components
of a cluster are very sensitive elements. They need to be carefully
determined if one wants to test further constraints on the
cosmological parameters
level. Moreover the shape of the contours is not the
one expected from the lensing degeneracy. This could be considered to
be a signature of an incorrect fiducial mass distribution due to a
missing clump in the mass reconstruction. This example demonstrates
that the initial guess and the modeling of the different components
of a cluster are very sensitive elements. They need to be carefully
determined if one wants to test further constraints on the
cosmological parameters
Copyright ESO 2002
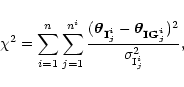
![\begin{displaymath}\chi^2=\displaystyle {\sum_{i=1}^n \sum_{j=1}^{n^i}
\frac {[\...
...\theta}_{{\bf SG}\vec{^i}})]^2}
{\sigma_{{\rm I}_j^i}^2}}\cdot
\end{displaymath}](/articles/aa/full/2002/21/aa1282/img221.gif)