We analyzed the H![]() emission line velocities for periodic behavior using Discrete Fourier Transform (DFT) and Analysis-of-Variance (AoV) algorithms (as implemented in the MIDAS Time Series Analysis package). The short duration of the night runs (an average of 2
emission line velocities for periodic behavior using Discrete Fourier Transform (DFT) and Analysis-of-Variance (AoV) algorithms (as implemented in the MIDAS Time Series Analysis package). The short duration of the night runs (an average of 2
![]() 5), limited as it is in late September by hour-angle constraints, inevitably introduces a window function with a large number of 1 c/d aliases for any existing period.
5), limited as it is in late September by hour-angle constraints, inevitably introduces a window function with a large number of 1 c/d aliases for any existing period.
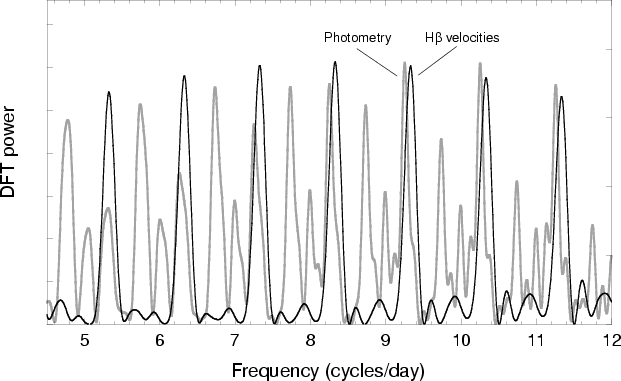
The raw DFT spectrum, computed using a frequency step of 0.01 c/d, is shown in Fig. 4 for the interval 0-30 c/d. A more detailed plot is shown in Fig. 5 (thick dark curve) for the interval 4.5 to 12 c/d (periods from 5.3 to 2 h). The strongest peaks are at 7.32, 8.32 and 9.32 c/d. Removing the effects of the window function using the CLEAN algorithm (Roberts et al. 1987) produces a peak either at 8.32 (2
![]() 885) or at 9.32 c/d (2
885) or at 9.32 c/d (2
![]() 575), depending on the values used for the gain (the amount by which the window function is subtracted from the raw DFT at each iteration), number of iterations, and frequency step.
575), depending on the values used for the gain (the amount by which the window function is subtracted from the raw DFT at each iteration), number of iterations, and frequency step.
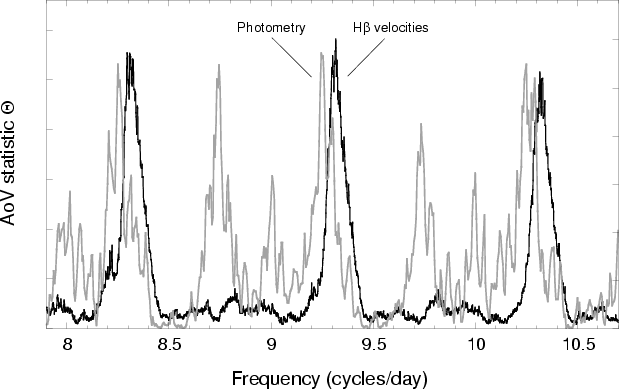
We also computed AoV periodograms (Schwarzenberg-Czerny 1989) for the H![]() emission line radial velocity data using different numbers of phase bins and various amounts of smoothing. In Fig. 6 we show the result for 8 bins and 3 overlapping bin covers (thick dark curve). The three strong peaks are at 8.32, 9.32 and 10.32 c/d. The peak at 9.32 c/d (2
emission line radial velocity data using different numbers of phase bins and various amounts of smoothing. In Fig. 6 we show the result for 8 bins and 3 overlapping bin covers (thick dark curve). The three strong peaks are at 8.32, 9.32 and 10.32 c/d. The peak at 9.32 c/d (2
![]() 575) appears slightly stronger here, but the high-frequency noise present in the AoV periodogram, which arises from the small number of data points which move around from one phase bin to the next as the period changes, may mask the true strength of the peaks.
575) appears slightly stronger here, but the high-frequency noise present in the AoV periodogram, which arises from the small number of data points which move around from one phase bin to the next as the period changes, may mask the true strength of the peaks.
The results of our analysis are ambiguous. The existing radial velocity data appears insufficient to decide which of the two periods, 8.32 c/d (2
![]() 885) or 9.32 c/d (2
885) or 9.32 c/d (2
![]() 575), is the real orbital period of RX J1643.7+3402. A least-squares sine fit to the velocities gives an estimate for the errors on the periods of
575), is the real orbital period of RX J1643.7+3402. A least-squares sine fit to the velocities gives an estimate for the errors on the periods of ![]() 0.013 c/d (
0.013 c/d (![]() 0
0
![]() 005).
005).
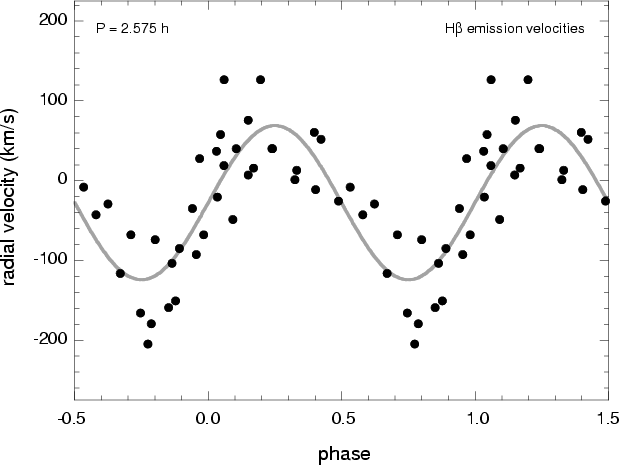
The radial velocities are plotted in Fig. 7 as a function of phase (for the 2
![]() 575 period; the plot for the 2
575 period; the plot for the 2
![]() 885 period is nearly identical). The semi-amplitude is
885 period is nearly identical). The semi-amplitude is
![]() kms-1. In the absence of any clear specific marker for orbital orientation, such as an eclipse, the epoch for phase 0 (HJD 2451806.0324 for the 2
kms-1. In the absence of any clear specific marker for orbital orientation, such as an eclipse, the epoch for phase 0 (HJD 2451806.0324 for the 2
![]() 575 period, HJD 2451806.1213 for the 2
575 period, HJD 2451806.1213 for the 2
![]() 885 period) has been defined as the time when the radial velocities change sign from negative to positive with respect to the heliocentric systemic velocity, which is
885 period) has been defined as the time when the radial velocities change sign from negative to positive with respect to the heliocentric systemic velocity, which is
![]() kms-1.
Using this convention, and if the emission-line velocities reflect the motion of the white dwarf, which they may not, inferior conjunction of the white dwarf would take place at phase
kms-1.
Using this convention, and if the emission-line velocities reflect the motion of the white dwarf, which they may not, inferior conjunction of the white dwarf would take place at phase
![]() .
.
In order to search for the two possible periods detected in the radial-velocity data, and to look for a short-period modulation, we analyzed the photometric data with the DFT+CLEAN and AoV algorithms. We excluded from the analysis the very short nights of September 20 and 27, the night of September 23 which exhibits large gaps and the night of September 21 which, apart from a sharp discontinuity, appears flat and featureless. The selected set contains the data for September 18, 22, 24, 25 and 26, 502 images in all.
The resulting DFT periodogram was computed using a frequency step of 0.005 c/d and is shown in Fig. 5 (gray curve) together with the periodogram of the radial velocity data. It is also severely dominated by the window function but appears more complex (with two interleaved sets of peaks). The strongest peak appears at 9.25 c/d with an equally strong peak at 10.25 c/d. The results of CLEANing the DFT spectrum show only a strong peak near 9.25 c/d (2
![]() 595), with a second weaker peak near 2.74 c/d (8
595), with a second weaker peak near 2.74 c/d (8
![]() 76) with one-half the power.
76) with one-half the power.
The results of an AoV analysis of the photometry are also shown in Fig. 6 (grey curve), together with the periodogram of the radial-velocity data. The 9.25 c/d peak appears stronger than the peak at 10.25 c/d, and also stronger than the peak at 8.25 c/d. The peaks in Figs. 5 and 6 derived from the photometry analysis have frequencies (8.25 and 9.25 c/d) that are similar to, but different from, those found from the analysis of the radial velocity data (8.32 and 9.32 c/d). The difference is small (0.8%) but significant.
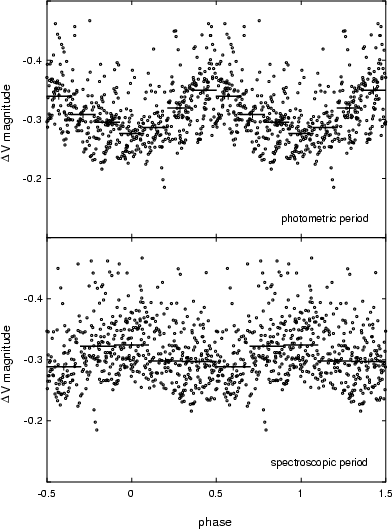
When the differential photometry data for individual nights are folded using one of the spectroscopic periods, a modulation is seen which clearly shifts forward in phase from night to night, but when the data are folded using the closest photometric period, the modulations do not shift and are in phase with each other. The results for the selected subset of nights (September 18, 22, 24, 25 and 26) are shown in Fig. 8 folded using one of the possible photometric periods (the others yield similar curves). Although small (1 to 2%) night-to-night changes in mean level are present, no corrections have been applied to the data plotted in this figure. There is a significant average modulation of ![]() 0.1 mag peak-to-peak amplitude at 9.25 c/d (2
0.1 mag peak-to-peak amplitude at 9.25 c/d (2
![]() 595) but little or none is seen at 9.32 c/d (2
595) but little or none is seen at 9.32 c/d (2
![]() 575), the value found from the radial velocities. The modulation can be discerned best in the light curves of Fig. 3 during the nights of September 18, 22, 24 and 26.
575), the value found from the radial velocities. The modulation can be discerned best in the light curves of Fig. 3 during the nights of September 18, 22, 24 and 26.
In summary, one likely interpretation of our results is that the radial velocities are modulated with a 9.32 c/d (2
![]() 575) period while the photometric data show a sligthly longer (0.8%) period of 9.25 c/d (2
575) period while the photometric data show a sligthly longer (0.8%) period of 9.25 c/d (2
![]() 595). However, an alternative interpretation where the radial-velocity data are modulated with a 8.32 c/d (2
595). However, an alternative interpretation where the radial-velocity data are modulated with a 8.32 c/d (2
![]() 885) period while the photometric data display a noticeably shorter (10%) period of 9.25 c/d (2
885) period while the photometric data display a noticeably shorter (10%) period of 9.25 c/d (2
![]() 595) is also possible. Note that the other photometric periods (at
595) is also possible. Note that the other photometric periods (at ![]() 1 c/d) are not entirely excluded. The implications of these two different interpretations are discussed later.
1 c/d) are not entirely excluded. The implications of these two different interpretations are discussed later.
None of our nights was sufficiently long to do a reliable time analysis within a single night for periods around 15 min and we looked instead for a coherent period in our data by grouping the longest nights with uninterrupted coverage which clearly displayed the rapid variability (September 18, 22, 24, 25, 26) and subjected them to an AoV analysis (within the 50-150 c/d interval) using three phase bins and no smoothing. There is no single peak which stands out in the resulting AoV periodogram, but the strongest signals are located between 80-85 c/d (18-17 min) and around 100 c/d (14 min), confirming the visual impression of a time scale around 15 min. The CLEANed DFT spectrum agrees with these results, showing power principally near 84.2 c/d and at 101.8 c/d, with the latter peak being the strongest.
Copyright ESO 2002