During the period 22-28 September 2000 more detailed spectroscopic observations were carried out with the CARELEC spectrograph (Lemaître et al. 1989) attached to the Cassegrain focus of the OHP 1.93-m telescope. We used a 600 lmm-1 grating resulting in a dispersion of 66 Å mm-1. The detector was a
![]() ,
,
![]() m pixel EEV 42-20 CCD. Exposure times were generally 10 min. Seven columns of the CCD (
m pixel EEV 42-20 CCD. Exposure times were generally 10 min. Seven columns of the CCD (![]() 3
3
![]() )
were extracted. The slit width was 2
)
were extracted. The slit width was 2
![]() 1, corresponding to a projected slit width on the detector of 52
1, corresponding to a projected slit width on the detector of 52 ![]() m i.e. 3.8 pixels. The resolution, as measured on the night sky lines, was
m i.e. 3.8 pixels. The resolution, as measured on the night sky lines, was ![]() 3.4 Å FWHM. The wavelength range was 4280-6100 Å. The spectra were wavelength calibrated using an Ar lamp and flux calibrated using the standard stars Feige15, BD+28
3.4 Å FWHM. The wavelength range was 4280-6100 Å. The spectra were wavelength calibrated using an Ar lamp and flux calibrated using the standard stars Feige15, BD+28![]() 4211 and EG247, taken from Oke (1974) and Stone (1977). To obtain accurate velocity measurements, we applied wavelength corrections by measuring the [O I]
4211 and EG247, taken from Oke (1974) and Stone (1977). To obtain accurate velocity measurements, we applied wavelength corrections by measuring the [O I] ![]() 5577 night sky line on each spectrum (the corrections were in the range -1.3, -0.4 Å).
5577 night sky line on each spectrum (the corrections were in the range -1.3, -0.4 Å).
The profiles of all emission lines are complex and variable. Some H![]() profiles have a flat top, others display a shoulder while a few show a clear central absorption; we derived radial velocities using our own software, as described in Gonçalves et al. (1999), by fitting each profile with a main emission component and a minor unresolved Gaussian absorption (see Sect. 5). This procedure derives velocity information essentially from the line flanks. The radial velocities for the main emission component vary between -205 and +125 kms-1.
profiles have a flat top, others display a shoulder while a few show a clear central absorption; we derived radial velocities using our own software, as described in Gonçalves et al. (1999), by fitting each profile with a main emission component and a minor unresolved Gaussian absorption (see Sect. 5). This procedure derives velocity information essentially from the line flanks. The radial velocities for the main emission component vary between -205 and +125 kms-1.
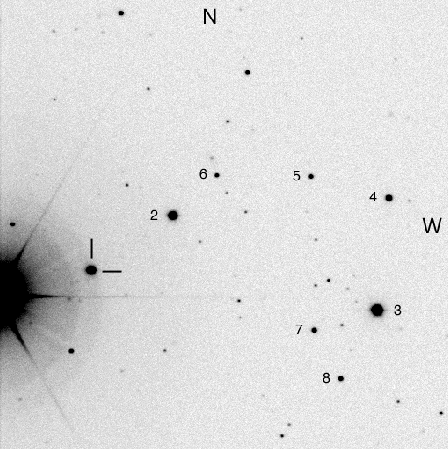 |
Figure 1:
Finding chart for RX J1643.7+3402. This is a 30-s |
| Line | EW (Å) |
| H |
1.6 |
| Bowen Blend | 2.0 |
| He II |
2.5 |
| He I |
0.12 |
| H |
2.8 |
| He I |
0.33 |
| He I |
0.32 |
| C IV |
0.62 |
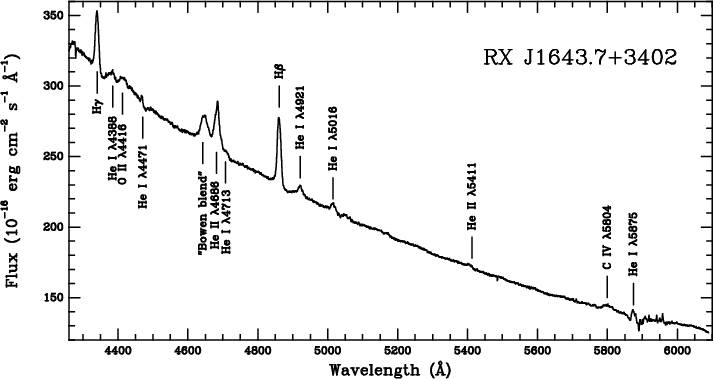
We coadded all our spectra (see Fig. 2). The resulting spectrum shows, in addition to the lines seen on the low resolution BAO spectra, several He I lines (4388, 4471, 4713, 4921, 5016 and 5875 Å) and an additional He II line (5411 Å); there is also a weak, broad (![]() 33 Å FWHM) C IV
33 Å FWHM) C IV ![]() 5804 emission line (this is in fact a doublet at 5801.5 and 5812.1 Å). Table 1 gives the equivalent widths (EW) of the main emission lines measured on this spectrum. Blends of atmospheric water vapor absorption lines are present between 5680 and 5800 Å and between 5870 and 6000 Å.
5804 emission line (this is in fact a doublet at 5801.5 and 5812.1 Å). Table 1 gives the equivalent widths (EW) of the main emission lines measured on this spectrum. Blends of atmospheric water vapor absorption lines are present between 5680 and 5800 Å and between 5870 and 6000 Å.
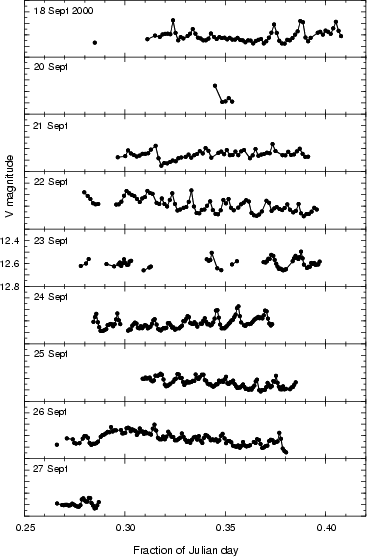
We obtained photometric observations of the RX J1643.7+3402 field on nine nights (18-27 September 2000) using the OHP 1.2-m telescope and a CCD
![]() camera. The pixel size is 24
camera. The pixel size is 24 ![]() m which projects to 0
m which projects to 0
![]() 7 on the sky. Most of the frames used for monitoring the brightness were 30 s V-band exposures. The effective time resolution (exposure time + read-out time) was 113 s on the first four nights, but on subsequent nights we used a single
7 on the sky. Most of the frames used for monitoring the brightness were 30 s V-band exposures. The effective time resolution (exposure time + read-out time) was 113 s on the first four nights, but on subsequent nights we used a single
![]() detector quadrant (
detector quadrant (![]() arcmin field of view), which resulted in a read-out time of 30 s and an effective time resolution of 60 s. The longest runs possible at this time of year were about 2.5 to 3 h long. Total or partial simultaneous coverage with the spectroscopic observations at the 1.93-m was achieved on six nights (22-27 September). Dome flat-fields were obtained using controlled daylight illumination. All necessary data reduction was done using the ESO-MIDAS software package.
arcmin field of view), which resulted in a read-out time of 30 s and an effective time resolution of 60 s. The longest runs possible at this time of year were about 2.5 to 3 h long. Total or partial simultaneous coverage with the spectroscopic observations at the 1.93-m was achieved on six nights (22-27 September). Dome flat-fields were obtained using controlled daylight illumination. All necessary data reduction was done using the ESO-MIDAS software package.
Observations using the entire
![]() system filter set were secured on September 23, together with frames of standards in M 13 (Forbes & Dawson 1986; Arp & Johnson 1955) for photometric calibration.
system filter set were secured on September 23, together with frames of standards in M 13 (Forbes & Dawson 1986; Arp & Johnson 1955) for photometric calibration.
| Name | V | U-B | B-V |
|
|
| Star 2 | 12.97 | -0.03 | +0.54 | +0.32 | +0.26 |
| Star 3 | 12.16 | +0.94 | +1.04 | +0.61 | +0.44 |
| Star 4 | 14.74 | +0.89 | +1.08 | +0.59 | +0.48 |
| Star 5 | 16.30 | -0.21 | +0.43 | +0.34 | +0.29 |
| Star 6 | 16.68 | +0.04 | +0.66 | +0.39 | +0.31 |
| Star 7 | 16.43 | +1.18 | +1.56 | +1.02 | +1.01 |
| Star 8 | 16.14 | +0.55 | +0.87 | +0.46 | +0.38 |
Copyright ESO 2002