| Line | T | q | ||||
| HD 77581/Vela X-1: | ||||||
| N V | 3 | 1 | -1 | 0.45 | 600 | 2.9 |
| Si IV | 300 | -1 | 0 | 0.45 | 600 | 2.9 |
| C IV | 200 | 0 | 0 | 0.45 | 600 | 2.9 |
| Al III | 20 | -1 | 0 | 0.45 | 600 | 2.9 |
| HD 153919/4U1700-37: | ||||||
| N V | 30 | 0 | 0 | 0.15 | 1700 | |
| Si IV |
|
-2 | 0 | 0.15 | 1700 | |
| C IV | 5000 | -2 | 0 | 0.15 | 1700 | |
The modified SEI code is used to fit the line profiles at two orbital phases
(![]() ,
X-ray eclipse, and
,
X-ray eclipse, and ![]() )
of N V, Si IV, C IV and Al III resonance lines in HD 77581/Vela X-1 and N V, Si IV and C IV in
HD 153919/4U1700-37. The models are constrained by the following conditions:
(i) the values for
)
of N V, Si IV, C IV and Al III resonance lines in HD 77581/Vela X-1 and N V, Si IV and C IV in
HD 153919/4U1700-37. The models are constrained by the following conditions:
(i) the values for ![]() ,
,
![]() ,
,
![]() and q are the same for all
lines in a given HMXB; (ii) the value for
and q are the same for all
lines in a given HMXB; (ii) the value for ![]() follows from the orbital
parameters (Table 1); (iii) the dominant ionization stage is estimated from
the spectral type (Lamers et al. 1999). In HD 77581 N2+, Si3+ and
C2+ are expected to dominate, while in HD 153919 probably N3+,
Si4+ and C4+ dominate. Al2+ is assumed to dominate in HD 77581,
as the observed Al III line is very strong. The ionization is uniform
throughout the undisturbed wind, i.e.
follows from the orbital
parameters (Table 1); (iii) the dominant ionization stage is estimated from
the spectral type (Lamers et al. 1999). In HD 77581 N2+, Si3+ and
C2+ are expected to dominate, while in HD 153919 probably N3+,
Si4+ and C4+ dominate. Al2+ is assumed to dominate in HD 77581,
as the observed Al III line is very strong. The ionization is uniform
throughout the undisturbed wind, i.e.
![]() (except N4+ in
HD 77581). Note that the N V line suffers from strong absorption by the wing
of Ly-
(except N4+ in
HD 77581). Note that the N V line suffers from strong absorption by the wing
of Ly-![]() .
A sudden jump in intensity near the maximum of the Si IV and
C IV emission in HD 153919/4U1700-37 is due to numerical difficulties. These
lines were calculated by sampling the intrinsic line profile over
.
A sudden jump in intensity near the maximum of the Si IV and
C IV emission in HD 153919/4U1700-37 is due to numerical difficulties. These
lines were calculated by sampling the intrinsic line profile over
![]() with
with
![]() (instead of
(instead of
![]() with
with
![]() ),
suppressing the spikey feature by half. The resulting line profiles are shown
in Figs. 9, 10 and 14 and the model parameters are listed in Table 3.
),
suppressing the spikey feature by half. The resulting line profiles are shown
in Figs. 9, 10 and 14 and the model parameters are listed in Table 3.
 |
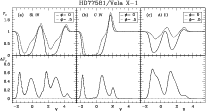
Figure 9: SEI models that approximately fit the observed line profiles and variability of Si IV, C IV and Al III in the UV spectrum of HD 77581/Vela X-1. Parameters are summarised in Table 3, and v=1 corresponds to 600 km s-1. |
 |
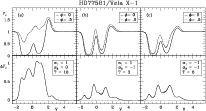
Figure 10: Same as Fig. 9, but for the N V line in the UV spectrum of HD 77581/Vela X-1 (see also Table 3). |
The orbital modulation of the strong wind lines in HD 77581 (with the exception of N V) is mainly due to the HM-effect. Some detailed changes are probably related to the accretion flow in the system (Sadakane et al. 1985; Kaper et al. 1994); since these structures are not included in the model, they cannot be reproduced. The modified SEI model can naturally explain the (near) absence of orbital modulation in the resonance lines of HD 153919, which is one of the main motivations for this study.
Adopting the ionization structure of the stellar wind as expected for single
stars of the same effective temperature as HD 77581, and adopting
![]() kms-1, the shape and variability of the Si IV, C IV and
Al III (2S-2P0 resonance doublet: restwavelengths 1854.716 and 1862.790,
separation 1302 kms-1) line profiles are reproduced rather well (Fig. 9, compare with Fig. 11).
kms-1, the shape and variability of the Si IV, C IV and
Al III (2S-2P0 resonance doublet: restwavelengths 1854.716 and 1862.790,
separation 1302 kms-1) line profiles are reproduced rather well (Fig. 9, compare with Fig. 11).
 |
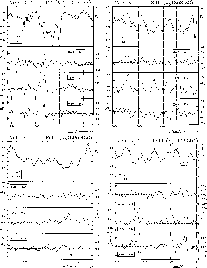
Figure 12: Same as Fig. 11, but for C II, Si III and Fe III. |
The N V line profile (Fig. 10, calculated with
![]() ),
however, cannot be modelled using a normal ionization balance that would yield
an extremely profound HM-effect, especially at the inner part of the
absorption (Fig. 10a), which is not observed (Fig. 11). Instead, the
observations seem to favour the degree of ionization to increase with distance
to the primary:
),
however, cannot be modelled using a normal ionization balance that would yield
an extremely profound HM-effect, especially at the inner part of the
absorption (Fig. 10a), which is not observed (Fig. 11). Instead, the
observations seem to favour the degree of ionization to increase with distance
to the primary:
![]() gives an acceptable fit, suppressing the orbital
modulation of the absorption trough, while preserving some of the emission
(Fig. 10b). The line profile and its modulation are very similar for
gives an acceptable fit, suppressing the orbital
modulation of the absorption trough, while preserving some of the emission
(Fig. 10b). The line profile and its modulation are very similar for
![]() or -1 (Fig. 10c), only requiring a slightly larger integrated
optical depth (T). If
or -1 (Fig. 10c), only requiring a slightly larger integrated
optical depth (T). If
![]() ,
however, much of the absorption
arises from material at extreme velocities, causing the absorption profile to
extend up to large positive velocities beyond the severely diminished
emission. The absorption observed longward of the N V line can be attributed
to a C III line.
,
however, much of the absorption
arises from material at extreme velocities, causing the absorption profile to
extend up to large positive velocities beyond the severely diminished
emission. The absorption observed longward of the N V line can be attributed
to a C III line.
The slope of the blue absorption wing (especially in Si IV and C IV, see
Fig. 2) indicates that the level of saturation (deeper and at velocities
slightly more negative than ![]() )
is not reproduced well by the SEI
turbulence recipe (Eq. (19)). The shocked wind structure produced by numerical
simulations (Owocki 1994), however, seem to predict more material at extreme
velocities (rather than gaußian turbulence). Furthermore, the turbulence
may not be uniform throughout the wind, as it is assumed here.
)
is not reproduced well by the SEI
turbulence recipe (Eq. (19)). The shocked wind structure produced by numerical
simulations (Owocki 1994), however, seem to predict more material at extreme
velocities (rather than gaußian turbulence). Furthermore, the turbulence
may not be uniform throughout the wind, as it is assumed here.
The main discrepancy between the model and observations of HD 77581/Vela X-1 is
the -400 to 0 kms-1 region, where the observed intensity is often
lower at ![]() than at
than at ![]() ,
contrary to what the HM-effect predicts.
This may be due to the presence of a photo-ionization wake that enhances
absorption at phases
,
contrary to what the HM-effect predicts.
This may be due to the presence of a photo-ionization wake that enhances
absorption at phases
![]() (Kaper et al. 1994). The
photo-ionization wake, as observed in strong optical lines like the hydrogen
Balmer lines and He I lines in the spectrum of HD 77581, is situated close to
the star at the trailing border of the ionization zone.
(Kaper et al. 1994). The
photo-ionization wake, as observed in strong optical lines like the hydrogen
Balmer lines and He I lines in the spectrum of HD 77581, is situated close to
the star at the trailing border of the ionization zone.
This effect is especially pronounced in N V (Fig. 11), possibly as a result
of a change in ionization degree within the photo-ionization wake. Enhanced
absorption is seen between +200 and -600 kms-1 (
![]() ), with
its maximum evolving towards more negative velocities from
), with
its maximum evolving towards more negative velocities from ![]() to
to
![]() .
Absorption at
.
Absorption at ![]() (or enhanced emission at
(or enhanced emission at ![]() )
extends up to +600 kms-1.
)
extends up to +600 kms-1.
Similar enhanced absorption is seen in Si IV, C IV and Al III (Fig. 11) at
-200 and -300 to -400 kms-1 around ![]() and 0.75,
respectively, and perhaps already around
and 0.75,
respectively, and perhaps already around ![]() .
The enhanced absorption
due to the photo-ionization wake may have reduced the amplitude of the
HM-effect seen between -600 and -400 kms-1.
.
The enhanced absorption
due to the photo-ionization wake may have reduced the amplitude of the
HM-effect seen between -600 and -400 kms-1.
Several weaker UV lines also show orbital modulation. The 2P0-2D resonance
doublet of C II at 1334.5323 and 1335.7077 Å (Fig. 12) is sufficiently
strong to show the HM-effect between 0 and about +700 kms-1 and
between about -400 and -600 kms-1, but slightly enhanced absorption
at -300 kms-1 around ![]() may be attributed to the
photo-ionization wake.
may be attributed to the
photo-ionization wake.
 |
Figure 13:
Lightcurve for the integrated flux in the Si III resonance lines
around 1300 Å in HD 77581/Vela X-1. The dotted line indicates the flux level
around |
The strongly variable 3P0-3P multiplet UV 4 of Si III (Fig. 12) consists of
6 components, of which 2 are blended: the pattern of variability is repeated
five-fold. The absorption is diminished at -400 kms-1 at ![]() due to the HM-effect, but enhanced at -300 kms-1 at
due to the HM-effect, but enhanced at -300 kms-1 at ![]() due to
the photo-ionization wake. In Fig. 13 a lightcurve is plotted for the
spectral region between 1292 and 1303 Å - corresponding to -2600 and
-70 kms-1, respectively. Absorption is minimal between
due to
the photo-ionization wake. In Fig. 13 a lightcurve is plotted for the
spectral region between 1292 and 1303 Å - corresponding to -2600 and
-70 kms-1, respectively. Absorption is minimal between ![]() and
0.5, and strongest between
and
0.5, and strongest between ![]() and 0.8. The blending of the Si III components makes it difficult to detect variability at -600 kms-1,
although there is a hint for diminished absorption at
and 0.8. The blending of the Si III components makes it difficult to detect variability at -600 kms-1,
although there is a hint for diminished absorption at ![]() at this
velocity in the bluemost component at 1294.543 Å. The 1S-1P0 (multiplet UV 2)
resonance singlet of Si III at 1206.51 Å could not be studied, due to the
severe interstellar extinction and the strong Ly
at this
velocity in the bluemost component at 1294.543 Å. The 1S-1P0 (multiplet UV 2)
resonance singlet of Si III at 1206.51 Å could not be studied, due to the
severe interstellar extinction and the strong Ly![]() geocoronal line at
1215.34 Å in the neighbouring echelle order. The subordinate singlets of
1P0-1S multiplets UV 9 and UV 10 of Si III at 1417.24 and 1312.59 Å,
respectively, do not show variability, although the lines are clearly present
in the spectrum - particularly the UV 9 singlet. The 2P0-2S resonance
doublet of Si II at 1304.372 Å (+240 kms-1 in Fig. 12) does not
show any variability either, as it is of interstellar origin.
geocoronal line at
1215.34 Å in the neighbouring echelle order. The subordinate singlets of
1P0-1S multiplets UV 9 and UV 10 of Si III at 1417.24 and 1312.59 Å,
respectively, do not show variability, although the lines are clearly present
in the spectrum - particularly the UV 9 singlet. The 2P0-2S resonance
doublet of Si II at 1304.372 Å (+240 kms-1 in Fig. 12) does not
show any variability either, as it is of interstellar origin.
The spectral region around 1900 Å is dominated by numerous lines of Fe III,
of which the a7S-z7P0 multiplet 34 is the strongest. It consists of 3 widely
separated components at 1895.456, 1914.056 and 1926.304 Å (Fig. 12). They
all clearly show the diminished absorption at -400 and -600 kms-1around ![]() due to the HM-effect, and enhanced absorption at -300 km
s-1 around
due to the HM-effect, and enhanced absorption at -300 km
s-1 around ![]() due to the photo-ionization wake, exactly as
observed in the Al III resonance doublet. Some confusion arises from the
presence of 2 lines of the a5G-z5H0 multiplet 51 of Fe III at 1922.789 and
1915.083 Å, corresponding to -550 and -1750 kms-1 with respect to
1926.304 Å, respectively. Multiplet 51 shows the same behaviour of the
absorption near -300 and -400 kms-1 as multiplet 34, but not the
-600 kms-1 absorption.
due to the photo-ionization wake, exactly as
observed in the Al III resonance doublet. Some confusion arises from the
presence of 2 lines of the a5G-z5H0 multiplet 51 of Fe III at 1922.789 and
1915.083 Å, corresponding to -550 and -1750 kms-1 with respect to
1926.304 Å, respectively. Multiplet 51 shows the same behaviour of the
absorption near -300 and -400 kms-1 as multiplet 34, but not the
-600 kms-1 absorption.
 |
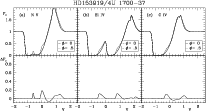
Figure 14: SEI models that approximately fit the observed line profiles and variability of N V, Si IV and C IV in the UV spectrum of HD 153919/4U1700-37. Parameters are summarised in Table 3, and v=1corresponds to 1700 kms-1. |
In conclusion, the orbital modulation of both the strong wind lines and other
lines in the UV spectrum of HD 77581 indicates the presence of two absorption
components that are not included in the SEI modelling. The most prominent of
these can be explained by a photo-ionization wake, causing additional
absorption in the line-of-sight at ![]() kms-1 around
kms-1 around ![]() and at
and at ![]() kms-1 around
kms-1 around ![]() .
In addition, at
.
In addition, at ![]() kms-1, i.e. the terminal velocity of the wind of HD 77581, more
absorption is present outside the Strömgren zone than the SEI model
reproduces. This might reflect the stellar wind structure at larger distances
from the star: the velocity may be lower and the density higher after the wind
has passed through the Strömgren zone compared to an undisturbed wind.
kms-1, i.e. the terminal velocity of the wind of HD 77581, more
absorption is present outside the Strömgren zone than the SEI model
reproduces. This might reflect the stellar wind structure at larger distances
from the star: the velocity may be lower and the density higher after the wind
has passed through the Strömgren zone compared to an undisturbed wind.
The shape and (lack of) orbital modulation of the line profiles in
HD 153919/4U1700-37 are reproduced well (Fig. 14). The exact value for qis hard to determine because of the (near) absence of the HM-effect due to a
combination of strong absorption and the presence of turbulence, yet it is
clear that q<4 would definitely yield a too strong HM-effect. Also, the
HM-effect is predicted to appear strongest at velocities between ![]() and 0, implying that any variations in the blue absorption wing (at
and 0, implying that any variations in the blue absorption wing (at
![]() )
without accompanying HM-effect at smaller velocities must be
due to some other mechanism, e.g. Raman-scattered far-UV emission lines
(Kaper et al. 1990).
)
without accompanying HM-effect at smaller velocities must be
due to some other mechanism, e.g. Raman-scattered far-UV emission lines
(Kaper et al. 1990).
Copyright ESO 2001