 |
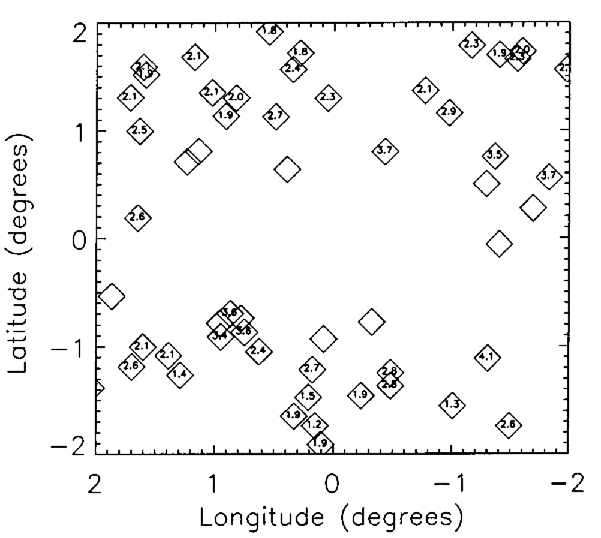
Figure 5: Longitude versus latitude of the new galactic bulge PNe detected in the radio. The numbers inside the symbols indicate their E(B-V) value. |
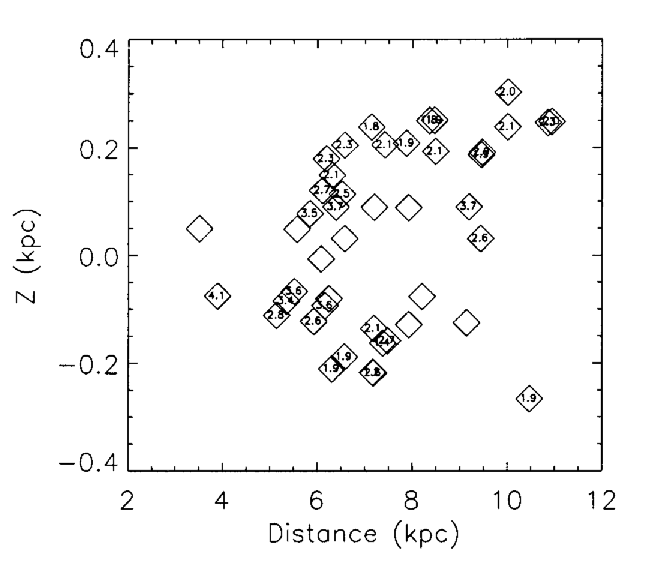 |
Figure 6: Distance versus scale height of the new galactic bulge PNe detected in the radio. The numbers inside the symbols indicate their E(B-V) value. |
We calculated the extinction E(B-V) comparing the radio flux densities
with the total H![]() flux values, which were obtained from images
obtained with the NOAO 8
flux values, which were obtained from images
obtained with the NOAO 8
![]() k Mosaic Imager on the 0.9-m telescope at KPNO
(Jacoby
& Van de Steene 2001, in preparation). The flux values were corrected for the
contribution of [N II]
k Mosaic Imager on the 0.9-m telescope at KPNO
(Jacoby
& Van de Steene 2001, in preparation). The flux values were corrected for the
contribution of [N II]![]() 6548 and
6548 and ![]() 6584
based on spectra obtained at ESO and CTIO (Van de Steene & Jacoby
2001, in preparation). The
H
6584
based on spectra obtained at ESO and CTIO (Van de Steene & Jacoby
2001, in preparation). The
H![]() flux and radio flux density have the same dependency on electron density
and the expected ratio is only a weak function of the electron
temperature and helium abundance (Pottasch 1984).
The radio flux density and H
flux and radio flux density have the same dependency on electron density
and the expected ratio is only a weak function of the electron
temperature and helium abundance (Pottasch 1984).
The radio flux density and H![]() flux can be used to determine the
extinction c
flux can be used to determine the
extinction c
![]() E(B-V). Assuming the standard ratio of
H
E(B-V). Assuming the standard ratio of
H![]() /H
/H
![]() ,
we used the H
,
we used the H![]() flux to
predict the extinction: c
flux to
predict the extinction: c
![]() .
The values of E(B-V)are presented in Table 3. All but one PN have values between
1 and 4. For the PNe detected in the radio but not in H
.
The values of E(B-V)are presented in Table 3. All but one PN have values between
1 and 4. For the PNe detected in the radio but not in H![]() the
extinction is likely to be higher.
the
extinction is likely to be higher.
As mentioned before: some PNe were detected in H![]() but not in
the radio, probably due to too low surface brightness.
Eight PNe were detected in the radio, but not in the H
but not in
the radio, probably due to too low surface brightness.
Eight PNe were detected in the radio, but not in the H![]() images,
probably due to too high extinction. These PNe also show no
H
images,
probably due to too high extinction. These PNe also show no
H![]() emission in their spectra. They are visible at longer wavelengths such
as [S III]
emission in their spectra. They are visible at longer wavelengths such
as [S III]![]() 9532.
9532.
From Figs. 5 and 6 it appears indeed that the extinction increases towards the galactic center. No extinction value could be determined for objects closest to the galactic center. The distances of JaSt 54 and JaSt 58 appear to be underestimated, unless their internal extinction is very large.
Copyright ESO 2001