In Table 1 we list the position of the peak flux density per beam
of the PN at 6 cm
together with the optical positions as determined from the H![]() or [S III]
or [S III]![]() 9532 images (Jacoby & Van de Steene 2001, in preparation).
The peak of the radio emission is adopted as the PN position.
If the PN is extended in the radio, the radio position may be off
center. The radio position will be better determined for higher peak
flux values and smaller PNe. It is also for this reason that we chose to
use the value at 6 cm and not at 3 cm, where the resolution is twice
as high and the signal to noise per beam lower for extended sources.
9532 images (Jacoby & Van de Steene 2001, in preparation).
The peak of the radio emission is adopted as the PN position.
If the PN is extended in the radio, the radio position may be off
center. The radio position will be better determined for higher peak
flux values and smaller PNe. It is also for this reason that we chose to
use the value at 6 cm and not at 3 cm, where the resolution is twice
as high and the signal to noise per beam lower for extended sources.
We note that the radio positions have a tendency to be offset towards the west of the optical position. In declination there is no clear tendency noticeable in the offsets.
The optical and radio positions agree very well. PNe for which the
radio position differs more than 2
![]() in RA or DEC from the
optical position are extended and the peak in the radio is
usually not centered.
in RA or DEC from the
optical position are extended and the peak in the radio is
usually not centered.
Of the 64 PNe observed, 7 were not detected:
JaSt 7, 21, 45, 80, 88, 92, and 96. Most likely
they are very extended and have a surface
brightness that is too low to be detected in the radio.
They are also very faint in the H![]() images and
their H
images and
their H![]() flux values are very uncertain (Jacoby & Van de Steene
2001, in preparation). All but JaSt 96 were also faint and extended
in the [S III]
flux values are very uncertain (Jacoby & Van de Steene
2001, in preparation). All but JaSt 96 were also faint and extended
in the [S III]![]() 9532 images.
9532 images.
Table 2 gives the radio flux densities at 6 and 3 cm.
If a Gaussian model provided a satisfactory fit to the surface
brightness, the total Gaussian flux density was adopted. This was
mostly the case for small, unresolved PNe. If the PN was extended, the
intensities within the 2 or 3 ![]() level contour were summed.
This value was compared with the statistics over a larger region
across the nebula to obtain an error estimate (Fomalont 1989).
level contour were summed.
This value was compared with the statistics over a larger region
across the nebula to obtain an error estimate (Fomalont 1989).
For JaSt 69 only a small 3 ![]() blob at the right position
indicated the presence of a PN. No flux or size values could be
determined. In some cases several blobs indicated the presence of a
PN at 3 cm and hence their flux is a lower limit. Some objects
detected at 6 cm, but having low peak flux density per beam,
could not be seen at 3 cm.
blob at the right position
indicated the presence of a PN. No flux or size values could be
determined. In some cases several blobs indicated the presence of a
PN at 3 cm and hence their flux is a lower limit. Some objects
detected at 6 cm, but having low peak flux density per beam,
could not be seen at 3 cm.
PNe are normally optically thin at 6 cm in which case its 3 cm flux density is about 95% of the 6 cm flux density. In our case this means that the flux densities are similar within the error-bars. However, when a PN is already well resolved at 6 cm, more flux may have been missed at 3 cm where the beam is half the size, especially if the nebula is extended and of low surface brightness. It is clear that due to these factors, the flux density at 3 cm is generally less well-determined than at 6 cm, except for the bright and compact PNe. When a PN is optically thick at 6 cm, its 3 cm flux density is expected to be three times the flux density at 6 cm. There are some PNe like JaSt 65 and JaSt 79 for which the 3 cm flux density is clearly higher than the 6 cm flux density and which are point sources. In this case the PNe may not yet be completely optically thin at 6 cm and should be quite young.
In Fig. 1 we plotted the histogram of the radio flux
of the known and new galactic bulge PNe.
We selected a sample of known galactic bulge PNe for which radio flux
densities and angular diameters are available, as in Van de Steene &
Zijlstra (1995). The new bulge PNe are within 2 degrees
of the galactic center. None has a radio flux larger than 100 mJy and
their angular sizes are smaller than 20
![]() .
Hence they fulfill the
same selection criteria as these previously known bulge PNe.
.
Hence they fulfill the
same selection criteria as these previously known bulge PNe.
There is a larger number of PNe with low flux densities among the new
bulge PNe than among the known ones. 67% of the new PNe
have a radio flux less than 15 mJy, while this is only 45% for the
known ones. Of the 7 known ones within 2 degrees of the galactic
center only 2 have a radio flux below 15 mJy. The median flux for the
new PNe is 11.3 mJy, while the median for the known bulge PNe is
17.0 mJy. Our rms noise level in the maps is similar to the
1 ![]() noise of 0.1 mJy in the 6 cm maps of Zijlstra et al. (1989). Apparently these faint and small PNe have
just been missed in optical surveys done to date.
noise of 0.1 mJy in the 6 cm maps of Zijlstra et al. (1989). Apparently these faint and small PNe have
just been missed in optical surveys done to date.
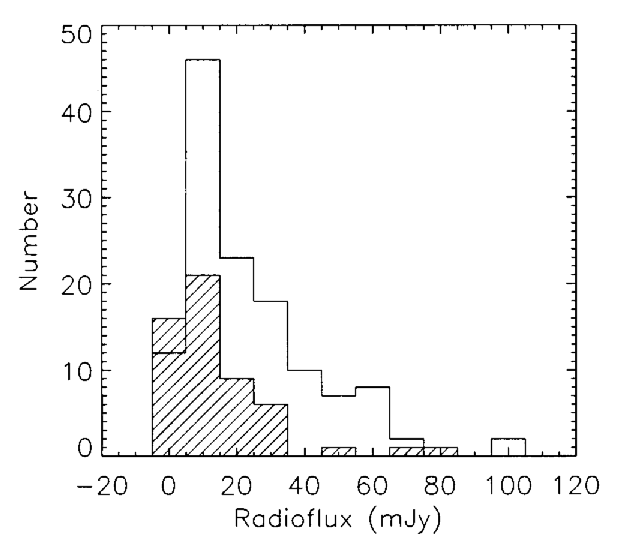 |
Figure 1: Histogram of the 6 cm flux values of previously known galactic bulge PNe with radio data and the new galactic bulge PNe (striped). |
Table 2 also gives the angular size of the detected PNe. We chose to determine the angular size at 6 cm because at this wavelength the resolution was lower and thus gives the best signal to noise ratio for the extended nebulae. The diameter at 3 cm is given if it is better determined than at 6 cm, such as for very small and bright PNe.
Diameters may differ considerably depending upon how they are
calculated. The diameter was derived by one of several ways depending
on the structure of the brightness distribution. If a two-dimensional
Gaussian fit provided a satisfactory model to the observed
structureless surface distribution, its deconvolved FWHM major and
minor axis are given. The equivalent diameter is the square root of
their product. To obtain the full diameter, this value must be
multiplied with a conversion factor which is a function of the beam
FWHM and depends upon the intrinsic surface distribution of the
source. We assumed a spherical constant emissivity shell of 0.5 and
used formula 5 and Table 1 from van Hoof (2000) to estimate
the true radii. For small objects, if the Gaussian deconvolution was
well determined and similar at 3 and 6 cm, the FWHM at 3 cm is given.
If the deconvolution produced a point source at 6 cm, the source size
at 3 cm is given. If the source was still a point source at 3 cm, the
beam-size is an upper limit. If the source was extended, a Gaussian
model was usually not a good representation of the radio source. The
diameter of the PN was measured on the contour at 50% of the peak
and deconvolved with the beam size. To determine the full diameter we
determined the ratio of the flux density within the 3 ![]() contour
with the flux density within the 50% contour. Hence, we assumed that
the flux decreased linearly with radius outside the 50% contour. We
checked that this procedure seemed to give very good agreement with
the size measured based on the 3
contour
with the flux density within the 50% contour. Hence, we assumed that
the flux decreased linearly with radius outside the 50% contour. We
checked that this procedure seemed to give very good agreement with
the size measured based on the 3 ![]() contour. We didn't use the
contour level at 10% of the peak (Zijlstra et al. 1989;
Aaquist & Kwok 1990), because this was often below noise
level.
contour. We didn't use the
contour level at 10% of the peak (Zijlstra et al. 1989;
Aaquist & Kwok 1990), because this was often below noise
level.
It was noticed in the review paper by Pottasch (1992)
that there is a selection against discovering both large and small PNe
in the galactic bulge. 36% of the new PNe have a diameter smaller
than 5
![]() ,
while this is 71% for the known ones.
The median is 6
,
while this is 71% for the known ones.
The median is 6
![]() 6 for the new PNe and only 3
6 for the new PNe and only 3
![]() 2 for the
known bulge PNe with radio data. We seem to
identify relatively more larger PNe than in previous surveys. In
regions with large extinction the [SIII]
2 for the
known bulge PNe with radio data. We seem to
identify relatively more larger PNe than in previous surveys. In
regions with large extinction the [SIII]![]() 9532 line appears
efficient in picking out the larger, low surface brightness PNe, and
not only the small and dusty ones. Obviously these are the PNe which
may have been missed in optical surveys.
9532 line appears
efficient in picking out the larger, low surface brightness PNe, and
not only the small and dusty ones. Obviously these are the PNe which
may have been missed in optical surveys.
| JaSt | Dist | z | R |
|
E(B-V) | Comment |
| kpc | pc | pc |
|
|||
| 1 | 14.6: | 401.6: | 0.20: | 0.25: | 2.5: | |
| 2 | 10.0 | 305.7 | 0.15 | 0.19 | 2.0 | |
| 3 | 6.2 | 183.0 | 0.14 | 0.17 | 2.3 | |
| 4 | 8.5 | 258.9 | 0.23 | 0.29 | 1.9 | |
| 5 | 6.6 | 210.4 | 0.13 | 0.17 | 2.3 | |
| 8 | 10.0 | 241.9 | 0.17 | 0.22 | 2.1 | |
| 9 | 9.5 | 194.9 | 0.19 | 0.23 | 2.9 | |
| 11 | 9.2 | 91.6 | 0.24 | 0.31 | 3.7 | |
| 16 | 5.9 | 77.6 | 0.07 | 0.08 | 3.5 | |
| 17 | 7.1 | 242.5 | 0.14 | 0.17 | 1.8 | |
| 19 | 8.4 | 264.7 | 0.14 | 0.17 | 1.8 | |
| 23 | 2.4 | PS | ||||
| 24 | 6.6 | 31.4 | 0.09 | 0.11 | X | |
| 26 | 5.6 | 49.7 | 0.15 | 0.19 | X | |
| 27 | 10.8 | 246.2 | 0.23 | 0.29 | 2.3 | |
| 31 | 6.4 | 91.2 | 0.14 | 0.17 | 3.7 | |
| 34 | 13.2 | 392.9 | 0.23 | 0.29 | 2.1 | |
| 36 | 6.1 | 120.2 | 0.05 | 0.06 | 2.7 | |
| 37 | 6.1 | -6.3 | 0.11 | 0.13 | X | |
| 38 | 10.9: | 251.7: | 0.19: | 0.23: | 2.0: | |
| 41 | 6.3 | 150.4 | 0.10 | 0.12 | 2.1 | |
| 42 | 7.4 | 207.0 | 0.09 | 0.11 | 2.1 | |
| 44 | 9.6: | 190.2: | 0.20: | 0.26: | 1.9: | |
| 46 | 7.9 | 207.1 | 0.05 | 0.06 | 1.9 | |
| 49 | 7.9 | 89.4 | 0.13 | 0.16 | X | |
| 52 | 8.5 | 190.6 | 0.03 | 0.04 | 2.1 | |
| 54 | 3.5 | 50.2 | 0.06 | 0.07 | X | |
| 55 | 6.5 | 115.9 | 0.17 | 0.21 | 2.5 | |
| 56 | 7.2 | 89.9 | 0.09 | 0.11 | X | |
| 58 | 3.9 | -77.8 | 0.15 | 0.18 | 4.1 | |
| 60 | 16.2 | -213.6 | 0.04 | 0.04 | X | |
| 63 | 9.4 | 31.5 | 0.19 | 0.25 | 2.6 | |
| 64 | 7.2 | -216.3 | 0.04 | 0.05 | 2.6 | |
| 65 | 1.3 | PS | ||||
| 66 | 5.5 | -111.1 | 0.03 | 0.04 | 2.8 | |
| 67 | 7.9 | -127.0 | 0.03 | 0.04 | 4.6: Z | |
| 68 | 16.7 | -388.0 | 0.04 | 0.04 | 2.8 | |
| 70 | 6.2 | -82.0 | 0.13 | 0.16 | X | |
| 71 | 5.5 | -67.4 | 0.06 | 0.07 | 3.6 | |
| 73 | 10.5 | -261.7 | 0.04 | 0.05 | 1.9 | |
| 74 | 6.2 | -93.9 | 0.07 | 0.09 | 3.6 | |
| 75 | 7.5 | -157.5 | 0.05 | 0.06 | 2.7 | |
| 76 | 16.8 | -223.1 | 0.03 | 0.03 | 5.0: Z | |
| 77 | 2.4 | PS | ||||
| 78 | 5.4 | -87.5 | 0.19 | 0.24 | 3.4: Z | |
| 79 | 1.5 | PS | ||||
| 81 | 8.2 | -75.8 | 0.04 | 0.05 | X | |
| 85 | 7.2: | -224.1 | 0.30 | 0.39: | 1.2 |
| JaSt | Dist | z | R |
|
E(B-V) | Comment |
| kpc | pc | pc |
|
|||
| 86 | 6.6 | -193.0 | 0.18 | 0.23 | 1.9 | |
| 89 | 7.2 | -138.3 | 0.15 | 0.19 | 2.1 | |
| 90 | 17.2: | -303.3: | 0.23: | 0.29: | 2.1 | |
| 93 | 6.5: | -217.2: | 0.27: | 0.35: | 1.9: Z | |
| 95 | 7.4: | -157.7: | 0.23: | 0.28: | 1.3 | |
| 97 | 5.9 | -125.5 | 0.16 | 0.21 | 2.6 | |
| 98 | 2.7 Z | PS |
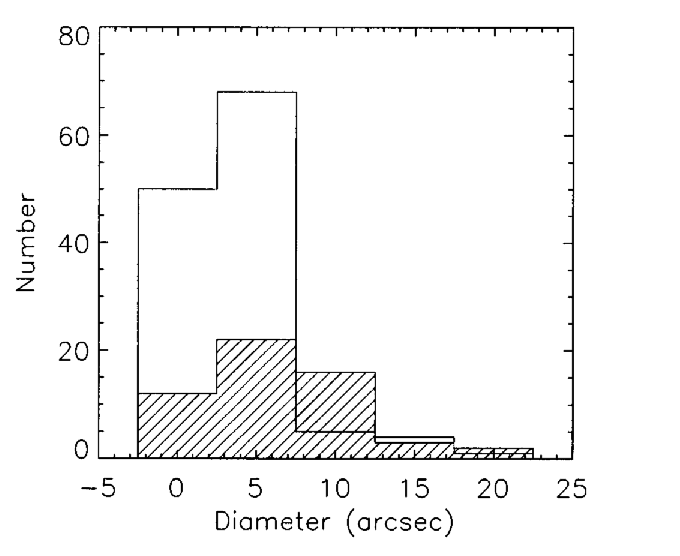 |
Figure 2: Histogram of the size of the known galactic bulge PNe with radio data and the new galactic bulge PNe (striped). |
Copyright ESO 2001