 |
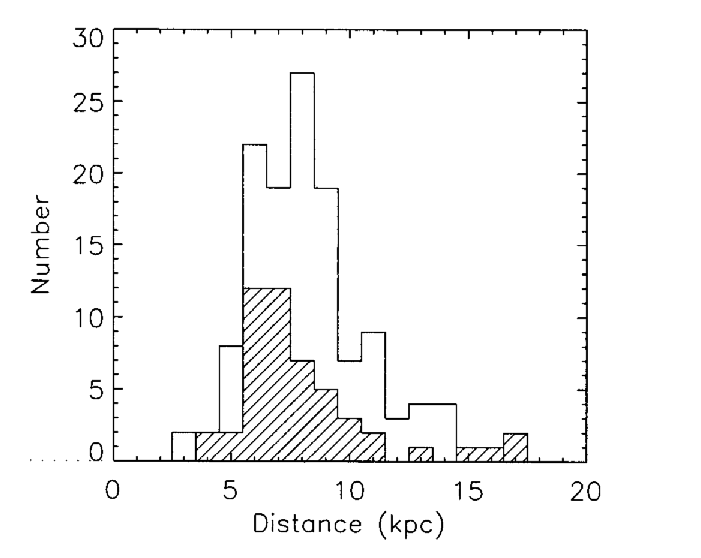
Figure 3: Histogram showing the distribution of the distances of the new galactic bulge PNe (striped) and the known bulge PNe with radio data. |
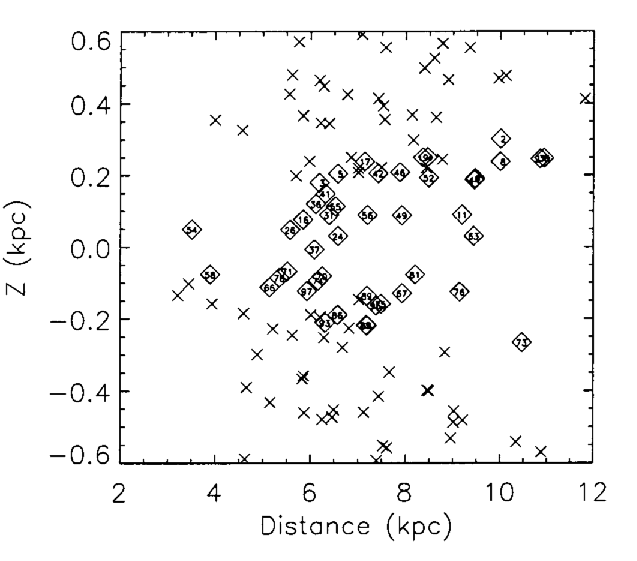 |
Figure 4: Plot of the scale-height versus distance of the new galactic bulge PNe (diamonds) and the known galactic bulge PNe with radio data (crosses). |
Based on the flux densities and the angular equivalent diameters we calculated the statistical distances to the PNe as established in Van de Steene & Zijlstra (1995). The relation is not strictly valid for optically thick and very small nebulae which may have their distance overestimated. The distances will tend to be overestimated for PNe with lower surface brightness than average, while PNe with a higher surface brightness than average will tend to have their distances underestimated. However, statistically the distance distribution will be representative.
The distances are presented in Table 3. A histogram of the distance distribution is presented in Fig. 3. The median distance is 7.2 kpc, about 8% closer than the galactic center; presumably, the more distant PNe suffer greater extinction and fell below our detection limit in our survey.
In Fig. 4 we plotted the scale height versus the distance. It seems that we observe PNe at the edge of the galactic bulge. As we look further inward, the extinction probably becomes too large. The PNe further away are at larger scale height where, apparently, the extinction is less. The known PNe are generally further away from the galactic center, surrounding our new PNe. The median absolute scale height is 136 pc.
Copyright ESO 2001