In Paper I we did numerical simulations in order to evaluate the biases in the kinematic model parameters (in that case, the Oort constants and the solar motion components) induced by our observational constraints and errors. In the present work, we have also generated simulated samples in the same way, though the significant correlations detected between some parameters make it advisable, in this case, to carry out a more detailed study.
In this section we present the process used to generate the simulated samples (the same as in Paper I, except for the change in the systematic contributions considered), the results we obtained and, finally, the quantification of the biases present in our real samples.
To take into account the irregular spatial distribution of our stars and their observational errors, parameters describing the position of each simulated pseudo-star were generated as follow:
 |
(B.2) |
where
(U0,V0,W0) are the reflex of solar motion. These
components were transformed into radial velocities and proper motions in
galactic coordinates using the nominal position of the pseudo-star
(R0,l,b). The systematic motion due to galactic rotation and spiral arm
kinematics was added following Eqs. (A.4) and (A.19),
obtaining the components
![]() for each pseudo-star. Finally, individual
observational errors were introduced by using the error function:
for each pseudo-star. Finally, individual
observational errors were introduced by using the error function:
 |
(B.3) |
where
![]() ,
,
![]() and
and
![]() are the observational errors of the real star.
are the observational errors of the real star.
At the end of this process we had the following data for each pseudo-star:
galactic coordinates (R,l,b), velocity parameters (
![]() ), errors in the velocity parameters
(
), errors in the velocity parameters
(
![]() )
and error in the photometric distance
(
)
and error in the photometric distance
(![]() ). The simulated radial component of those pseudo-stars
generated from a real star without radial velocity was not used, thus we
imposed on the simulated sample the same deficiency in radial velocity
data that is present in our real sample (see Sect. 2.2 and Appendix B in
Paper I for more details).
). The simulated radial component of those pseudo-stars
generated from a real star without radial velocity was not used, thus we
imposed on the simulated sample the same deficiency in radial velocity
data that is present in our real sample (see Sect. 2.2 and Appendix B in
Paper I for more details).
Following this scheme, several sets of 50 simulated samples for both O and
B stars and Cepheids were built. A classical solar motion of
(U,V,W) =
(9,12,7) km s-1 was considered, taking the dispersion velocity
components
![]() km s-1 for O and
B stars (see Paper I) and
km s-1 for O and
B stars (see Paper I) and
![]() km s-1 for Cepheids (Luri 2000). For the galactic rotation
parameters, we chose the values
km s-1 for Cepheids (Luri 2000). For the galactic rotation
parameters, we chose the values
![]() km s-1 kpc-1
and
km s-1 kpc-1
and
![]() km s-1 kpc-2, which
correspond to a linear rotation curve with an A Oort constant of
14.0 km s-1 kpc-1. On the other hand, for the spiral structure
parameters several sets of values were used for
km s-1 kpc-2, which
correspond to a linear rotation curve with an A Oort constant of
14.0 km s-1 kpc-1. On the other hand, for the spiral structure
parameters several sets of values were used for
![]() (from
(from
![]() to
to
![]() ,
in steps of
,
in steps of
![]() )
and
)
and
![]() (from
(from
![]() km s-1 kpc-1
to
km s-1 kpc-1
to
![]() km s-1 kpc-1, in steps
of 5 km s-1 kpc-1), whereas a fixed value of
km s-1 kpc-1, in steps
of 5 km s-1 kpc-1), whereas a fixed value of
![]() was considered (Yuan 1969). From
was considered (Yuan 1969). From
![]() ,
,
![]() ,
,
![]() and
and
![]() ,
the values of
,
the values of
![]() ,
,
![]() and
and ![]() were inferred for each set of samples.
were inferred for each set of samples.
56 sets of 50 samples for both O and B stars and Cepheids were generated.
Concerning the free parameters of our model, in a first stage we adopted
classical values (m = 2,
![]() ,
Lin et al. 1969;
,
Lin et al. 1969;
![]() kpc,
kpc,
![]() km s-1, Kerr &
Lyndell-Bell 1986), though we also tested cases with m =
4,
km s-1, Kerr &
Lyndell-Bell 1986), though we also tested cases with m =
4,
![]() (Amaral & Lépine 1997) and
(Amaral & Lépine 1997) and
![]() kpc,
kpc,
![]() km s-1 (Olling
& Merrifield 1998). In Table B.1 we
summarize all the adopted kinematic parameters.
km s-1 (Olling
& Merrifield 1998). In Table B.1 we
summarize all the adopted kinematic parameters.
|
|
9 km s-1 |
| 12 km s-1 | |
| 7 km s-1 | |
|
|
(8,8,5) km s-1 (O and B stars) |
| (13,13,6) km s-1 (Cepheid stars) | |
|
|
-2.1 km s-1 kpc-1 |
| 0.0 km s-1 kpc-2 | |
|
|
0.05 |
|
|
from 0
|
| in steps of 45
|
|
|
|
from 10 km s-1 kpc-1 to 40 km s-1 kpc-1, |
| in steps of 5 km s-1 kpc-1 | |
| Case A | m = 2,
|
|
|
|
| Case B | m = 2,
|
|
|
|
| Case C | m = 4,
|
|
|
|
| Case D | m = 4,
|
|
|
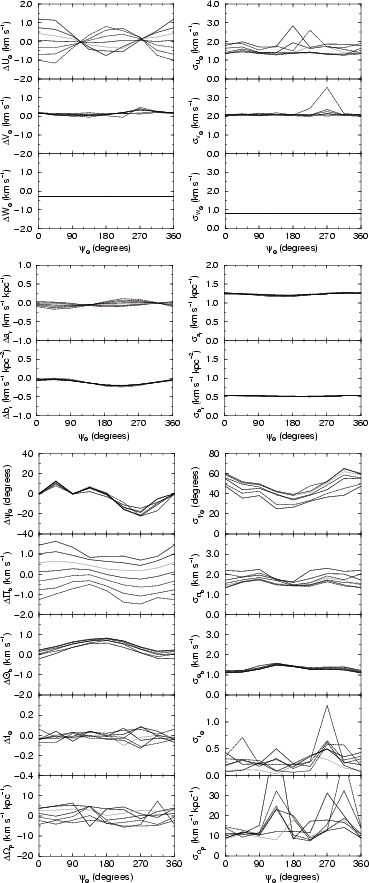
A complete solution simultaneously taking into account radial velocity and proper motion data was computed. Our test showed that the number of Cepheids within 2 kpc from the Sun prevents the obtainment of reliable results. In Figs. B.1 and B.2 we show the results obtained for the simulated samples of O and B stars (0.6 < R <2 kpc) and Cepheids (0.6 < R < 4 kpc) in case A (see Table B.1).
As a first conclusion, and confirming our suspicions, a systematic trend
with
![]() and/or
and/or
![]() is observed in most cases.
This behaviour is produced by the correlations between some terms in the
least squares fit, which depends on the spatial distribution of each
sample.
is observed in most cases.
This behaviour is produced by the correlations between some terms in the
least squares fit, which depends on the spatial distribution of each
sample.
For solar motion a bias between -1.5 and 1.5 km s-1 (depending on
![]() and
and
![]() )
was found for
)
was found for ![]() and
and
![]() ,
and of only -0.3 km s-1 for
,
and of only -0.3 km s-1 for ![]() .
For both O and B
stars and Cepheids we found the bias on
.
For both O and B
stars and Cepheids we found the bias on ![]() and
and ![]() to be
independent of
to be
independent of
![]() ,
with a slight dependence on
,
with a slight dependence on
![]() .
For
.
For
![]() and
and
![]() km s-1 kpc-1 we found a large negative bias on
km s-1 kpc-1 we found a large negative bias on ![]() ,
but
with a great standard deviation. This occurred in several samples (inside
this set) with serious convergence problems in the iteration procedure we
use to solve the least squares fit. Similar problems in other cases with
,
but
with a great standard deviation. This occurred in several samples (inside
this set) with serious convergence problems in the iteration procedure we
use to solve the least squares fit. Similar problems in other cases with
![]() will be found later. For O and B stars, the
standard deviations in the solar motion components are
will be found later. For O and B stars, the
standard deviations in the solar motion components are ![]() 0.6 km s-1 for
0.6 km s-1 for ![]() and
and ![]() (except for
(except for
![]() ),
and
),
and ![]() 0.3 km s-1 for
0.3 km s-1 for ![]() .
On the other hand, in the
case of Cepheids these values increased to
.
On the other hand, in the
case of Cepheids these values increased to ![]() 1.4-2.0 km s-1and
1.4-2.0 km s-1and ![]() 0.8 km s-1, respectively.
0.8 km s-1, respectively.
The biases found in the first- and second-order terms of the galactic
rotation curve are negligible for Cepheids, with a level fluctuation of
![]() km s-1 kpc-1 (or km s-1 kpc-2). In this case
there is a standard deviation of 1.3 for
km s-1 kpc-1 (or km s-1 kpc-2). In this case
there is a standard deviation of 1.3 for
![]() and 0.5 for
and 0.5 for
![]() .
For O and B stars the biases clearly depend on
.
For O and B stars the biases clearly depend on
![]() ,
varying from -0.7 to -0.5 km s-1 kpc-1 for
,
varying from -0.7 to -0.5 km s-1 kpc-1 for
![]() ,
and from -1.0 to 0.1 km s-1 kpc-2 for
,
and from -1.0 to 0.1 km s-1 kpc-2 for
![]() .
The standard deviations are 0.8 km s-1 kpc-1and 1.2 km s-1 kpc-2, respectively.
.
The standard deviations are 0.8 km s-1 kpc-1and 1.2 km s-1 kpc-2, respectively.
Let us study the biases that have an effect on the determination of the spiral structure parameters. As a general conclusion, Figs. B.1 and B.2 show that our sample of O and B stars supplies better results than the Cepheid sample.
In the case of O and B stars, we found a clear dependence with
![]() and
and
![]() in
in
![]() ,
,
![]() and
and
![]() determinations, whereas
determinations, whereas ![]() and
and
![]() only show peculiar behaviour around
only show peculiar behaviour around
![]() .
Concerning
.
Concerning
![]() ,
the bias oscillates from
,
the bias oscillates from
![]() to
to
![]() .
The standard deviation of the mean for the 50 samples of each
set is about 10-
.
The standard deviation of the mean for the 50 samples of each
set is about 10-
![]() .
On the other hand, for the amplitudes
.
On the other hand, for the amplitudes
![]() and
and
![]() the biases are of
the biases are of ![]() km s-1, with a standard deviation of about 1 km s-1. Neither
km s-1, with a standard deviation of about 1 km s-1. Neither
![]() nor
nor
![]() have a considerable bias, except for
have a considerable bias, except for
![]() ,
where both biases and standard deviations go up.
,
where both biases and standard deviations go up.
For Cepheid stars similar results were obtained, but with larger standard
deviations in all cases. The bias in
![]() changes from
changes from
![]() to
to
![]() ,
with standard deviations of about 30-
,
with standard deviations of about 30-
![]() .
In the case
of
.
In the case
of
![]() ,
we found a clear dependence on both
,
we found a clear dependence on both
![]() and
and
![]() ,
with a bias of
,
with a bias of ![]() km s-1 and a standard
deviation of about 2 km s-1. On the other hand, for
km s-1 and a standard
deviation of about 2 km s-1. On the other hand, for
![]() the bias is smaller, from 0 to 0.8 km s-1, and
the standard deviation is 1-1.5 km s-1. As for O and B stars, for
the bias is smaller, from 0 to 0.8 km s-1, and
the standard deviation is 1-1.5 km s-1. As for O and B stars, for
![]() and
and
![]() small biases are found, though the
standard deviations are larger in this case.
small biases are found, though the
standard deviations are larger in this case.
An interesting point to analyse is the study of the biases produced by a
bad choice of the free parameters in our model (m, i,
![]() ,
,
![]() ). In the same way as in the previous section, we
simulated 50 samples for each one of the cases considered in the real
resolution, i.e. cases A, B, C and D (see Table B.2). The
simulated parameters were the same as in Table B.1 for solar
motion and galactic rotation. For spiral arm kinematics, we considered
). In the same way as in the previous section, we
simulated 50 samples for each one of the cases considered in the real
resolution, i.e. cases A, B, C and D (see Table B.2). The
simulated parameters were the same as in Table B.1 for solar
motion and galactic rotation. For spiral arm kinematics, we considered
![]() and
and
![]() km s-1kpc-1 (similar values to those obtained from real samples; see Sect.
6).
km s-1kpc-1 (similar values to those obtained from real samples; see Sect.
6).
| O and B stars with 0.6 < R < 2 kpc | Cepheid stars with 0.6 < R < 4 kpc | |||||||
| Case A | Case B | Case C | Case D | Case A | Case B | Case C | Case D | |
| Case A simulated | ||||||||
|
|
23. | 17. | 24. | 19. | -11. | 0. | -2. | 3. |
|
|
28. | 27. | 25. | 25. | 65. | 61. | 71. | 71. |
|
|
2.2 | 3.1 | -1.1 | -0.8 | -4.3 | -3.5 | -2.5 | -4.0 |
|
|
6.2 | 7.3 | 2.9 | 3.5 | 18.9 | 16.6 | 8.8 | 7.3 |
| Case B simulated | ||||||||
|
|
32. | 24. | 32. | 25. | 0. | 4. | -11. | 1. |
|
|
34. | 32. | 31. | 30. | 83. | 75. | 82. | 78. |
|
|
0.7 | 1.9 | -1.6 | -1.3 | -4.3 | -14.3 | -4.3 | -4.1 |
|
|
7.1 | 8.0 | 3.8 | 3.9 | 16.2 | 52.8 | 7.0 | 8.1 |
| Case C simulated | ||||||||
|
|
18. | 14. | 17. | 14. | 4. | 2. | -2. | 10. |
|
|
24. | 23. | 21. | 21. | 62. | 58. | 60. | 63. |
|
|
6.7 | 8.2 | 1.2 | 2.0 | -2.4 | -1.1 | -1.0 | -3.0 |
|
|
6.5 | 7.3 | 2.9 | 3.3 | 25.1 | 21.5 | 10.9 | 9.2 |
| Case D simulated | ||||||||
|
|
29. | 23. | 25. | 21. | 9. | 10. | -9. | 1. |
|
|
31. | 29. | 27. | 26. | 84. | 78. | 81. | 73. |
|
|
4.3 | 6.3 | 0.2 | 1.1 | -3.9 | -4.9 | -3.2 | -2.8 |
|
|
7.1 | 8.2 | 3.7 | 3.8 | 17.1 | 19.5 | 7.8 | 8.6 |
In Table B.2 we show the biases and standard deviations when
solving the model equations in crossed solutions (e.g. we generated 50
simulated samples considering the free parameters in case A, and then we
solved equations using the free parameters adopted for cases A, B, C and
D, and so on for the other cases). As a first conclusion, we can observe
that a bad choice in the free parameters does not substantially alter the
derived kinematic parameters, particularly
![]() .
In other words,
for each set of simulated samples we obtained nearly the same values for
the parameters whether we solved the Eqs. (8) with the correct
set of free parameters or with a wrong combination of them. Differences in
.
In other words,
for each set of simulated samples we obtained nearly the same values for
the parameters whether we solved the Eqs. (8) with the correct
set of free parameters or with a wrong combination of them. Differences in
![]() do not exceed 10
do not exceed 10
![]() for O and B stars and 20
for O and B stars and 20
![]() for
Cepheids. In the case of
for
Cepheids. In the case of
![]() we found large differences
in some cases, but always when the standard deviation was also large. This
is especially true for Cepheids. A remarkable point is that the minimum
bias was not always produced when we properly chose the free parameters.
we found large differences
in some cases, but always when the standard deviation was also large. This
is especially true for Cepheids. A remarkable point is that the minimum
bias was not always produced when we properly chose the free parameters.
In the light of these results, we conclude that we are able to determine
the kinematic parameters of the proposed model of the Galaxy from the real
star samples described in Sect. 2, supposing that the velocity
field of the stars is well described by this model. We studied case A (m
= 2,
![]() ,
,
![]() kpc,
kpc,
![]() km s-1 in detail in these simulations, but we also looked at the
other combinations of the free parameters (cases B, C and D), with similar
conclusions. Nevertheless, the study of crossed solutions has shown that
it will be very difficult to decide between the several set of free
parameters discussed in Sect. 6 (see also Table
B.2), owing to the small differences obtained when changing the
free parameters in the condition equations.
km s-1 in detail in these simulations, but we also looked at the
other combinations of the free parameters (cases B, C and D), with similar
conclusions. Nevertheless, the study of crossed solutions has shown that
it will be very difficult to decide between the several set of free
parameters discussed in Sect. 6 (see also Table
B.2), owing to the small differences obtained when changing the
free parameters in the condition equations.
Copyright ESO 2001