SO and OH results
Several basic formulations have been developed to estimate magnetic field
strengths in clouds. All are based on meaningful physical footings,
but approach the problem differently in the way assumptions are made
about the equipartition of energies and source geometries. The various
formulations require different ``observables'' ([
![]() ], [
], [
![]() ,
,
![]() ], and [
], and [![]() ,
R]), some obtained by independent means. It
is thus worthwhile to review all three theoretical methods and to
compare the range of estimates they produce to the measured field limits.
,
R]), some obtained by independent means. It
is thus worthwhile to review all three theoretical methods and to
compare the range of estimates they produce to the measured field limits.
In the absence of other large-scale supportive mechanisms (such as
turbulence), the critical magnetic field needed to support a
self-gravitating cloud against collapse is,
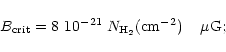 |
(2) |
this based on the derivation by Mouschovias & Spitzer (1976), where the
expressions were tuned to the results of exact numerical models of
initially uniform, spherical magnetic clouds, and using a mean molecular
mass of
![]() .
.
A second means of estimating the magnetic field in a cloud is by
its ``nonthermal'' velocity dispersion. There have been a number
of mechanisms suggested to explain the nonthermal component, or that
in excess of the thermal contribution to the linewidth, often observed
in lines toward molecular clouds. Stellar winds or outflows, were
among the first to be cited (Norman & Silk 1980; Larson 1981; Zuckerman
& Evans 1974). Upon further consideration, however, such inputs are
now believed to be relatively ineffective since the supersonic turbulence
they produce should be quickly dissipated in shocks. Instead,
long-wavelength and large-amplitude MHD waves within the cloud are
thought to better fit the role, since these waves are long-lived so
long as their propagation speed is below the local Alfven velocity.
Thus, a means of estimating the upper limit to the B field is to
compare the nonthermal contribution of a cloud's velocity dispersion,
![]() ,
to its Alfven velocity,
,
to its Alfven velocity,
![]() ,
where
,
where
![]() is the
volume density. Following Myers & Goodman (1988), we adopt
is the
volume density. Following Myers & Goodman (1988), we adopt
![]() ,
leading to
(
,
leading to
(
![]() )
)
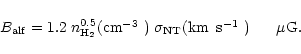 |
(3) |
The nonthermal velocity dispersion is taken to be the difference, in
quadrature, between the observed velocity dispersion and the thermal
component
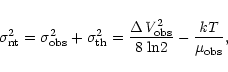 |
(4) |
Another means of estimating the magnetic field in a spherical cloud with negligible thermal support is by assuming the conditions of both magnetic and virial equilibrium in the cloud. The resulting relation is,
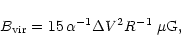 |
(5) |
where R is the radius of the cloud in parsecs, ![]() the (non-thermal)
FWHM of the line in km
the (non-thermal)
FWHM of the line in km![]() s-1, and
s-1, and ![]() a scaling factor (ranging somewhere
between 1.1 and 1.3; Myers & Goodman 1988; McKee et al. 1993).
a scaling factor (ranging somewhere
between 1.1 and 1.3; Myers & Goodman 1988; McKee et al. 1993).
In Cols. 9-11 of Table 1, we provide the critical magnetic field estimates,
determined using the three previously discussed methods, for the twelve SO/OH sources observed in this study using the ``observables'' from Cols. 2-5 (![]() ,
d(size),
,
d(size),
![]() ,
and
,
and
![]() ). The critical field estimates
). The critical field estimates
![]() ,
,
![]() ,
and
,
and
![]() for any given source vary by
as much as a factor of a few with G10.62 being the extreme case with
a
for any given source vary by
as much as a factor of a few with G10.62 being the extreme case with
a
![]() and
and
![]() that differ by a factor of seven. While the
that differ by a factor of seven. While the
![]() formulation generally gives the largest critical field results
(Table 1, Col. 9) of the three formulations, it is the most straightforward
requiring the fewest assumptions on equipartition and source geometry
and requiring only an estimate of the source column density (
formulation generally gives the largest critical field results
(Table 1, Col. 9) of the three formulations, it is the most straightforward
requiring the fewest assumptions on equipartition and source geometry
and requiring only an estimate of the source column density (
![]() ),
the most reliable of our observed parameters. We therefore adopt the
),
the most reliable of our observed parameters. We therefore adopt the
![]() values for comparison to our observational
values for comparison to our observational
![]() field limits
and for the discussion to follow.
field limits
and for the discussion to follow.
In all but one (Orion-KL) of the eight SO sources for which we were
able to calculate the
![]() field values (Table 1, Col. 9) the
observationally determined 3
field values (Table 1, Col. 9) the
observationally determined 3![]()
![]() field limits (three times the
value of Col. 8 in Table 1) fall well below their corresponding
field limits (three times the
value of Col. 8 in Table 1) fall well below their corresponding
![]() values. Even if our SgrB2(N) data does indicate a
values. Even if our SgrB2(N) data does indicate a
![]() field of 1.2 mG,
which we very much question (Sect. 4.2), it is still well below the
field of 1.2 mG,
which we very much question (Sect. 4.2), it is still well below the
![]() of
of ![]() 8 mG of estimated for this region. Moreover, while we
conservatively use 3
8 mG of estimated for this region. Moreover, while we
conservatively use 3![]() values as the upper limit to the
values as the upper limit to the
![]() field in these regions, we are, in fact, confident that the V-spectra
show no magnetic field signatures down even at the 1
field in these regions, we are, in fact, confident that the V-spectra
show no magnetic field signatures down even at the 1![]() level. If
we were to go by the less stringent 1
level. If
we were to go by the less stringent 1![]() criteria, then in
no instance would the observed
criteria, then in
no instance would the observed
![]() magnetic field limits exceed
the critical B field determinations for the sources, whether it is that
of
magnetic field limits exceed
the critical B field determinations for the sources, whether it is that
of
![]() ,
,
![]() or
or
![]() .
.
The 3![]() observed limits for the H
observed limits for the H![]() II regions G10.62 and DR21(OH)
(
II regions G10.62 and DR21(OH)
(
![]() and 6.0 mG, respectively), determined from the OH
and 6.0 mG, respectively), determined from the OH
![]() observations, also fall far short of their
observations, also fall far short of their
![]() values, implying
supercriticality in these clouds. Furthermore, the observations indicate
no fields comparable to that of W3(OH), found in our earlier study.
The SO observations of G5.89 and G10.62 provide even tighter constraints
on the fields in H
values, implying
supercriticality in these clouds. Furthermore, the observations indicate
no fields comparable to that of W3(OH), found in our earlier study.
The SO observations of G5.89 and G10.62 provide even tighter constraints
on the fields in H![]() II regions, with 3
II regions, with 3![]()
![]() limits averaging
1.6 mG. Given the results of this survey, the W3(OH) region - earlier
reported to have a line-of-sight B field of
limits averaging
1.6 mG. Given the results of this survey, the W3(OH) region - earlier
reported to have a line-of-sight B field of ![]() 3 mG in its dense thermal
gas (Güsten et al. 1994) - appears to be the exception, rather than the
norm, in terms of its magnetic field.
3 mG in its dense thermal
gas (Güsten et al. 1994) - appears to be the exception, rather than the
norm, in terms of its magnetic field.
The outflow sources NGC2071A and VLA1623 are the few of its kind
to have been observed in Zeeman studies. Their observations also
provide among the lowest field limits (
![]() (3
(3![]() )
= 0.3 and
0.75 mG) in our study. Unfortunately, we have little
physical information on the NGC2071A and VLA1623 regions -
either from our observations or the literature - and, therefore,
no means of determining any of the critical B field values
(
)
= 0.3 and
0.75 mG) in our study. Unfortunately, we have little
physical information on the NGC2071A and VLA1623 regions -
either from our observations or the literature - and, therefore,
no means of determining any of the critical B field values
(
![]() ,
,
![]() or
or
![]() )
by any of the methods. While
the SO lines measured toward the other eight sources consistently
agree with those of other high density tracers, implying that this
transition traces hugh volume and column densities, according to
chemical/shock models (Neufeld & Dalgarno 1989; Mitchell 1984;
Harquist et al. 1980) and some observations
(Martin-Pintado et al. 1992), compounds such as SO and SiO may
also be strongly enhanced in post shock environments. This is likely
the situation toward VLA1623 and NGC2071A where the SO emision
is enhanced along the edge of the outflow. The critical field
determinations of these regions and their comparison to our
measured field values is thus deferred until the source parameters
are better known.
)
by any of the methods. While
the SO lines measured toward the other eight sources consistently
agree with those of other high density tracers, implying that this
transition traces hugh volume and column densities, according to
chemical/shock models (Neufeld & Dalgarno 1989; Mitchell 1984;
Harquist et al. 1980) and some observations
(Martin-Pintado et al. 1992), compounds such as SO and SiO may
also be strongly enhanced in post shock environments. This is likely
the situation toward VLA1623 and NGC2071A where the SO emision
is enhanced along the edge of the outflow. The critical field
determinations of these regions and their comparison to our
measured field values is thus deferred until the source parameters
are better known.
CCS results
In those dark cloud cores observed by their CCS transition, the thermal
linewidth components correspond to the kinetic temperatures derived
from the NH3 excitation studies (Fiebig 1990), suggesting that
thermal support plays a major role in the stability of these cores.
In such case, the relations for
![]() and
and
![]() discussed
previously (Eqs. (2) and (5), respectively) do not apply. We therefore
take a somewhat different approach from above in estimating and
comparing to the critical field limits of these clouds.
discussed
previously (Eqs. (2) and (5), respectively) do not apply. We therefore
take a somewhat different approach from above in estimating and
comparing to the critical field limits of these clouds.
In Table 2 we characterize the dense cores by their virial expressions
for the gravitational energy
![]() ,
the
kinetic energy
,
the
kinetic energy
![]() ,
and the
magnetic energy
,
and the
magnetic energy
![]() (e.g. Crutcher
1999, with a = 1.2 and b = 0.3 following Mckee et al. 1993).
The physical parameters of the clouds are derived from NH3(Fiebig 1990) and C3H2 studies (Cox et al. 1989; Cox, priv.
comm.). The Jeans,
(e.g. Crutcher
1999, with a = 1.2 and b = 0.3 following Mckee et al. 1993).
The physical parameters of the clouds are derived from NH3(Fiebig 1990) and C3H2 studies (Cox et al. 1989; Cox, priv.
comm.). The Jeans, ![]() ,
is presented in Col. 6 and the thermal
(
,
is presented in Col. 6 and the thermal
(
![]() )
and nonthermal linewidths (
)
and nonthermal linewidths (
![]() )
in Cols. 7 and 8, respectively.
)
in Cols. 7 and 8, respectively.
Within the uncertainties, the mass of the cores compare to their Jeans mass,
the ratio of the kinetic to gravitational energy
![]() is
is ![]() 1,
suggesting that the cores are evolving in approximate equilibrium. If we
assume the non-thermal velocity dispersion,
1,
suggesting that the cores are evolving in approximate equilibrium. If we
assume the non-thermal velocity dispersion,
![]() (Col. 8),
provides some measure of the turbulent field component,
(Col. 8),
provides some measure of the turbulent field component,
![]() ,
then
,
then
![]() (Col. 12). Our observational limits to
the large scale field strength,
(Col. 12). Our observational limits to
the large scale field strength,
![]() ,
as sensitive as they are,
do not allow a critical assessment of any large scale field on the energetics
of the core since
,
as sensitive as they are,
do not allow a critical assessment of any large scale field on the energetics
of the core since
![]() (Col. 13) (assuming
(Col. 13) (assuming
![]() - a statistical approach that may not apply to the small number
of cores observed), i.e.,
- a statistical approach that may not apply to the small number
of cores observed), i.e.,
![]() exceeds
exceeds
![]() by a factor
of
by a factor
of ![]() 6.
6.
The large scale magnetic field
The
![]() upper limits found in this study, most being well below the
critical B field values determined, tend to support the assertion that
the magnetic fields in these dense clouds are supercritical (not
capable of supporting the cloud). However, as with all Zeeman studies
we give the cautionary notice that the sample is limited and there are a
number of factors involved with Zeeman measurements that can cause the
underestimation of the actual B field strength or avoid detection entirely,
such as, (1) the alignment of an ordered magnetic field component out
of the line of sight of the observer, and (2) substantial tangling and
sign reversals of the field within the beam or region sampled by the beam.
Nevertheless, we do not believe that in this study these effects
significantly alter our results or conclusions.
upper limits found in this study, most being well below the
critical B field values determined, tend to support the assertion that
the magnetic fields in these dense clouds are supercritical (not
capable of supporting the cloud). However, as with all Zeeman studies
we give the cautionary notice that the sample is limited and there are a
number of factors involved with Zeeman measurements that can cause the
underestimation of the actual B field strength or avoid detection entirely,
such as, (1) the alignment of an ordered magnetic field component out
of the line of sight of the observer, and (2) substantial tangling and
sign reversals of the field within the beam or region sampled by the beam.
Nevertheless, we do not believe that in this study these effects
significantly alter our results or conclusions.
Because Zeeman line measurements measure the component of the B field
parallel to the line of sight
![]() ,
one can
only infer the total field strength statistically and there is the risk
of missing an ordered field, even a strong one, if oriented sufficiently
close to within the plane of the sky. The total field (B), or total field
limit, is expected to be twice as large on average for a Zeeman derived
sample of randomly oriented fields. It is, however, highly unlikely in a
sufficiently large sample that all the fields observed are fortuitously
aligined such that they avoid detection entirely. Adopting the statistical
methods of Crutcher et al. (1993), we find that the probability of not
detecting any field above the 3
,
one can
only infer the total field strength statistically and there is the risk
of missing an ordered field, even a strong one, if oriented sufficiently
close to within the plane of the sky. The total field (B), or total field
limit, is expected to be twice as large on average for a Zeeman derived
sample of randomly oriented fields. It is, however, highly unlikely in a
sufficiently large sample that all the fields observed are fortuitously
aligined such that they avoid detection entirely. Adopting the statistical
methods of Crutcher et al. (1993), we find that the probability of not
detecting any field above the 3![]() levels obtained, assuming total
field values (
levels obtained, assuming total
field values (
![]() )
at the expected
)
at the expected
![]() levels, is only 0.04%.
levels, is only 0.04%.
Another concern is if the field has complex structure or numerous sign
reversals within the beam, leading to a diluted average of its actual value
or a nondetection. Beam averaging is especially a consideration in HI
Zeeman studies where the beamsizes are typically very large and the
diffuse gas that is being probed is extended, often filling the entire
beam. In this study, however, the CS and NH3 clump sizes (Table 1,
Col. 3), which we take as roughly representative of the SO clump sizes
we observe, are far smaller than the antenna beam FWHM of 63''. We
thus avoid averaging over large spatial areas (few pcs), but only on the
scales of the H![]() II regions, dense cloud cores, or accretion disks
themselves (all sub-parsec except for Sgr B2(N)).
II regions, dense cloud cores, or accretion disks
themselves (all sub-parsec except for Sgr B2(N)).
Unfortunately, very little is known regarding the typical coherence scale
of magnetic fields on the level of dense molecular clouds and their
dense sub-cores. Submillimeter and far infrared polarization studies,
which infer the field direction by the alignment of grains, are one of
the few means of detailing the fields on the scales of protostars (Holland
et al. 1995) and dense condensations. Typical polarization studies have
beamsizes of the order 15'' (the JCMT beam at 800 ![]() m),
comparable to those of the clumps sampled by this study. Such studies
often infer hour-glass shaped fields centered on the condensation,
consistent with theoretical treatments and the idea of an originally
large scale ordered field that is tied to and that is being concentrated
along with the collapsing cloud/subclump. Non-zero polarization values
toward the centralmost or ``pinch'' areas imply coherence even in the
smallest observable regions. Recent polarization studies suggest a few
cases of sharp field reversals, speculated to occur at the boundary
of the dusty stellar disk. We are, however, insensitive to any
changes that may occur at or within the dusty stellar disk since the
gas densities there are far in excess of that being sampled here.
m),
comparable to those of the clumps sampled by this study. Such studies
often infer hour-glass shaped fields centered on the condensation,
consistent with theoretical treatments and the idea of an originally
large scale ordered field that is tied to and that is being concentrated
along with the collapsing cloud/subclump. Non-zero polarization values
toward the centralmost or ``pinch'' areas imply coherence even in the
smallest observable regions. Recent polarization studies suggest a few
cases of sharp field reversals, speculated to occur at the boundary
of the dusty stellar disk. We are, however, insensitive to any
changes that may occur at or within the dusty stellar disk since the
gas densities there are far in excess of that being sampled here.
We concede that the SgrB, the active starforming region in the Galactic
center, is perhaps the one case where we may be failing to detect the field
due to sign reversals in the beam. In a H I Zeeman line study
performed with the VLA (effective resolution of 10''-20''), Crutcher
et al. (1996a) detected a line-of-sight field of
![]() mG that
varies by about a factor of
mG that
varies by about a factor of ![]() 50% across the 1'-diamter complex.
Our failure to detect a field toward the SgrB2 region (
50% across the 1'-diamter complex.
Our failure to detect a field toward the SgrB2 region (
![]() mG)
is not particularly surprising given that this is the one instance where
the emission from the dense gas almost certainly fills our entire 63''beam. The extremely large linewidths observed from some molecules toward
the SgrB region (
mG)
is not particularly surprising given that this is the one instance where
the emission from the dense gas almost certainly fills our entire 63''beam. The extremely large linewidths observed from some molecules toward
the SgrB region (![]() 60 km
60 km![]() s-1) reflect tremendous inputs of mechanical
energy into the gas by means of multiple outflows, expanding shells, etc,
and thus great potential for modification of the field.
s-1) reflect tremendous inputs of mechanical
energy into the gas by means of multiple outflows, expanding shells, etc,
and thus great potential for modification of the field.
Much effort has been expended over the last decade to measure the
magnetic flux to mass (or column density) ratio in dark clouds. The
relatively diffuse clouds (<103 cm-3), or cloud envelopes traced by OH
(1665 and 1667 MHz) and ![]() 21 cmH I line emission,
appear to be critical or at least approximately so in terms of support by
their B fields against collapse (Roberts et al. 1995; Troland
et al. 1995; Crutcher et al. 1993; Goodman et al. 1989).
The matter is
potentially different toward the moderate density clumps (
21 cmH I line emission,
appear to be critical or at least approximately so in terms of support by
their B fields against collapse (Roberts et al. 1995; Troland
et al. 1995; Crutcher et al. 1993; Goodman et al. 1989).
The matter is
potentially different toward the moderate density clumps (
![]() cm-3), where in the handful of sources sampled thus far, the
majority of them (Ori-KL and S106, Crutcher et al. 1996b; B1, Crutcher et al. 1993;
cm-3), where in the handful of sources sampled thus far, the
majority of them (Ori-KL and S106, Crutcher et al. 1996b; B1, Crutcher et al. 1993; ![]() Oph, Troland et al. 1996; SgrB2(N), Crutcher et al.
1996a) have line of sight fields,
Oph, Troland et al. 1996; SgrB2(N), Crutcher et al.
1996a) have line of sight fields,
![]() ,
that on the average
fall a factor of
,
that on the average
fall a factor of ![]() 3 or so below the critical limit. With the stated
uncertainties in mind, we maintain that the observed
3 or so below the critical limit. With the stated
uncertainties in mind, we maintain that the observed
![]() field
limits determined in this study add weight to that implied by the
earlier handful of data points, that the magnetic fields in dense clouds
are supercritical or not capable of supporting those clouds against
collapse.
field
limits determined in this study add weight to that implied by the
earlier handful of data points, that the magnetic fields in dense clouds
are supercritical or not capable of supporting those clouds against
collapse.
There is a great need for more Zeeman observations, coupling to high gas densities, to assess the role the fields play in the late stages of the stellar formation process. Few radicals are known to be suitable and while Crutcher et al. (1996b, 1999) explored the use of CN, we explored the potential of SO and CCS. Despite using the most sensitive telescope available, a dedicated receiver, and spending many hundreds of hours of observation/integration time, we failed to detect any field via the SO and CCS transitions. It is difficult to forsee any technological advancements in the near future that will allow us to approach the critical sensitivity regieme with SO and CCS Zeeman line splitting observations. The more promising approach appears to be follow-up observations of CN, as is being done by Crutcher et al.
Copyright ESO 2001