

Up: Zeeman line splitting measurements
Subsections
The clear result of our initial SO(
 )
survey is that
emission from this transition is detected only towards regions of known
high-density (within our sensitivity limit) - not unexpected in view of
the transition's high critical density of >106-7 cm-3 (Green
1994). It is also observed in two molecular outflows, but this may be
due to chemical enhancement in the molecular column density. The transition
was not detected in Taurus-like dark cloud cores which, however, appeared
strongly in our complementary CCS observations. Conversely, the CCS
emission is weak or absent in warm star forming regions. The line
parameters of the sources observed are presented in Table 2.
)
survey is that
emission from this transition is detected only towards regions of known
high-density (within our sensitivity limit) - not unexpected in view of
the transition's high critical density of >106-7 cm-3 (Green
1994). It is also observed in two molecular outflows, but this may be
due to chemical enhancement in the molecular column density. The transition
was not detected in Taurus-like dark cloud cores which, however, appeared
strongly in our complementary CCS observations. Conversely, the CCS
emission is weak or absent in warm star forming regions. The line
parameters of the sources observed are presented in Table 2.
4.1 Description of the Zeeman candidates
In this section we briefly describe the sources selected for the Zeeman
study, identifying and detailing the specific sub-regions believed coupled
to the observations. We present, in Tables 1 and b, Cols. 2-6, a
compilation of their physical characteristics (temperature, size, column
density, number density, mass) gathered from the literature.
Table 3a:
Source physical parameters (OH and SO observations)
| Source |
|
 |
<size> |
n(H2) |
N(H2) |
Mass |
Ref. |
 |
 |
 |
 |
| |
|
[K] |
[pc] |
[cm-3] |
[cm-2] |
[  ] ] |
|
[mG] |
[mG] |
[mG] |
[mG] |
| |
|
|
|
|
|
|
|
|
|
|
|
| |
|
|
|
|
|
|
|
|
|
|
|
| SO Sources |
|
|
|
|
|
|
|
|
|
|
|
| |
|
|
|
|
|
|
|
|
|
|
|
| W3-IRS4(S) |
(HCN core) |
55 |
0.2 |
8(5) |
2-4(23) |
 200 200 |
19-22 |
0.8 |
2-3 |
1.5 |
1.4 |
| |
|
|
|
|
|
|
|
|
|
|
|
| Orion-KL |
(doughnut) |
200 |
(0.02) |
>1(7) |
few(23) |
5 |
1-4 |
1.5 |
0.8 |
 |
|
| |
|
|
|
|
|
|
|
|
|
|
|
 Oph-B
Oph-B |
(halo) |
15 |
0.075 |
>1(6) |
2(23) |
6 |
11,12 |
0.2 |
1.6 |
>0.5 |
0.3 |
| |
(compact core) |
|
0.03 |
4(6) |
4(23) |
4 |
|
|
3.2 |
0.9 |
0.7 |
| |
|
|
|
|
|
|
|
|
|
|
|
| SgrB2(N) |
(dense ridge) |
100 |
3.5 |
1(5) |
1(24) |
|
8,10 |
0.6 |
8 |
<2.3 |
1.4 |
| |
(compact core) |
150 |
0.16 |
2(7) |
1(25) |
2(3) |
|
|
80 |
<32 |
31 |
| |
|
|
|
|
|
|
|
|
|
|
|
| G5.89 |
|
90 |
0.3 |
2(6) |
4-6(23) |
4-800 |
16-18 |
0.6 |
3-5 |
4.3 |
3.0 |
| |
|
|
|
|
|
|
|
|
|
|
|
| G10.62 |
|
100 |
0.1 |
2-4(6) |
2(24) |
1100 |
13-15 |
0.5 |
16 |
2.1-3.1 |
2.2 |
| |
|
|
|
|
|
|
|
|
|
|
|
| |
|
|
|
|
|
|
|
|
|
|
|
| S140SO |
(SMM2) |
35 |
0.04 |
>4(6) |
>5(23) |
6.5 |
23-25 |
0.4 |
>4 |
>2.1 |
2.8 |
| |
|
|
|
|
|
|
|
|
|
|
|
| NGC7538 |
(20'' E of IRS11) |
50* |
0.20 |
6(5) |
4(23) |
250 |
5-7 |
0.7 |
3.2 |
1.4 |
1.6 |
| NGC2071A |
(outflow) |
|
|
|
|
|
|
0.25 |
|
|
|
| VLA1623 |
(outflow) |
|
|
|
|
|
|
0.1 |
|
|
|
| OH Sources |
|
|
|
|
|
|
|
|
|
| |
| |
|
|
|
|
|
|
|
|
|
| |
| G10.62 |
|
100 |
0.1 |
2-4(6) |
2(24) |
1100 |
13-15 |
1.2 |
16 |
2.1-3.1 |
2.2 |
| |
|
|
|
|
|
|
|
|
|
|
|
| DR21(OH) |
(MM1) |
>80 |
<0.1 |
2-4(7) |
4(24) |
2-300 |
26-29 |
2.0 |
32 |
11-16 |
>6 |
(1) Plambeck et al. (82),
(2) Stutzki et al. (88),
(3) Wright et al. (96),
(4) Blake et al. (87),
(5) Minchin et al. (94),
(6) Sandell (priv. comm.),
(7) Zylka (priv. comm.),
(8) Hüttemeister et al. (93,95)

ref. therein
(10) Vogel et al. (87),
(11) Martin-Pintado et al. (83),
(12) Wadiak et al. (85)
(13) Keto et al. (87)
(14) Hauschildt et al. (93),
(15) Ho et al. (94),
(16) Gomez et al. (91),
(17) Cesaroni et al. (91),
(18) Cesaroni et al. (92),
(19) Helmich et al. (94),
(20) Wright et al. (84),
(21) Tieftrunk et al. (95),
(22) Oldham et al. (94),
(23) Ungerechts et al. (86),
(24) Zhou et al. (94),
(25) Minchin et al. (95),
(26) Mangum et al. (91),
(27) Mangum et al. (92),
(28) Padin et al. (89),
(29) Jones et al. (94).
SO
OH associated with dense star forming cores
Oph-B -- The SO
emission follows closely the
distribution of H2CO ( 2
11 - 212) 2cm emission
(Martin-Pintado et al. 1983) and peaks towards the compact H2CO cores
detected with the VLA (Wadiak et al. 1985). The VLA cores contain
50
2
11 - 212) 2cm emission
(Martin-Pintado et al. 1983) and peaks towards the compact H2CO cores
detected with the VLA (Wadiak et al. 1985). The VLA cores contain
50 of the single-dish flux. The H2CO ridge is 3.2
  0.7
0.7
 in size and the SO spectra throughout this region share a
singular velocity (V = 3.6 km
in size and the SO spectra throughout this region share a
singular velocity (V = 3.6 km s-1) and linewidth (
 kms-1)
identical to that of NH3 line emission observed (Martin-Pintado et al.
1983). Densities in excess of 106 cm-3 are implied by the detection
of the 2cm H2CO line in emission.
kms-1)
identical to that of NH3 line emission observed (Martin-Pintado et al.
1983). Densities in excess of 106 cm-3 are implied by the detection
of the 2cm H2CO line in emission.
SgrB2(N) --
The complex structure of the Sgr-B2 star forming cloud has been characterized
as having three distinct components (see e.g. Hüttemeister et al.
1995, and Ref. therein): embedded in a dense cloud of size
 (
(
 cm-3,
cm-3,
 cm-2,
cm-2,
 K)
there are three prominent compact ultra-dense clumps, referred to as
N(orth), M(id) and S(outh), with volume densities
K)
there are three prominent compact ultra-dense clumps, referred to as
N(orth), M(id) and S(outh), with volume densities
 cm-3 and
column densities as high as 1025 cm-2. The bulk of the mass, however,
is contained in an extended envelope of somewhat lower density
(103 cm-2). Kinematically, it is difficult to discriminate between
the dense ridge and the embedded cores in Sgr B2(N), both sharing bulk
velocities of
cm-3 and
column densities as high as 1025 cm-2. The bulk of the mass, however,
is contained in an extended envelope of somewhat lower density
(103 cm-2). Kinematically, it is difficult to discriminate between
the dense ridge and the embedded cores in Sgr B2(N), both sharing bulk
velocities of
 kms-1 and linewidths of 15 kms-1.
The higher velocity component at 81 kms-1 seen in our SO
spectrum
likely arises from the envelope (Hüttemeister et al. 1995). The SO emission
does not show much of variation between the N and S position, therefore we
tentatively associate the SO gas with the dense ridge. Any contribution
from the ultra-dense cores is difficult to judge with our resolution.
kms-1 and linewidths of 15 kms-1.
The higher velocity component at 81 kms-1 seen in our SO
spectrum
likely arises from the envelope (Hüttemeister et al. 1995). The SO emission
does not show much of variation between the N and S position, therefore we
tentatively associate the SO gas with the dense ridge. Any contribution
from the ultra-dense cores is difficult to judge with our resolution.
G5.89 (W28 A2) -- A bright ultra-compact H
II region, whose
exciting source (equivalent to a O5 ZAMS object) must be very young
and still deeply embedded in its high density parental cloud
(
 cm-3 along its inner edge; Lightfoot
et al. 1984). Associated NH3 emission is confined to within a 5''radius region centered on the main continuum component (Gómez et al. 1991)
and is seen in absorption at velocities of V = 7 kms-1, similar to that of
the observed SO
line. Virial densities compare nicely with the
bulk densities derived from C34S excitation studies (Cesaroni et al.
1991, 1992).
cm-3 along its inner edge; Lightfoot
et al. 1984). Associated NH3 emission is confined to within a 5''radius region centered on the main continuum component (Gómez et al. 1991)
and is seen in absorption at velocities of V = 7 kms-1, similar to that of
the observed SO
line. Virial densities compare nicely with the
bulk densities derived from C34S excitation studies (Cesaroni et al.
1991, 1992).
G10.62 -- Our position is centered on the brightest continuum
source in the G10.62 star forming region. NH3 absorption,
as well as the kinematics of associated gas, imply that the H
II region
is surrounded by a rotating and infalling gaseous core/envelope structure
(Ho & Haschick 1986; Keto et al. 1987). The SO has the same
redshifted velocity as NH3 and H2CO absorption lines (V = 0 kms-1),
identifying this component as the dense infalling material of the surrounding
``core'' foreground to the H
II region. The weak SO emission corresponds
kinematically to the dense core previously observed with the optically
thin and high-gas density sampling C18O (Ho et al. 1994) and C34S
lines (Hauschildt et al. 1993).
W3-IRS4 -- Our position is located 20'' south of IRS4
(the second brightest infrared source in the W3 star forming complex;
Wynn-Williams et al. 1972) and corresponds to the dense core
identified by other molecular tracers (HCN, Wright et al. 1984;
C18O, Oldham et al. 1994; C34S, Tieftrunk et al. 1995)
as well as with one of two maxima in 800  m continuum emission
(Richardson et al. 1989). The velocity and linewidth of the SO emission
are in agreement with those of C18O measured by Tieftrunk et al.
(1995). The nonisotopic CO lines, in contrast, are nonsymmetric,
double peaked, and display larger linewidths ranging between
m continuum emission
(Richardson et al. 1989). The velocity and linewidth of the SO emission
are in agreement with those of C18O measured by Tieftrunk et al.
(1995). The nonisotopic CO lines, in contrast, are nonsymmetric,
double peaked, and display larger linewidths ranging between
 and 18 kms-1 (Hasegawa et al. 1994; Dickel et al. 1980).
Orion-KL --
Following up on the detection of SO emission by Gottlieb et al. (1978), the
interferometric studies by Plambeck et al. (1982) and Wright et al. (1996)
indicated that SO
 emission is localized to
within a
emission is localized to
within a
 region centered on the IRC2 source,
known now as the low-velocity part of the ``plateau'' feature.
Our measurements are consistent with these findings; the SO
line
parameters are similar to those determined by Gottlieb et al., and
substantial emission is recorded only within a single beam centered near
the IRC2 source. Plambeck et al. (1982) hypothesize that the SO emission
arises from an expanding torus which surrounds and perhaps collimates a
bipolar outflow arising from IRC2.
region centered on the IRC2 source,
known now as the low-velocity part of the ``plateau'' feature.
Our measurements are consistent with these findings; the SO
line
parameters are similar to those determined by Gottlieb et al., and
substantial emission is recorded only within a single beam centered near
the IRC2 source. Plambeck et al. (1982) hypothesize that the SO emission
arises from an expanding torus which surrounds and perhaps collimates a
bipolar outflow arising from IRC2.
S140SO -- S140 is a crescent shaped H
II region bordering
the edge of the dark cloud L1204. The SO
emission is centered
15'' north-east of S140-IRS1, the location of strongest C(34)S
(Zhou et al. 1994) and NH3 (Ungerechts et al. 1986) emission.
The SO peak does, however, coincide with SMM2, a dense compact core
identified by its dust continuum emission (Minchin et al. 1995), but not
observed in previous molecular line studies.
NGC7538 IRS11 -- The only position in the NGC7538 star forming
cloud where appreciable SO
emission was detected is offset 20'' east
of the embedded IRS11 source. Towards this position a dense dust core
has been detected (see reference in Minchin et al. 1994). The physical
parameters for this compact core, given in Table 1, are deduced from
unpublished dust continuum observations (Sandell & Zylka, priv. comm.),
assuming T = 50 K.
DR21(OH) -- This position, also referred to as W75S (Wilson &
Mauersberger 1990) and DR21(OH)M, is located 3' north of the DR21 H
II region toward the site of a prominent maser and far IR maximum. DR21(OH)
is toward the strongest of four CS peaks, separated by 30-50'', in the
DR21(OH) region (Chandler et al. 1993). Judging from the velocity of the
OH emission, it arises from the dust core MM1 (Padin et al. 1989).
An exploratory SO observation was also made toward W3(OH) where,
in an earlier OH Zeeman absorption line study, Güsten et al. (1994) found
a 3 mG line-of-sight field within its dense gas at V = -45 kms-1. We indeed
detected SO toward W3(OH), but only in emission, and at a velocity (V =
-47 kms-1) similar to that of a second OH absorption component observed
(in the earlier study) which gave no indication of a magnetic field above a
limit of 0.4mG. We therefore did not integrate further in the
attempt to make an SO Zeeman measurement toward W3(OH). The -47 kms-1 component of gas is apparently distributed in a relatively extended
envelope (2') around the H
II region (Wilson et al. 1991; Dickel
& Goss 1987), whereas the -45 kms-1 component containing the strong Bfield is of somewhat higher density (106.8 cm-3) and more closely
borders the H
II region along its western edge (Wink et al. 1994;
Reid et al. 1987; Guilloteau et al. 1984). So, unfortunately, no
independent confirmation of the earlier OH results has been possible.
SO associated with molecular outflows.
NGC2071A -- We have centered on an SO emission peak, mapped by
Schmid-Burgk & Muders (1994), located 3' northwest of the NGC2071
bipolar outflow (Bally 1982; Snell et al. 1984; Scoville et al. 1986;
Moriarty-Schieven et al. 1989). Both the
 emission lines observed by Schmid-Burgk & Muders and the
emission
lines observed in this study are relatively narrow (
emission lines observed by Schmid-Burgk & Muders and the
emission
lines observed in this study are relatively narrow (
 kms-1),
in contrast to high excitation SO
kms-1),
in contrast to high excitation SO
 emission observed by
Chernin & Masson (1993) which have complex line structure and large
velocity width and are correlated to the ends of the high velocity CO
outflows (Chernin & Masson 1992). The CS emission is distributed
symmetrically, within a 0 0=.00 0=' 005 region, on the cluster of infrared
sources (IRS 1, 2, and 3; Persson et al. 1981) central to the outflow
activity (Zhou et al. 1991). Our position (NGC2071A) is outside of the
region mapped previously by molecular line studies. We detect no SO
line emission towards a second position, NGC2071, 22'' south of IRS 1.
emission observed by
Chernin & Masson (1993) which have complex line structure and large
velocity width and are correlated to the ends of the high velocity CO
outflows (Chernin & Masson 1992). The CS emission is distributed
symmetrically, within a 0 0=.00 0=' 005 region, on the cluster of infrared
sources (IRS 1, 2, and 3; Persson et al. 1981) central to the outflow
activity (Zhou et al. 1991). Our position (NGC2071A) is outside of the
region mapped previously by molecular line studies. We detect no SO
line emission towards a second position, NGC2071, 22'' south of IRS 1.
VLA1623 -- A compact VLA continuum source and class 0
protostellar candidate centered on well-collimated molecular outflow, the
only such flow found in the -Oph starforming complex to date
(André et al. 1993; André et al. 1990). Our
position is toward the tip of the 2'-scale redshifted molecular lobe.
Indeed, the SO
spectrum appears to be slightly asymmetric, perhaps
possessing a modest redward tail. The FWHM of the SO line is 0.8 kms-1. By
comparison, the 12CO spectra (André et al. 1990) associated with the
molecular flow have velocity widths on the order of
 8 kms-1 and are likely blends of several velocity components. Also
coinciding with our position is the bright infrared source GSS30
(Graasdalen et al. 1973).
8 kms-1 and are likely blends of several velocity components. Also
coinciding with our position is the bright infrared source GSS30
(Graasdalen et al. 1973).
CCS towards dark cloud cores
From our survey of dark cloud cores in the Orion and Taurus region we
selected three dark cores for deep Zeeman integrations: L1498, TMC-1C,
and TMC-1SE. To identify the best suited positions (strongest lines
with cleanest possible Gaussian profiles) the cores were first mapped
in the CCS(
 )
transition at 22.34 GHz (42'' angular
resolution). Their kinetic temperatures were determined using
observations of their lower NH3 rotational transitions (Fiebig 1990) and
their H2 densities were estimated from a multi-transition study of
C3H2 (Cox et al. 1989; Cox, priv. comm.) (Table 2, Col. 4).
)
transition at 22.34 GHz (42'' angular
resolution). Their kinetic temperatures were determined using
observations of their lower NH3 rotational transitions (Fiebig 1990) and
their H2 densities were estimated from a multi-transition study of
C3H2 (Cox et al. 1989; Cox, priv. comm.) (Table 2, Col. 4).
We detect no line-of-sight magnetic field (
 )
above the 3
)
above the 3 uncertainty level toward any of the sources observed, either by their
SO
OH
uncertainty level toward any of the sources observed, either by their
SO
OH
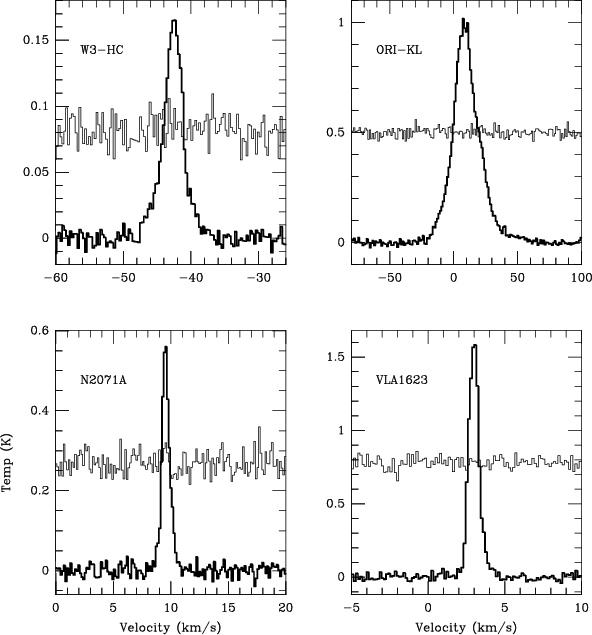
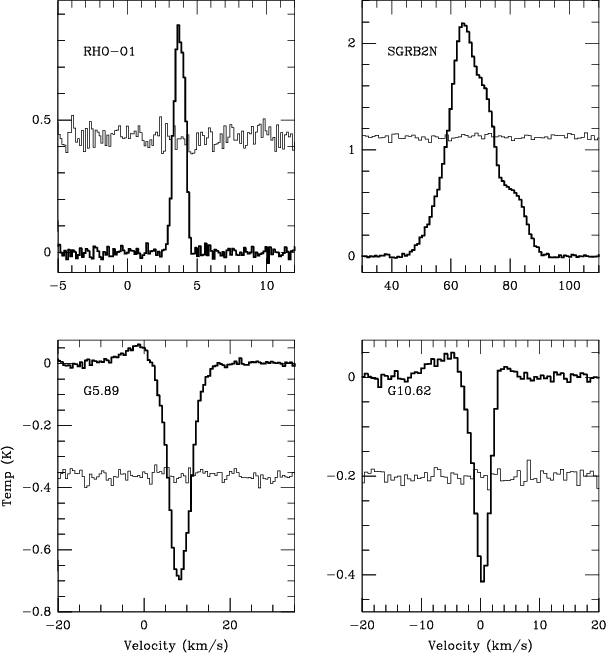
 or CCS line emission/absorption. Figures 1a-c display
the Stokes-V and Stokes-I spectra for the SO line. With exception only
to SgrB2(N), no large-scale deviations in the V-spectra are seen within
the velocity limits of their respective lines. The SgrB2(N) displays
a signature in its V-spectrum consistent with a field at the 1
level (
or CCS line emission/absorption. Figures 1a-c display
the Stokes-V and Stokes-I spectra for the SO line. With exception only
to SgrB2(N), no large-scale deviations in the V-spectra are seen within
the velocity limits of their respective lines. The SgrB2(N) displays
a signature in its V-spectrum consistent with a field at the 1
level (
 mG). The broadness and complex shape of
the line, however, makes its interpretation difficult at this level.
mG). The broadness and complex shape of
the line, however, makes its interpretation difficult at this level.
In Table 2, Col. 9, we present the 1
limits on V/I. In
Table 1 (Col. 8) and 2 (Col. 9), the corresponding 1
limit
on the magnetic field strength
 for each region is given.
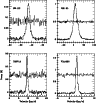 |
Figure 1:
The SO
Stokes-V difference spectra (thin solid line)
and the Stokes-I total power spectra (thick line) toward the sources
indicated in upper left corner of each panel. Note that there is no
sign in any of the Stokes-V spectra of a Zeeman response above the
level of the noise |
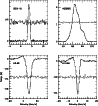 |
Figure 2:
The SO
Stokes-V difference spectra (thin solid line)
and the Stokes-I total power spectra (thick line) toward the sources
indicated in upper left corner of each panel. Note that, with
exception of SgrB2(N) (which is marginal), there is no sign in any of
the Stokes-V spectra of a Zeeman response above the level of the noise |
![\begin{figure}]%
\resizebox{8.6cm}{!}{\includegraphics{so3.eps}} \end{figure}](/articles/aa/full/2001/19/aa10420/Timg79.gif) |
Figure 3:
The SO
Stokes-V difference spectra (thin solid line)
and the Stokes-I total power spectra (thick line) toward the sources
indicated in upper left corner of each panel. Note that there is no
sign in any of the Stokes-V spectra of a Zeeman response above the
level of the noise |
Up: Zeeman line splitting measurements
Copyright ESO 2001
![\begin{figure}]%
\resizebox{8.6cm}{!}{\includegraphics{so3.eps}} \end{figure}](/articles/aa/full/2001/19/aa10420/img79.gif)