Present day instrumentation allows accurate measurements of the luminosities and global HI profiles of galaxies. In general, the observed scatter in the TF-relation is larger than can be explained by the observational uncertainties in these measured parameters alone. However, the uncertainty in corrections sensitive to inclination contribute significantly to the observed scatter. For a sample of randomly oriented galaxies more inclined than 45 degrees, an uncertainty of 1, 3 or 5 degrees in the inclination angle contributes respectively 0.04, 0.12 or 0.19 magnitudes to the scatter due to the uncertainty in line widths alone, assuming a slope in the TF-relation of -10. Therefore, it is important to determine the inclination angle of a galaxy as accurate as possible and this issue deserves some special attention.
From the photometric and HI synthesis data available, three independent
measurements of the inclination angle of a galaxy can in principle be
obtained;
![]() from the optical axis ratio,
from the optical axis ratio,
![]() from the apparent ellipticity of the HI disk, and
from the apparent ellipticity of the HI disk, and
![]() from fitting tilted rings to the
HI velocity field. Each of these methods has its own systematic
limitations which are important to recognize when estimating the actual
inclination of a galaxy. In the following discussion we will briefly
address those limitations and make an intercomparison of
from fitting tilted rings to the
HI velocity field. Each of these methods has its own systematic
limitations which are important to recognize when estimating the actual
inclination of a galaxy. In the following discussion we will briefly
address those limitations and make an intercomparison of
![]() ,
,
![]() ,
and
,
and
![]() .
.
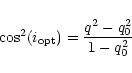
The most widely used formula to infer the inclination angle from the
observed optical axis ratio
![]() was provided by
Hubble (1926):
was provided by
Hubble (1926):
![\begin{figure}
\par\includegraphics[width=8cm,clip]{fig3.ps}\end{figure}](/articles/aa/full/2001/18/aa10469/img195.gif) |
Figure 3:
Intercomparison of the three independently determined inclination angles
|
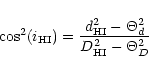
Apart from the oblate stellar disk, the HI disk can also be used to
determine the inclination. In general, the HI disk is much thinner than
the stellar disk and its intrinsic thickness is of no concern. However,
its patchiness, lopsidedness and the existence of warps and tidal tails
may complicate the interpretation of the results from fitting ellipses
to a certain HI isophote. Here, no correction for the intrinsic
thickness of the HI layer was applied. However, the relatively large
synthesized beams of imaging arrays at 21 cm may smear the observed HI
disks to a rounder appearance. Therefore, a simple correction for beam
smearing was applied to our measurements and the inclination of the HI disk was determined according to
The inclination angle of an HI disk can also be measured by fitting
tilted-rings to its velocity field (Begeman 1989). However,
the inclination angle and the rotational velocity are strongly coupled
and reasonable results can only be obtained for inclination angles
between roughly 50 and 75 degrees. This procedure requires accurate
velocity fields with high signal-to-noise ratios as well as many
independent points along a ring. The advantage that velocity fields
offer is the possibility to identify warps and to check the kinematic
regularity of the HI disk. For instance, the optical appearance of a
galaxy may look very regular while the outer regions of the HI disk may
be strongly warped toward edge-on (e.g. N3726). Such a warp would broaden
the global profile and an inclination correction based on the optical
axis ratio would lead to an overestimate of the rotational velocity when
dividing the "warp-broadened'' line width by
![]() .
Note that the inclination measurement of a tilted ring may be affected by
non-circular motions due to spiral arms, bars and lopsidedness.
.
Note that the inclination measurement of a tilted ring may be affected by
non-circular motions due to spiral arms, bars and lopsidedness.
For the comparison between the three differently inferred inclination angles we considered only those 27 galaxies with fully reduced HI data for which the velocity fields and integrated HI maps are available. We excluded the interacting galaxies (N3769, N3893, U6973) because their outer isophotes (optical and HI) are affected by tidal tails. We also excluded galaxies with perturbed or inadequately sampled velocity fields (N4088, U6969, N4389), galaxies with excessively patchy HI maps (N4102) and obviously lopsided galaxies (N4051). These eliminations leave us with 19 galaxies that have smooth outer isophotes, well filled HI disks and regular HI velocity fields.
Figure 3 presents the comparison between the three differently inferred
inclination angles using two different values for q0. When
calculating mean differences and scatters using
![]() ,
only galaxies with
,
only galaxies with
![]() are considered because kinematic inclinations of highly inclined galaxies are
systematically underestimated. The error bars on
are considered because kinematic inclinations of highly inclined galaxies are
systematically underestimated. The error bars on
![]() are based on the variations
in
are based on the variations
in
![]() between the various fitted rings but are not
considered any further here.
between the various fitted rings but are not
considered any further here.
The upper most panel compares
![]() with
with
![]() .
No significant offset is found for the
14 galaxies that meet the above-mentioned criteria. Assuming that
.
No significant offset is found for the
14 galaxies that meet the above-mentioned criteria. Assuming that
![]() and
and
![]() contribute
equally to the scatter of 3.1 degrees implies that the inclination angle
can be determined with an accuracy of 2.2 degrees from either the
velocity fields or from the inclined HI disk. Note that the correlation
turns up for
contribute
equally to the scatter of 3.1 degrees implies that the inclination angle
can be determined with an accuracy of 2.2 degrees from either the
velocity fields or from the inclined HI disk. Note that the correlation
turns up for
![]() due to the
systematic underestimation of
due to the
systematic underestimation of
![]() for highly
inclined disks.
for highly
inclined disks.
Comparing
![]() with
with
![]() and
and
![]() does show a significant offset of
roughly 3 degrees when assuming q0=0.20 (middle panels). This offset
is biggest toward edge-on as would be expected in case of an
overestimate of the intrinsic thickness. Note that there are several
galaxies with an observed optical axis ratio less than 0.20 which have
been assigned an inclination angle of
does show a significant offset of
roughly 3 degrees when assuming q0=0.20 (middle panels). This offset
is biggest toward edge-on as would be expected in case of an
overestimate of the intrinsic thickness. Note that there are several
galaxies with an observed optical axis ratio less than 0.20 which have
been assigned an inclination angle of ![]() .
.
This 3![]() offset disappears when q0=0.09 is used (lower panels)
and the rms scatter is reduced to only 1.9 degrees for
offset disappears when q0=0.09 is used (lower panels)
and the rms scatter is reduced to only 1.9 degrees for
![]() versus
versus
![]() but is
still 4.0 degrees in case of
but is
still 4.0 degrees in case of
![]() versus
versus
![]() .
In the latter case, the scatter is caused
by a few nearly edge-on systems for which the higher uncertainties have
no influence on the deprojection of the rotational velocities.
.
In the latter case, the scatter is caused
by a few nearly edge-on systems for which the higher uncertainties have
no influence on the deprojection of the rotational velocities.
The adopted inclinations and their errors, listed in Col. 11 of Table 1 are best estimates based on all the information available for a particular galaxy, including the morphology of dust lanes if present. For galaxies which lack fully reduced HI synthesis data, the inclination angles were inferred from the optical axis ratios using q0=0.09 for galaxies of type Sc and later and q0=0.24 for galaxies of type Sbc and earlier. The latter value of q0 seemed justified by the observed axis ratios of the (nearly) edge-on systems N4013, N4026 and N4111 of types Sb, S0 and S0 respectively. Unfortunately, there are not enough suitable galaxies available to determine q0 as a function of morphology.
Copyright ESO 2001
![\begin{figure}
\par\includegraphics[width=7.5cm,clip]{fig4.ps}\end{figure}](/articles/aa/full/2001/18/aa10469/img206.gif)