| Issue |
A&A
Volume 537, January 2012
|
|
|---|---|---|
| Article Number | A92 | |
| Number of page(s) | 7 | |
| Section | Galactic structure, stellar clusters and populations | |
| DOI | https://doi.org/10.1051/0004-6361/201118053 | |
| Published online | 13 January 2012 | |
Online material
Appendix A: Background model
The background model used in K07 was slightly changed in this study. Since the GLS observations were performed over a relatively short time period, we removed the long-term time part from the equation. Instead of using the gain parameter to trace orbital modulations of the background rate, we used the spacecraft orbital phase P in a quadratic polynomial form. Hereafter, we consider only the detector count rates after removal of the contribution of point sources. The model of the detector background 25–60 keV count rate, Dbgd, is made of a linear combination of the 600–1000 keV detector count rate, H, and phase  (A.1)The coefficient a was calculated using observations pointed away from the Galactic plane (|b| > 20°) where the GRXE is not expected to be observed (see Table 1). The constant term and b coefficients were determined individually for each spacecraft orbit from the observations at |b| > 20°, thus adjusting the model to the current background level. In fact, the constant term in Eq. (A.1) contains contribution from CXB and unknown intrinsic detector background. The last is also variable, which is traced by variability of this constant with time. In the current observations, its absolute value varies in the range of 800–900 mCrab from orbit to orbit, while permanent CXB contribution is expected to be at level of 550 mCrab (Appendix B). Finding the difference between the observed and predicted by Eq. (A.1) detector count rate should yield the GRXE excess in the Galactic plane.
The detector count rate was converted to the convenient units of Crab flux, with 1 mCrab = 7.25 × 10⁻⁶ cts/s in the 25–60 keV band per IBIS FOV. The conversion coefficient was determined from observations of the Crab nebula in 2010 (Table 1). A flux of 1 mCrab in the 25–60 keV energy band corresponds to 9.7 × 10⁻¹² erg s-1 cm-2 for a source with a Crab-like spectrum,  phot cm-2 s-1 keV-1.
Appendix B: CXB cosmic variance
The CXB emission coming from the population of unresolved extragalactic sources (active galactic nuclei, AGNs) is subject to Poissonian variations in the number of sources, intrinsic source variability, and nearby large-scale structure (see e.g. Fabian & Barcons 1992). Here, we estimate the systematic limitations to the measured GRXE flux caused by CXB variations.
Using the extragalactic log N–log S relation from Krivonos et al. (2010b) and following Revnivtsev et al. (2008), we estimated the relative uncertainty of the CXB flux in the 25–60 keV band as  (B.1)where Smax,11 is the maximum flux of undetected sources in units of 10-11 erg s-1 cm-2, and Ωdeg ≈ 286 is the effective solid angle of the IBIS telescope. We adopted the CXB intensity to be equal to 1.89 × 10⁻¹¹ erg s-1 cm-2 deg-2, based on the CXB spectrum model of Gruber et al. (1999) and the ~10% higher normalization measured by INTEGRAL (Churazov et al. 2007). Using the limiting flux of the survey Eq. (B.1) yields a CXB variance at the level of ~0.4%. The absolute value is 2.3 mCrab assuming a ~550 mCrab CXB flux per IBIS FOV. In the current work, we consider the CXB variance for an area of three IBIS FOVs, which approximately corresponds to the effective area of the GA survey.
Appendix C: Uncertainty in GRXE measurements
The uncertainty of the background model, i.e. the accuracy of the ISGRI background rate prediction, is subject to statistical and systematical errors. The former can be easily estimated from the total number of counts (~3 × 10⁵) in the 25–60 keV energy band per typical ScW (~2 ks).
The additional statistical effect is related to the IROS procedure, when the count rate attributed to a given source is removed from the detector using the known aperture function of the mask. To a first approximation, the total number of counts, S, associated with a given source is determined as the difference between the number of counts, D1, in the detector pixels illuminated by the source through the mask and the number of counts, D0, in the detector pixels blocked by the mask: S = D1 − D0. The total flux on the detector is D = D0 + D1. Thus, subtracting the contribution of the source yields the residual detector flux D′ = D − S = 2D0. For a weak source in the center of the field of view, D0 ≈ D1 ≈ 1/2 × D and therefore the relative statistical uncertainty of measuring the detector count rate  increases by a factor of
  . In practice, a more complicated model of a point source (see K07), implemented in the source subtraction algorithm, causes an even larger increase of statistical uncertainties.
To estimate the IROS induced uncertainty as a function of number of sources in the FOV, we studied a set of 22 consecutive observations without cataloged and detected sources (orbit 973, ScWs 58–80). The relative standard deviation of detector count rate, as a function of the number of simulated sources, Nsrc, is shown in Fig. C.1. The first point at Nsrc = 0, RMS = 0.3%, reflects the relative statistical scatter of the data. As seen from Fig C.1, the scatter rapidly increases with inclusion of sources in the FOV. A typical scatter of ~1.0% on the ScW time scale is observed in real data, as demonstrated in Sect. 4.
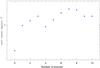 |
Fig. C.1
Relative root-mean-squared value of the detector rate as a function of number of sources in the FOV. |
| Open with DEXTER | |
To estimate the systematic uncertainty of the method, we defined coefficients of the background model in Eq. (A.1) using the high-latitude observations (see Table 1) in the South Galactic hemisphere (700 ks) and applied it to the North (5.3 Ms). The non-existent GRXE flux was averaged over a given INTEGRAL orbit divided into the three equal intervals having three parts: one in the middle and two adjacent, see Fig. C.2 for reference. The middle part of each interval (in red) was supposed to have GRXE flux, and the neighboring parts (in blue) were used to correct the constant term (Eq. (A.1)). This set-up mimics the GLS pattern of observations.
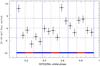 |
Fig. C.2
Residuals after subtracting the model-predicted count rate from the observed count rate for the 5.3 Ms high-latitude observations averaged over spacecraft orbital phase. The black dashed lines represent a 1σ deviation (4.0 mCrab) of the averaged values from zero. Blue and red regions denote different phase intervals used for background model calibration and actual measurements, respectively. |
| Open with DEXTER | |
The standard deviation of residuals from zero represents the systematic uncertainty of our background model, which is found to be ~ 4.0 mCrab. The 25–60 keV detector count rate increased from ~2.2 to ~2.5 Crab over the considered time period, hence the relative accuracy of the model is ~0.17% of the observed background rate.
We summarize all the discussed uncertainties related to the GRXE measurements in the 25–60 keV energy band. The values below are presented with respect to the background rate, which is assumed to be 2.5 Crab. Statistical uncertainties:
-
0.18% (4.5 mCrab) – count statistics, expected for 3 × 10⁵ counts per typical ScW (~2 ks),
-
0.30% (7.5 mCrab) – count statistics, observed in a typical ScW without any sources in the FOV. Since this value differs from the expected, it cannot be fully statistical. Some unexplored systematics or background variability can contribute to the scatter of the observed detector count rate.
-
1.00% (25 mCrab) – observed in a typical ScW with several sources in the FOV, related to the IROS procedure.
-
0.16% (4.0 mCrab) – root-mean-squared residuals after background model subtraction from the observed count rate (Fig. C.2),
-
0.09% (2.3 mCrab) – CXB variance per IBIS FOV,
-
0.16% (4.0 mCrab) – CXB variance per GA survey area.
© ESO, 2012
Current usage metrics show cumulative count of Article Views (full-text article views including HTML views, PDF and ePub downloads, according to the available data) and Abstracts Views on Vision4Press platform.
Data correspond to usage on the plateform after 2015. The current usage metrics is available 48-96 hours after online publication and is updated daily on week days.
Initial download of the metrics may take a while.