Fig. 1
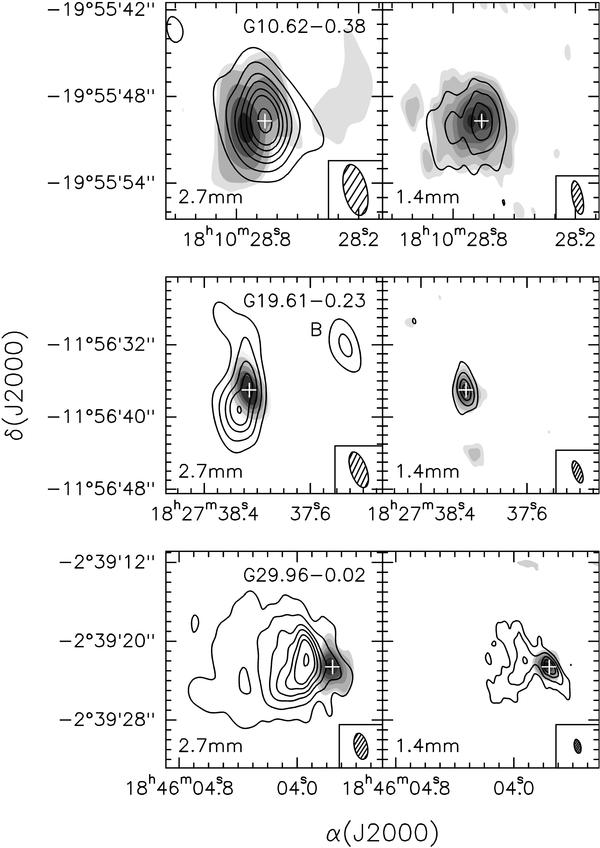
Overlay of the PdBI maps of the 2.7 mm (left panels) and the 1.4 mm (right panels) continuum emission (contours) on the CH3CN (6–5) emission (grayscale) averaged under the K = 0, 1, 2, 3, and 4 components (left panels) and CH3CN (12–11) emission (grayscale) averaged under the K = 0, 1, 2, and 3 components (right panels) towards the cores G10.62–0.38, G19.61–0.23, and G29.96–0.02. The contour levels are 3, 9, 18, 27, 39, 51, and 75 times σ, where 1σ is 17 mJy beam-1 at 2.7 mm and 26.7 mJy beam-1 at 1.4 mm for G10.62−0.38, 6 mJy beam-1 at 2.7 mm and 33.3 mJy beam-1at 1.4 mm for G19.61−0.23, and 3 mJy beam-1 at 2.7 mm and 6.7 mJy beam-1 at 1.4 mm for G29.96−0.02. Grayscale levels are 3, 5, 10, 15, 20, 30, and 40 times (36 for G10) σ, where 1σ is 15 mJy beam-1 at 2.7 mm and 15 mJy beam-1 at 1.4 mm for G10, 30 mJy beam-1 at 2.7 mm and 50 mJy beam-1 at 1.4 mm for G19, and 15 mJy beam-1 at 2.7 mm and 65 mJy beam-1 at 1.4 mm for G29. The synthesized beam is shown in the lower righthand corner. The white cross marks the position of the 1.4 mm continuum emission peak. The source B seen towards G19.61−0.23 at 2.7 mm is the UC Hii region B observed by Furuya et al. (2005).
Current usage metrics show cumulative count of Article Views (full-text article views including HTML views, PDF and ePub downloads, according to the available data) and Abstracts Views on Vision4Press platform.
Data correspond to usage on the plateform after 2015. The current usage metrics is available 48-96 hours after online publication and is updated daily on week days.
Initial download of the metrics may take a while.