| Issue |
A&A
Volume 562, February 2014
|
|
|---|---|---|
| Article Number | A77 | |
| Number of page(s) | 22 | |
| Section | Interstellar and circumstellar matter | |
| DOI | https://doi.org/10.1051/0004-6361/201322646 | |
| Published online | 07 February 2014 | |
Online material
Appendix A: Observational data
The observational log can be found in Table A.1 and the channel maps of all the observed lines toward the four sources are shown in Figs. A.1–A.6.
Observational log.
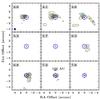 |
Fig. A.1
13CO 2–1 channel maps similar to Fig. 4 toward TMC1. |
| Open with DEXTER | |
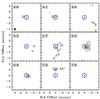 |
Fig. A.2
C18O 2–1 channel maps similar to Fig. 4 toward TMC1. |
| Open with DEXTER | |
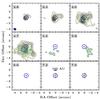 |
Fig. A.3
13CO 2–1 channel maps similar to Fig. 4 toward TMR1. |
| Open with DEXTER | |
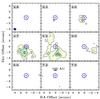 |
Fig. A.4
C18O 2–1 channel maps similar to Fig. 4 toward TMR1. |
| Open with DEXTER | |
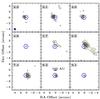 |
Fig. A.5
13CO 2–1 channel maps similar to Fig. 4 toward L1536. |
| Open with DEXTER | |
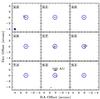 |
Fig. A.6
C18O 2–1 channel maps similar to Fig. 4 toward L1536. |
| Open with DEXTER | |
Appendix B: Large-scale structure
The parameters of the large-scale envelope structure used to estimate the continuum emission at short baselines are in Table B.1.
1D spherical envelope parameters as published by Kristensen et al. (2012).
Appendix C: WideX data
Spectra toward all sources integrated within a 3″ box around their continuum positions are shown in Fig. C.1. The integrated flux density maps toward C18O, SO 56−45 and SO2 11111−100010 (221.96521 GHz) are shown in Fig. C.3. The SO emission toward all sources is much more extended compared to the C18O emission, while the SO2 emission is compact.
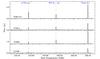 |
Fig. C.1
Integrated flux of C18O J = 2–1, SO 56–45 and 13CO J = 2–1 within a 3″ box around each source in the WideX spectra. |
| Open with DEXTER | |
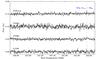 |
Fig. C.2
Integrated flux within a 1″ box around each source in the WideX spectra between 220.7–222.1 GHz. |
| Open with DEXTER | |
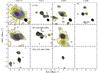 |
Fig. C.3
Moment 0 maps of C18O J = 2–1, SO 56–45 and SO2 11111−100010 toward all sources from the WideX data. The contours are drawn at 10% of the peak starting at 3σ. Green star indicates the continuum position and black ellipses show the synthesized beams. |
| Open with DEXTER | |
Appendix D: L1536
Figure D.1 shows the 12CO J = 3–2 spectral map obtained with JCMT, where there is no indication of classical bipolar outflows are present.
 |
Fig. D.1
12CO J = 3–2 spectral map obtained with the JCMT from –5 km s-1 to 15 km s-1 and intensities from –0.5 K to 3.5 K. The vertical dotted lines show 0, 5.2, and 10 km s-1 for guidance. |
| Open with DEXTER | |
© ESO, 2014
Current usage metrics show cumulative count of Article Views (full-text article views including HTML views, PDF and ePub downloads, according to the available data) and Abstracts Views on Vision4Press platform.
Data correspond to usage on the plateform after 2015. The current usage metrics is available 48-96 hours after online publication and is updated daily on week days.
Initial download of the metrics may take a while.