A&A 490, 265-277 (2008)
DOI: 10.1051/0004-6361:200810169
The core helium flash revisited
I. One and two-dimensional hydrodynamic simulations
M. Mocák - E. Müller - A. Weiss - K. Kifonidis
Max-Planck-Institut für Astrophysik, Postfach 1312, 85741 Garching, Germany
Received 9 May 2008 / Accepted 5 August 2008
Abstract
Context. We investigate the hydrodynamics of the core helium flash close to its peak. Past research concerned with the dynamics of this event is inconclusive. However, the most recent multidimensional hydrodynamic studies suggest a quiescent behavior and seem to rule out an explosive scenario.
Aims. Depending on initial conditions, turbulence models, grid resolution, and dimensionality of the simulation, previous work indicated that the core helium flash could lead either to the disruption of a low-mass star or to a quiescent quasi-hydrostatic evolution. We attempt to clarify this issue by simulating the evolution with advanced numerical methods and detailed microphysics.
Methods. Assuming spherical or axial symmetry, we simulate the evolution of the helium core of a
 star with a metallicity Z=0.02 during the core helium flash at its peak with a grid-based hydrodynamical code.
Results. We find that the core helium flash neither rips the star apart, nor significantly alters its structure, since convection plays a crucial role in keeping the star in hydrostatic equilibrium. In addition, our simulations indicate the presence of overshooting, which implies new predictions concerning mixing of chemical species in red giants.
Key words: stars: evolution - hydrodynamics - convection - stars: interiors
In stars of mass 0.7

 2.2
,
the onset of helium burning constitutes a major event - the core helium flash. The pre-flash stellar core contains a white dwarf-like degenerate structure with a central density of about 106 g cm-3, and an off-center temperature maximum resulting from plasma- and photo-neutrino cooling. When helium burning commences in this
degenerate core, the liberated nuclear energy cannot be used to expand and cool the layers close to the temperature maximum. Instead it causes further heating and a strong increase in the nuclear energy release. Only when convection sets in can part of the excess energy be transported away from the burning regions, inhibiting a thermonuclear explosion. By the end of the flash, the core has
expanded to densities of the order of 104 g cm-3, helium burning continues quiescently in the center, and the star has settled onto the horizontal branch. While standard stellar evolution calculations have been successful in reproducing observations of stars on the main sequence
and the red giant branch (RGB), we recognize several discrepancies concerning the post-flash phases. In particular, we recall the lack of understanding about the horizontal-branch morphology,
low-luminosity carbon stars, and hydrogen-deficient stars. Since all of these (and other) problems appear after the RGB phase, it is plausible to suspect that the helium flash may be treated incorrectly in standard (hydrostatic) stellar evolution calculations.
2.2
,
the onset of helium burning constitutes a major event - the core helium flash. The pre-flash stellar core contains a white dwarf-like degenerate structure with a central density of about 106 g cm-3, and an off-center temperature maximum resulting from plasma- and photo-neutrino cooling. When helium burning commences in this
degenerate core, the liberated nuclear energy cannot be used to expand and cool the layers close to the temperature maximum. Instead it causes further heating and a strong increase in the nuclear energy release. Only when convection sets in can part of the excess energy be transported away from the burning regions, inhibiting a thermonuclear explosion. By the end of the flash, the core has
expanded to densities of the order of 104 g cm-3, helium burning continues quiescently in the center, and the star has settled onto the horizontal branch. While standard stellar evolution calculations have been successful in reproducing observations of stars on the main sequence
and the red giant branch (RGB), we recognize several discrepancies concerning the post-flash phases. In particular, we recall the lack of understanding about the horizontal-branch morphology,
low-luminosity carbon stars, and hydrogen-deficient stars. Since all of these (and other) problems appear after the RGB phase, it is plausible to suspect that the helium flash may be treated incorrectly in standard (hydrostatic) stellar evolution calculations.
The conceptual problems associated with the helium core flash arise from the extremely short timescales involved in the event. While the pre-flash evolution proceeds on a nuclear timescale of  108 yrs, typical e-folding times for the energy release from helium burning can become as short as hours at the peak of the flash. These short times are comparable to convective turnover times, i.e.the common assumptions used for the treatment of convection in stellar
evolution codes (instantaneous mixing, time-independence) are no longer valid. In addition, the assumption of hydrostatic equilibrium no longer needs to be fulfilled. Early attempts to avoid these assumptions by modeling one-dimensional hydrodynamic flow (Wickett 1977; Edwards 1969; Zimmermann 1970; Villere 1976) remained inconclusive. The results ranged from a confirmation of the standard picture to a complete disruption of the star.
108 yrs, typical e-folding times for the energy release from helium burning can become as short as hours at the peak of the flash. These short times are comparable to convective turnover times, i.e.the common assumptions used for the treatment of convection in stellar
evolution codes (instantaneous mixing, time-independence) are no longer valid. In addition, the assumption of hydrostatic equilibrium no longer needs to be fulfilled. Early attempts to avoid these assumptions by modeling one-dimensional hydrodynamic flow (Wickett 1977; Edwards 1969; Zimmermann 1970; Villere 1976) remained inconclusive. The results ranged from a confirmation of the standard picture to a complete disruption of the star.
Cole & Deupree (1981,1980) performed a two-dimensional hydrodynamic study of the core helium flash. However, their study was limited by the computational resources available at that time to a rather coarse computational grid (23  4 zones), a diffusive first-order difference scheme (weighted donor cell), and a short time evolution (105 s compared to the duration of the core helium flash of 1011 s from the onset of convection). At the radius of the off-center temperature maximum, they observed a series of thermonuclear runaways where heat transport by convection and conduction was sufficiently efficient to limit the rise in temperature. Each runaway modified the convective flow pattern and generated some inward transport of heat across the off-center temperature inversion. During the simulation, the time interval between runaways
continuously shortened, and the maximum temperature steadily increased
until it eventually exceeded 109 K.
4 zones), a diffusive first-order difference scheme (weighted donor cell), and a short time evolution (105 s compared to the duration of the core helium flash of 1011 s from the onset of convection). At the radius of the off-center temperature maximum, they observed a series of thermonuclear runaways where heat transport by convection and conduction was sufficiently efficient to limit the rise in temperature. Each runaway modified the convective flow pattern and generated some inward transport of heat across the off-center temperature inversion. During the simulation, the time interval between runaways
continuously shortened, and the maximum temperature steadily increased
until it eventually exceeded 109 K.
Deupree & Cole (1983) and (Deupree 1984b,a) confirmed these findings using two-dimensional models with an improved angular resolution (
 instead of
 ), and
three-dimensional simulations (with 8
8 angular zones in a
), and
three-dimensional simulations (with 8
8 angular zones in a
 cone, i.e.
 angular resolution). Cole et al. (1985) performed stellar evolution calculations of the core helium flash using a model for convective overshooting based
on these hydrodynamic simulations. They found that the evolution of the core helium flash was unchanged except for the last week prior to its peak. Furthermore, the possibility of the mixing of core material into the hydrogen shell was suggested by numerical experiments where point source explosions were enforced (Deupree 1984b,1986; Deupree & Wallace 1987). These results
raised the hope that some problems concerning abundance anomalies and
mass loss could be solved by understanding the core helium flash.
angular resolution). Cole et al. (1985) performed stellar evolution calculations of the core helium flash using a model for convective overshooting based
on these hydrodynamic simulations. They found that the evolution of the core helium flash was unchanged except for the last week prior to its peak. Furthermore, the possibility of the mixing of core material into the hydrogen shell was suggested by numerical experiments where point source explosions were enforced (Deupree 1984b,1986; Deupree & Wallace 1987). These results
raised the hope that some problems concerning abundance anomalies and
mass loss could be solved by understanding the core helium flash.
The results of the hydrodynamic simulations, though varying in details, indicated a dynamic flash that could disrupt the star (Deupree 1984a) or at least lead to a significant loss of the
envelope (Cole & Deupree 1981). The simulations were critized by Iben & Renzini (1984) and Fujimoto et al. (1990) because (i) the radial grid was too coarse; (ii) the gravitational potential was ``frozen in'' (i.e.time-independent); and (iii) because a ``closed''
outer boundary was used. The last two assumptions tend to underestimate the expansion of the core, and hence overestimate the violence of the flash.
![\begin{figure}
\par\includegraphics[width=7cm,clip]{0169fg11.eps}\end{figure}](/articles/aa/full/2008/40/aa10169-08/Timg53.gif) |
Figure 1:
Theoretical evolutionary track of a 1.25  star with a metallicity Z=0.02 in the H-R diagram. The core helium flash begins at the the tip of the red giant branch indicated
by the arrow.
star with a metallicity Z=0.02 in the H-R diagram. The core helium flash begins at the the tip of the red giant branch indicated
by the arrow. |
| Open with DEXTER |
Since the work of Deupree the computational capabilities have grown tremendously and methods to simulate hydrodynamic flow have improved considerably. The limitations of early studies concerning
grid resolution and numerical treatment, the main points of critique, can therefore be reduced considerably. At the same time, we still do not know the extent or circumstances
(stellar mass and composition) in which hydrodynamic core helium flash evolution differ from canonical stellar evolution calculations. Therefore, it appears necessary to have a new and fresh
look into the dynamics of the core helium flash. Deupree (1996) re-examined the problem, already more than a decade ago, concluding that the flash does not lead to any
hydrodynamic event. Quiescent behaviour of the core helium flash is also favored by three-dimensional simulations done by Dearborn et al. (2006) and Lattanzio et al. (2006), in which the energy transport due to convection, heat conduction, and radiation appears
able to transport most of the energy generated during the flash quiescently from the stellar interior to the outer stellar layers, implying no hydrodynamic event, and hence a quasi-hydrostatic evolution.
![\begin{figure}
\par\includegraphics[width=7.2cm,clip]{0169fg21.eps}\end{figure}](/articles/aa/full/2008/40/aa10169-08/Timg54.gif) |
Figure 2:
Temperature distribution as a function of radius. The dashed line gives the distribution obtained from stellar evolutionary calculations, while the solid line shows the mapped and stabilized distribution used as initial condition in the hydrodynamic simulations. CVZ marks the convection zone. |
| Open with DEXTER |
We present a completely independent investigation of the core helium flash by means of one-dimensional and two-dimensional hydrodynamic simulations using state-of-the-art numerical techniques, a detailed equation of state, and a time-dependent gravitational potential. The hydrodynamic calculations cover about 8 h of the evolution close to the peak of the core helium flash. We note that the present investigation was instigated by a similar, technically obsolete study performed by Kurt Achatz (Achatz 1995) in the context of his diploma thesis. The results of this latter study have unfortunately never been published.
The paper is organized as follows. In Sect. 2, we discuss briefly the stellar input model for the simulations along with some results from hydrostatic core helium flash calculations. In Sect. 3, the hydrodynamics code and the numerical methods are introduced, while the results of our one and two-dimensional (1D and 2D, respectively) hydrodynamic runs are presented in Sects. 4 and 5, respectively. Finally, our conclusions are given in Sect. 6.
Table 1:
Some properties of the initial model: total mass M, stellar population, metal content Z, mass
 and radius
 of the helium core (
 ), nuclear energy production in the helium core
 ,
maximum temperature of the star
,
maximum temperature of the star
 ,
and radius
,
and radius
 and density
 at the temperature
maximum.
at the temperature
maximum.
![\begin{figure}
\par\includegraphics[width=6.8cm,clip]{0169fg22.eps}\hspace*{7mm}
\includegraphics[width=7.8cm,clip]{0169fg23.eps}\end{figure}](/articles/aa/full/2008/40/aa10169-08/Timg61.gif) |
Figure 3:
Left panel: pressure (in
 )
and density (in 105 g cm-3) distribution of the mapped and stabilized initial model. The pressure and density distribution of the original
stellar evolution model cannot be distinguished from the corresponding profiles of the stabilized model on this scale. Right panel: chemical composition of the initial model. )
and density (in 105 g cm-3) distribution of the mapped and stabilized initial model. The pressure and density distribution of the original
stellar evolution model cannot be distinguished from the corresponding profiles of the stabilized model on this scale. Right panel: chemical composition of the initial model. |
| Open with DEXTER |
Table 1 summarizes some properties of our initial model, which was obtained from stellar evolutionary calculations with the ``Garstec'' code (Weiss & Schlattl 2000,2007). It corresponds to a star with a mass of 1.25
and a metallicity Z = 0.02 at the peak of the core helium flash (

 ), computed with the hydrostatic stellar evolution code. During this violent episode, the star is located at the tip of the red giant branch in the H-R diagram (Fig. 1), hence being a red giant consisting of a small central helium core with a radius
  1.9
109 cm, surrounded by a hydrogen burning shell
and a huge convective envelope with a radius
1.9
109 cm, surrounded by a hydrogen burning shell
and a huge convective envelope with a radius
 cm. Figure 2 shows the temperature distribution inside the helium core, which is characterized by an off-center temperature
maximum
,
from where the temperature steeply drops towards smaller radii and follows a super-adiabatic gradient towards larger radii (convection zone). The radius
of the temperature maximum coincides with the bottom of the convection zone. The almost
discontinuous temperature stratification near
(temperature inversion), where the temperature rises from 7
107 K to 1.7
108 K, results from an interplay between neutrino cooling and heating by nuclear burning. Figure 3 shows the density and pressure stratification of the model. One recognizes that the temperature inversion is correlated with a drop in density. A detailed view reveals that the steep increase in temperature corresponds to a decrease in the density by 11%, an increase in the ion pressure by
70%, and a drop in the electron pressure by 9%, respectively. Even at the peak of the core helium flash, the helium core is still strongly degenerate: compared with the electron pressure,
the ion pressure is lower by a factor of 6, while the radiation pressure is smaller by almost 3 orders of magnitude.
cm. Figure 2 shows the temperature distribution inside the helium core, which is characterized by an off-center temperature
maximum
,
from where the temperature steeply drops towards smaller radii and follows a super-adiabatic gradient towards larger radii (convection zone). The radius
of the temperature maximum coincides with the bottom of the convection zone. The almost
discontinuous temperature stratification near
(temperature inversion), where the temperature rises from 7
107 K to 1.7
108 K, results from an interplay between neutrino cooling and heating by nuclear burning. Figure 3 shows the density and pressure stratification of the model. One recognizes that the temperature inversion is correlated with a drop in density. A detailed view reveals that the steep increase in temperature corresponds to a decrease in the density by 11%, an increase in the ion pressure by
70%, and a drop in the electron pressure by 9%, respectively. Even at the peak of the core helium flash, the helium core is still strongly degenerate: compared with the electron pressure,
the ion pressure is lower by a factor of 6, while the radiation pressure is smaller by almost 3 orders of magnitude.
The stellar model contains the chemical species 1H, 3He, 4He, 12C, 13C, 14N, 15N, 16O, 17O, 24Mg, and 28Si. However, we are not interested
in the detailed chemical evolution of the star. It is therefore unnecessary to consider all of these species in our hydrodynamic simulations, since the triple- reaction dominates the energy production rate during the core helium flash. In our hydrodynamic simulations, we therefore adopt
only the abundances of 4He, 12C, and 16O. The remaining composition is assumed to be adequately represented by a gas with a mean molecular weight equal to that of 20Ne
(Fig. 3). The apparent peak in 12C abundance at the position of the temperature maximum results from a non-instantaneous treatment of convective mixing.
reaction dominates the energy production rate during the core helium flash. In our hydrodynamic simulations, we therefore adopt
only the abundances of 4He, 12C, and 16O. The remaining composition is assumed to be adequately represented by a gas with a mean molecular weight equal to that of 20Ne
(Fig. 3). The apparent peak in 12C abundance at the position of the temperature maximum results from a non-instantaneous treatment of convective mixing.
The stellar evolutionary model is one-dimensional, hydrostatic, and was computed on a Lagrangian grid of 2294 zones. Since only the helium core of the model (without its very central part; see
Sect. 3.6) is of interest to us, we consider only the initial data for 2
 109 cm, and interpolate all relevant quantities (e.g.density, temperature, composition) onto our Eulerian, lower resolution computational grid
using polynomial interpolation (Press et al. 1992). Due to the interpolation errors and subtle differences in the input physics, the interpolated model is no longer in perfect hydrostatic equilibrium. To balance perfectly also the gravitational and pressure forces in the interpolated model, we use an iterative procedure in the first hydrodynamic timestep to minimize the numerical fluxes across zone boundaries. The entire process produces a small temperature decrease
with respect to the temperature profile of the original model (Fig. 2). Depending on the radial resolution of the Eulerian grid, the differences do not exceed a few percent. The resulting
changes in the density and pressure profiles are negligible due to the strong electron degeneracy of the gas. The main cause of the slight destabilization of the mapped initial stellar model is the use of different equations of state in both codes. The hydrodynamic code employs the equation of state by Timmes & Swesty (2000), whereas the ``Garstec'' code relies on the OPAL equation of state by
Rogers et al. (1996). At a given density, temperature, and composition in the helium core during the flash, these equations of state provide pressure values that differ typically by 1%, the difference being most apparent in regions where the matter is highly degenerate.
109 cm, and interpolate all relevant quantities (e.g.density, temperature, composition) onto our Eulerian, lower resolution computational grid
using polynomial interpolation (Press et al. 1992). Due to the interpolation errors and subtle differences in the input physics, the interpolated model is no longer in perfect hydrostatic equilibrium. To balance perfectly also the gravitational and pressure forces in the interpolated model, we use an iterative procedure in the first hydrodynamic timestep to minimize the numerical fluxes across zone boundaries. The entire process produces a small temperature decrease
with respect to the temperature profile of the original model (Fig. 2). Depending on the radial resolution of the Eulerian grid, the differences do not exceed a few percent. The resulting
changes in the density and pressure profiles are negligible due to the strong electron degeneracy of the gas. The main cause of the slight destabilization of the mapped initial stellar model is the use of different equations of state in both codes. The hydrodynamic code employs the equation of state by Timmes & Swesty (2000), whereas the ``Garstec'' code relies on the OPAL equation of state by
Rogers et al. (1996). At a given density, temperature, and composition in the helium core during the flash, these equations of state provide pressure values that differ typically by 1%, the difference being most apparent in regions where the matter is highly degenerate.
Given that the maximum temperature in the helium core is  108 K, the stellar model reaches a peak in nuclear energy production rate during the core helium flash within 104 yrs. The rate at which the nuclear energy production rises is highly non-linear. From the onset of the core helium flash at a helium luminosity of
 ,
it takes almost 30 000 yrs to reach
,
it takes almost 30 000 yrs to reach
 ,
whereas it requires only 40 yrs to
reach
,
whereas it requires only 40 yrs to
reach
 .
The first core helium flash is followed by four subsequent mini flashes (Fig. 4) identified as thermal pulses by Thomas (1967) until the degeneracy in the helium core is lifted completely and the star settles down onto the horizontal branch quiescently burning helium in its core.
.
The first core helium flash is followed by four subsequent mini flashes (Fig. 4) identified as thermal pulses by Thomas (1967) until the degeneracy in the helium core is lifted completely and the star settles down onto the horizontal branch quiescently burning helium in its core.
Since the computed model is a Pop I metal-rich star, it does not experience any hydrogen entrainment during the core helium flash (Fujimoto et al. 1990; Schlattl et al. 2001).
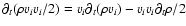
The energy flux density due to thermal transport is given by
 |
(1) |
where
 is the total conductivity (
 )
and
)
and
 the temperature gradient.
In the helium core, which is partially degenerate, thermal transport
due to both radiative diffusion and electron conduction is important, while
heat transport by ions is negligible, i.e.
 |
(2) |
The radiative conductivity is given by
 |
(3) |
where  ,
a, and c are the Rosseland mean of the opacity, the radiation constant, and the speed of light, respectively. For the opacity, we use a formula defined by Iben (1975), which is based on the work of Cox & Stewart (1970a,b). It takes into account the radiative opacity due to Thomson scattering, free-free (Kramers opacity), bound-bound, and bound-free transitions.
,
a, and c are the Rosseland mean of the opacity, the radiation constant, and the speed of light, respectively. For the opacity, we use a formula defined by Iben (1975), which is based on the work of Cox & Stewart (1970a,b). It takes into account the radiative opacity due to Thomson scattering, free-free (Kramers opacity), bound-bound, and bound-free transitions.
For the thermal transport by electron conduction, we consider contributions due to electron-ion and electron-electron collisions (Potekhin et al. 1997; Yakovlev & Urpin 1980).
![\begin{figure}
\par\includegraphics[width=7.5cm,clip]{0169fg24.eps}\end{figure}](/articles/aa/full/2008/40/aa10169-08/Timg79.gif) |
Figure 4:
Temporal evolution of the helium luminosity
(solid) versus the hydrogen luminosity  (dash-dotted) of model M during the core helium flash.
 |
| Open with DEXTER |
The evolutionary time covered by our hydrodynamic simulations is too short for neutrino cooling to be of importance. The neutrino losses computed from the analytic fits of Itoh et al. (1996) provide a cooling rate
 ,
or a corresponding decrease in the
maximum temperature by
,
or a corresponding decrease in the
maximum temperature by
 during the longest
simulations that we performed. Hence, cooling by neutrinos was neglected.
during the longest
simulations that we performed. Hence, cooling by neutrinos was neglected.
The equation of state employed in our hydrodynamic code includes contributions due to radiation, ions, electrons, and positrons. The total pressure is therefore given by
 |
(4) |
where
 |
(5) |
is the radiation pressure of a black body of temperature T, a is the universal radiation constant, and
 |
(6) |
is the pressure of a non-relativistic Boltzmann gas of density  which consists of a set of ions of abundance
Yi=Xi/Ai (where Xi and Ai are the mass fraction and the atomic mass number of species i, respectively). The pressure of an arbitrarily degenerate and relativistic
electron-positron gas
which consists of a set of ions of abundance
Yi=Xi/Ai (where Xi and Ai are the mass fraction and the atomic mass number of species i, respectively). The pressure of an arbitrarily degenerate and relativistic
electron-positron gas
 is based on table interpolation of the
Helmholtz free energy (Timmes & Swesty 2000).
is based on table interpolation of the
Helmholtz free energy (Timmes & Swesty 2000).
The energy generation rate by nuclear burning is given by
 |
(7) |
where
 |
(8) |
is the mass excess of a nucleus of mass Mi, and  is the atomic mass unit.
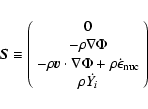
Abundance changes are described by a nuclear reaction network consisting of the four -nuclei 4He, 12C, 16O, and 20Ne, coupled by seven reactions (including the triple-reaction). We used the reaction rate library of Thielemann (private communication), which provides the product of the Avogadro number  and the velocity averaged cross section
 in terms of the fit formula
![$\displaystyle %
N_{\rm A}\langle\sigma v\rangle= \sum_{l=1}^{n_l}\exp
\Bigl[c_{...
...{-1}+c_{3l}T^{-1/3}+c_{4l}T^{1/3}
+ ~ c_{5l}T+c_{6l}T^{5/3}+c_{7l}\ln T \Bigr],$](/articles/aa/full/2008/40/aa10169-08/img92.gif) |
|
|
(9) |
with rate dependent coefficients cil (
 ). Up to three sets of coefficients (i.e.
 )
are used. The total reaction rate due to all one-body, two-body, and three-body
interactions has the form (Müller 1998):
)
are used. The total reaction rate due to all one-body, two-body, and three-body
interactions has the form (Müller 1998):
 |
|
|
(10) |
where the weight factors ci inhibit multiple counts in the sums over the nuclei j,k,l. The following nuclear reactions were considered:
| He 4 |
+ |
C12 |
 |
O16 |
+ |
 |
|
|
|
| He 4 |
+ |
O16 |
|
Ne20 |
+ |
|
|
|
|
| O16 |
+ |
|
|
He 4 |
+ |
C12 |
|
|
|
| Ne20 |
+ |
|
|
He 4 |
+ |
O16 |
|
|
|
| C12 |
+ |
C12 |
|
Ne20 |
+ |
He 4 |
|
|
|
| He 4 |
+ |
He4 |
+ |
He4 |
|
C12 |
+ |
|
|
| C12 |
+ |
|
|
He4 |
+ |
He 4 |
+ |
He4. |
|
Mathematically, this produces a nuclear reaction network consisting
of seven non-linear first-order differential equations of the form
given by Eq. (10) and a temperature equation
 |
(11) |
where
 is the specific internal energy.
The effects of electron screening according to Dewitt et al. (1973)
were included for the triple-
reaction rate, and in the weak
screening regime only.
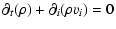
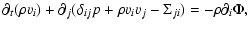
The hydrodynamic and thermonuclear evolution of the core helium flash
was computed by solving the governing set of fluid dynamic equations
in spherical coordinates on an Eulerian grid. Using vector notation,
these equations have the form,
 |
(12) |
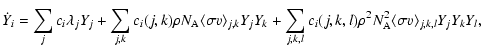
with the state vector U
 |
(13) |
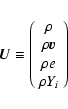
the flux vector F
 |
(14) |
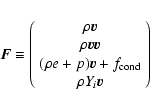
and the source vector S
 |
(15) |
with
 ,
where
,
where
 is the number of nuclear species considered in the nuclear reaction network, and ,
p, v, and
is the number of nuclear species considered in the nuclear reaction network, and ,
p, v, and  are the density, pressure, velocity, and gravitational potential, respectively. The term
 describes energy transport by thermal conduction (see Sect. 3.1), and
 and
the
and
the
 are the nuclear energy generation rate and the change in the mass fraction of species i due to nuclear reactions, respectively (see Sect. 3.4). The total energy density
 vv/2, where e is the specific total energy and
is the specific internal energy.
vv/2, where e is the specific total energy and
is the specific internal energy.
3.6 Code
The numerical simulations were performed with a modified version of the hydrodynamic code Herakles (Kifonidis et al. 2003,2006), which is a descendant of the code Prometheus developed by Bruce Fryxell and Ewald Müller (Müller et al. 1991; Fryxell et al. 1991). The hydrodynamic equations were integrated to second order accuracy in space and time using the dimensional splitting approach of Strang (1968), the PPM reconstruction scheme (Colella & Woodward 1984), and a Riemann solver for real gases according to Colella & Glaz (1984). The evolution of the chemical species was described by a set of additional continuity equations (Plewa & Müller 1999). Source terms in the evolutionary
equations due to self-gravity and nuclear burning were treated by means of operator splitting. Every source term was computed separately, and its effect was accounted for at the end of the integration step. The viscosity tensor was not taken into account explicitly, since the
solution of the Euler equations with the PPM scheme corresponds to the use of a sub-grid scale model that reproduces the solution of the Navier-Stokes equations reasonably well (Sitine et al. 2000; Meakin & Arnett 2007b). Thermal transport was treated in a time-explicit fashion when
integrating the evolutionary equations. Self-gravity was implemented
according to Müller & Steimnetz (1995), while the gravitational potential was approximated by a one-dimensional Newtonian potential derived from the spherically averaged mass distribution.
The nuclear network was solved with the semi-implicit Bader-Deufelhard
method that utilizes the Richardson extrapolation approach and sub-stepping techniques (Press et al. 1992; Bader & Deuflhard 1983) allowing for long effective timesteps.
The code was vectorized and enabled the adjustment of the vector length to the memory architecture. Therefore, an optimal performance with both vector and super-scalar, cache-based machines could be achieved.
A program cycle for two-dimensional runs consisted of two hydrodynamic timesteps and proceeds as follows:
- 1.
- the hydrodynamic equations were integrated in the r-direction (r-sweep), including the effects of heat conduction. The time-averaged gravitational forces were computed, and the momentum and the total energy were updated to account for the gravitational source terms.
Subsequently, the equation of state was called to update the
thermodynamic state due to the change in the total energy;
- 2.
- Step (1) was repeated in
 -direction (-sweep);
- 3.
- the nuclear network was solved in all zones with significant
nuclear burning (T > 108 K). Subsequently, the equation of state
was called to update the pressure and temperature;
- 4.
- in the subsequent timestep, the order of Step (1) and (2) was
reversed to guarantee second-order accuracy in the time integration,
and Step (3) was repeated with the updated quantities;
- 5.
- the size of the timestep for the next cycle was determined.
For one-dimensional runs, Step (2) and Step (4) were omitted.
When using spherical coordinates, the CFL stability condition on the timestep was most restrictive near the origin of the grid. However, inside a region beneath the off-center temperature maximum, there were no significant non-radial motions to be expected during the evolution
of the core helium flash except in the immediate vicinity of the temperature inversion, where convective overshooting may occur. Hence, removing the center of the computational grid did not generate any numerical bias, but conserved considerable amounts of computational
time. In the radial direction, we used a closed (i.e.reflective) outer and inner quasi-hydrostatic boundary obtained by means of polynomial extrapolation, which significantly suppressed any artificial velocity fluctuations resulting from an imbalance of gravitational and
pressure forces in the boundary zones. For two-dimensional runs,
the boundary conditions in the angular direction were also reflective.
Table 2:
Some properties of the 1D simulations: number of radial grid points ( ), radial resolution (
 in 106 cm), time up to the thermonuclear runaway
 ,
and maximum evolution time
,
and maximum evolution time
 (both in s).
After interpolation and stabilization, the initial model in the two-dimensional simulations had to be perturbed explicitly to trigger convection, because an initially exactly spherically symmetric model remains that way forever when evolved in spherical coordinates with our code. We imposed a random flow field with a maximum (absolute) velocity of
 ,
and random density perturbations
with
,
and random density perturbations
with
 .
.
We performed several one-dimensional simulations using model M, which differed only in their grid resolution (see Table 2), in order to assess, whether a thermonuclear runaway could be avoided without a convective flow.
Figure 5 demonstrates that heat conduction and adiabatic expansion alone fail to stabilize the model, i.e.one-dimensional hydrodynamic simulations result in a thermonuclear
runaway. Initially, the maximum temperature increases only slowly, but starts to rise rapidly after a time
(Table 2) up to a value
 .
For instance, from
the temperature evolution of model hefl.1d.3, one can determine that a local hot spot with a temperature of 2.3
.
For instance, from
the temperature evolution of model hefl.1d.3, one can determine that a local hot spot with a temperature of 2.3
 will runaway after about 80 s (Fig. 6). The time at which the runaway is triggered depends on the grid resolution, being longer in models with
lower resolution (Fig. 5).
will runaway after about 80 s (Fig. 6). The time at which the runaway is triggered depends on the grid resolution, being longer in models with
lower resolution (Fig. 5).
In every case, a thermonuclear flame with
 K eventually forms and propagates outwards with subsonic velocity depending on the grid resolution. Since our two-dimensional (more
realistic) simulations do not show such a behavior, we refrain
from further discussion of the one-dimensional simulations.
K eventually forms and propagates outwards with subsonic velocity depending on the grid resolution. Since our two-dimensional (more
realistic) simulations do not show such a behavior, we refrain
from further discussion of the one-dimensional simulations.
![\begin{figure}
\par\includegraphics[width=6.9cm,clip]{0169fg41.eps}\end{figure}](/articles/aa/full/2008/40/aa10169-08/Timg117.gif) |
Figure 5:
Evolution of the temperature maximum
in the one-dimensional models hefl.1d.1 (solid), hefl.1d.2 (dashed), and hefl.1d.3 (dash-dotted), respectively. |
| Open with DEXTER |
![\begin{figure}
\par\includegraphics[width=6.9cm,clip]{0169fg42.eps}\end{figure}](/articles/aa/full/2008/40/aa10169-08/Timg118.gif) |
Figure 6:
Temperature stratification across the helium core in model hefl.1d.3 during the runaway at t1 = 12 270 s (dotted), t2 = 12 352 s (dashed), t3 = 12 392 s
(dash-dotted), and t4 = 12 762 s (dash-dot-dotted), respectively. The solid line corresponds to the initial model (t0), and the arrow indicates the direction of the
flame propagation. |
| Open with DEXTER |
Table 3:
Some properties of the 2D simulations: number of grid points in radial ()
and angular (
 )
direction, radial (
in 106 cm) and angular grid resolution (
)
direction, radial (
in 106 cm) and angular grid resolution (
 ), characteristic length scale
  of the flow (in 108 cm), characteristic rms velocity
  of the flow (in
 )
averaged over the width of
the convection zone R
,
Reynolds number
)
averaged over the width of
the convection zone R
,
Reynolds number  associated with the numerical viscosity of our code (Porter & Woodward 1994), damping timescale due to the
numerical viscosity
associated with the numerical viscosity of our code (Porter & Woodward 1994), damping timescale due to the
numerical viscosity  ,
typical convective turnover time
,
typical convective turnover time
 ,
and maximum evolution time
(in s), respectively.
,
and maximum evolution time
(in s), respectively.
In Table 3, we summarize some characteristic parameters of
our two-dimensional simulations which are based on model M.
We first discuss in some detail one specific simulation hefl.2d.3, which serves as a standard to which we compare the results of our other simulations. Thereafter, we discuss some general properties of all 2D simulations. Every simulation covered approximately 3
104 s
(8 h) of the evolution near the peak of the core helium flash. They were performed on an equidistant spherical grid encompassing 95% of the helium core mass (X(4He) > 0.98)
except for a central region with a radius of r = 2
 ,
which was removed in order to allow the use of longer timesteps. This radius is sufficiently smaller than the radius of the temperature inversion (
,
which was removed in order to allow the use of longer timesteps. This radius is sufficiently smaller than the radius of the temperature inversion ( )
and therefore its presence does not influence
the convection zone.
)
and therefore its presence does not influence
the convection zone.
![\begin{figure}
\par\includegraphics[width=7.55cm,clip]{0169fg51.eps}\hspace*{1.3cm}
\includegraphics[width=7.3cm,clip]{0169fg52.eps}\end{figure}](/articles/aa/full/2008/40/aa10169-08/Timg128.gif) |
Figure 7:
Left panel: temporal evolution of the horizontally averaged temperature maximum
 (solid), and the global temperature maximum
(dotted) in model hefl.2d.3. The dashed line corresponds to the temporal evolution of the maximum temperature in the stellar evolutionary calculations of model M. Right panel: the rms convection velocity
(solid), and the global temperature maximum
(dotted) in model hefl.2d.3. The dashed line corresponds to the temporal evolution of the maximum temperature in the stellar evolutionary calculations of model M. Right panel: the rms convection velocity
 in simulation hefl.2d.3 averaged over 6000 s (solid) versus the convection velocity predicted by the mixing length theory
 (dashed).
 |
| Open with DEXTER |
![\begin{figure}
\par\includegraphics[width=5.25cm,clip]{0169btmp.eps}\hspace*{0.8...
....eps}\hspace*{1cm}
\includegraphics[width=5.1cm,clip]{0169ec12.eps}\end{figure}](/articles/aa/full/2008/40/aa10169-08/Timg132.gif) |
Figure 8:
Snapshots of the onset of convection at 1020 s ( upper panels), and of the evolved convection at 29 000 s ( lower panels) in model hefl.2d.3, showing the temperature contrast
 ( left panels), the velocity field ( middle panels), and the 12C contrast
 ( right panels), respectively.
 denotes a horizontal average at a
given radius.
denotes a horizontal average at a
given radius. |
| Open with DEXTER |
After the beginning of the simulation, the initial velocity perturbations started to grow in a narrow layer just outside the temperature maximum (
),
i.e.in the region heated by nuclear burning. Later on at
 s, several hot bubbles appeared, which rose upwards with maximum velocities of 4
 .
They were
typically about 0.2% hotter than the angular-averaged temperature at a given radius. The 4He mass fraction of all hot bubbles was about 0.4% less than the corresponding angular-averaged value, since helium was depleted in the bubbles by the triple
reaction.
Consequently, 12C and 16O (produced in helium burning) were enhanced by 0.7% in the bubbles.
.
They were
typically about 0.2% hotter than the angular-averaged temperature at a given radius. The 4He mass fraction of all hot bubbles was about 0.4% less than the corresponding angular-averaged value, since helium was depleted in the bubbles by the triple
reaction.
Consequently, 12C and 16O (produced in helium burning) were enhanced by 0.7% in the bubbles.
During the first 700 s of the evolution, the off-center maximum mean temperature
rose at a rate of
 ,
until it reached a value 1.67
108 K. At this moment, from the region at the
,
the bubbles emerged and caused its decrease by 2.6
106 K in just 570 s corresponding to a temperature drop rate of
,
until it reached a value 1.67
108 K. At this moment, from the region at the
,
the bubbles emerged and caused its decrease by 2.6
106 K in just 570 s corresponding to a temperature drop rate of
 (Fig. 7). This phase marked the onset of
convection (Fig. 8), where a fraction of the thermonuclear energy released via
helium burning started to be transported efficiently away from the burning regions by mass flow, thereby inhibiting a thermonuclear runaway.
(Fig. 7). This phase marked the onset of
convection (Fig. 8), where a fraction of the thermonuclear energy released via
helium burning started to be transported efficiently away from the burning regions by mass flow, thereby inhibiting a thermonuclear runaway.
As soon as the bubbles had formed, they rose upwards and started to interact and
merge, i.e.the convective layer began to grow in radius. About 1300 s after the start of the simulation, the entire convection zone was covered by an almost stationary flow pattern of almost constant total kinetic energy roughly equal to 1045 erg. At this time, vortices dominated the flow pattern. They extended across the entire convective region (width R
 ), and were of approximately similar angular size, one vortex covering about 40 degrees (diameter 5
108 cm). Usually we found about four such vortices with two dominant up-flows of hot gas at both
), and were of approximately similar angular size, one vortex covering about 40 degrees (diameter 5
108 cm). Usually we found about four such vortices with two dominant up-flows of hot gas at both
 and
and
 (see, e.g.Fig. 8). These large vortices were rather stable, surviving until the end of our simulations. Typical convective flow velocities were
 ,
well below the local sound speed
,
well below the local sound speed

 ,
i.e.a vortex required about 500 s for one rotation. The persistence of vortices is not typical for
turbulent convection.
,
i.e.a vortex required about 500 s for one rotation. The persistence of vortices is not typical for
turbulent convection.
The dominance of the large scale structures (vortices) was a consequence of the imposed axial symmetry, which eliminated the vortex folding term in the vorticity evolution equation of the flow
(Meakin & Arnett 2007a; Pope 2000).
The Mach number M of the convective flow was 0.01. Is PPM suited for this type of
subsonic flow? This question, which is beyond the scope of the present study, needs to be investigated. It is known that the artificial viscosity of standard Riemann solver methods exhibit an incorrect scaling with the flow Mach number as
 0 (Turkel 1999), i.e.the
inherent artificial viscosity of PPM may be too high for
simulating flows at low Mach numbers (e.g.
0 (Turkel 1999), i.e.the
inherent artificial viscosity of PPM may be too high for
simulating flows at low Mach numbers (e.g.
 )
adequately.
)
adequately.
However, Meakin & Arnett (2007a) demonstrated that the PPM method operates well even at these low Mach numbers.
Energy transport by convection within the vortices is concentrated into a few narrow upward drafts, compensated partially, but only to a small extent, by down-flows. The vortices transport energy mostly along their outer edges. Matter in their centers does not interact
at all with the regions of dominant nuclear energy production.
The horizontally averaged value of the maximum temperature, barring some additional temperature fluctuations due to convection, increased slightly following the onset of convection during the entire subsequent evolution at an approximate rate
 (see Fig. 7).
This rate appears to be about 60% lower than the rate measured in the stellar evolutionary calculations (
 ): this could be the result of either an initially lower value of
the temperature maximum, after the stabilization phase, at the beginning
of the simulation (see Sect. 2), or more dynamic convective motion, since the mean convective velocities
exceed the velocities predicted by mixing length theory,
,
on average by a factor of four (Fig. 7).
): this could be the result of either an initially lower value of
the temperature maximum, after the stabilization phase, at the beginning
of the simulation (see Sect. 2), or more dynamic convective motion, since the mean convective velocities
exceed the velocities predicted by mixing length theory,
,
on average by a factor of four (Fig. 7).
Convection distributes the energy in such a way that the temperature gradient  never exceeds
 significantly in model M. Although, the value of
established at the beginning of the simulation deviates slightly after some time from the gradient at
later times, it remains close to the adiabatic temperature gradient
(the relative difference being less than 1%). In this respect, there is no indication of any significant deviation from the situation obtained in stellar evolutionary calculations.
significantly in model M. Although, the value of
established at the beginning of the simulation deviates slightly after some time from the gradient at
later times, it remains close to the adiabatic temperature gradient
(the relative difference being less than 1%). In this respect, there is no indication of any significant deviation from the situation obtained in stellar evolutionary calculations.
![\begin{figure}
\par\includegraphics[width=7.5cm,clip]{0169f55a.eps}\hspace*{1.3c...
...eps}\hspace*{1.3cm}
\includegraphics[width=7.6cm,clip]{0169f55d.eps}\end{figure}](/articles/aa/full/2008/40/aa10169-08/Timg149.gif) |
Figure 9:
Snapshots of various energy fluxes and source terms in model hefl.2d.3 (time averaged from
t = 18 000 s to
t = 24 000 s): a) convective flux  (solid), and the energy
flux due to the thermal transport
(solid), and the energy
flux due to the thermal transport  (dash-dotted); b) kinetic flux
  (solid), acoustic flux FP (dash-dot-dotted), and sum of the kinetic and convective flux
 (dashed); c) source terms due to work done by buoyancy forces
  ,
and d) due to volume changes PP. The vertical lines enclose the nuclear burning zone
(T > 108 K). ,
and d) due to volume changes PP. The vertical lines enclose the nuclear burning zone
(T > 108 K). |
| Open with DEXTER |
The apparent spike in the initial 12C distribution at the location of the temperature maximum (Fig. 3) is a result of a non-instantaneous treatment of the convective mixing in stellar evolutionary calculations. It turns out that a non-instantaneous treatment of mixing is not required during the core helium flash since simulation hefl.2d.3 indicate that the spike is smeared out immediately after convection commences. This implies that the assumption of instantaneous mixing is a good approximation locally, despite the strong temperature dependence of the energy production rate.
Figure 9 displays the individual contributions of various energy fluxes, time-averaged over almost 12 convective turnover times (see Table 3), i.e.only the average effect of convection should be apparent. The derivation of these quantities is explained in Appendix A. All
energy fluxes, F, describe the amount of energy transported per unit of time across a sphere of a given radius.
Most of the nuclear energy production in the convection zone occurs in a relatively narrow shell about the location of the temperature maximum. This energy is transported away by both
convection and thermal transport due to heat conduction and radiation. The convective (or enthalpy) flux, ,
varies from -0.2
 up to 1.6
.
The kinetic flux, ,
reaches a value of at most 1
,
and is mostly positive in the convection zone, i.e.the motion has a
predominantly upward direction. This implies that the fast, narrow, upwardly directed streams dominate over the slower and broader downward flows. The ratio of the extreme values of
and
is almost 2:1, i.e.nuclear energy is stored predominantly in the internal
energy of the rising hot gas.
up to 1.6
.
The kinetic flux, ,
reaches a value of at most 1
,
and is mostly positive in the convection zone, i.e.the motion has a
predominantly upward direction. This implies that the fast, narrow, upwardly directed streams dominate over the slower and broader downward flows. The ratio of the extreme values of
and
is almost 2:1, i.e.nuclear energy is stored predominantly in the internal
energy of the rising hot gas.
Both convective and kinetic energy flux transport more than 90% of the generated nuclear energy upward through the convection zone, the value is dropping to zero towards its border. Part of the heat released in the nuclear processes is in fact transported downwards towards the inner edge of the temperature inversion. Almost none of the nuclear energy reaches the surface of
the helium core, either by convection or by conduction, i.e.all the energy released is deposited within the core causing its expansion. Energy transport due to heat conduction and radiation is everywhere negligible compared with other contributions. The viscous flux,
 ,
is negligible as well, and losses due to friction,
,
is negligible as well, and losses due to friction,  ,
influence only the dynamics significantly close to the borders of the
convection zone (Achatz 1995).
,
influence only the dynamics significantly close to the borders of the
convection zone (Achatz 1995).
For completeness, we also consider the flux and source terms of the kinetic energy (see Appendix A), which allow us an additional insight into the operation of convection. The radial profile of the source term ,
corresponding to the work done by buoyancy forces, indicates
that the vertical convective flows are accelerated due to their density fluctuations in the entire region of dominant nuclear burning (burning zone) above
.
Corresponding pressure fluctuations (causing expansion due to a pressure excess, respectively compression
due to a pressure deficit) powered by the volume work  show that the gas within the burning region expands, which effectively again implies that an acceleration occurs. Due to the importance of
in the convection zone, the acoustic flux
show that the gas within the burning region expands, which effectively again implies that an acceleration occurs. Due to the importance of
in the convection zone, the acoustic flux  ,
which
transports pressure fluctuations, reaches a value comparable to that
of the kinetic flux ,
its value being negligible elsewhere.
,
which
transports pressure fluctuations, reaches a value comparable to that
of the kinetic flux ,
its value being negligible elsewhere.
![\begin{figure}
\par\includegraphics[width=8.1cm,clip]{0169fg56.eps}\hspace*{7mm}
\includegraphics[width=7.85cm,clip]{0169fg57.eps}\end{figure}](/articles/aa/full/2008/40/aa10169-08/Timg156.gif) |
Figure 10:
Angular averaged 12C distribution (dashed) and temperature stratification (thick) at the inner ( left panel) and outer edge ( right panel) of the convection zone in model hefl.2d.3 at
 .
The vertical dotted lines mark the initial boundaries of the convection zone at t = 0 s. .
The vertical dotted lines mark the initial boundaries of the convection zone at t = 0 s. |
| Open with DEXTER |
Turbulent entrainment (Fernando 1991; Meakin & Arnett 2007b), commonly referred to as overshooting, is a hydrodynamic process that permits mixing and heating in regions that are convectively stable according to the Schwarzschild or Ledoux criterium. Turbulent entrainment, i.e.penetration beyond the formal convective boundaries, occurs at both edges of the convection zone, and is driven by down-flows and up-flows. We study the entrainment by monitoring the temperature changes and the 12C concentration at the (formal) edges of the convection zone. 12C is the most suitable element for investigating the extent of convective mixing, because at the beginning of the simulations, it is mostly absent outside the convection zone, and therefore can be
enhanced there only due to overshooting.
At
t = 30 000 s, close to the end of simulation hefl.2d.3, the temperature inversion is located at r=4.65
108 cm (Fig. 10). It is therefore about 70 km closer to the center of the star than it was at the beginning of the simulation (4.72
108 cm). Its shape remains almost unchanged and discontinuous during the whole simulation,
and its propagation speed can be estimated from the heating rate
 and the local gradient
 at the steepest point of
the inversion:
at the steepest point of
the inversion:
 |
(16) |
This speed is significantly higher than the propagation speed due to heat conduction alone. We note that the energy flux carried by the heat conduction is seven orders of magnitude smaller than the energy flux carried by the convection. Assuming that the convective energy flux at the position of the temperature inversion (
 )
is used up completely to heat the layers beneath the temperature inversion, a typical heating rate of
)
is used up completely to heat the layers beneath the temperature inversion, a typical heating rate of
 can be derived, which is by roughly 50% lower than the value inferred from the simulation.
 ,
the heat capacity of the layers including the
temperature inversion is 1.6
,
the heat capacity of the layers including the
temperature inversion is 1.6
 .
This implies that turbulent entrainment leads to a strong heating of the inner neutrino-cooled center of the star that occurs on timescales relatively short compared with stellar evolutionary timescales. This heating was studied by both Deupree & Cole (1983) and Cole et al. (1985), who derived
qualitatively similar results. In one-dimensional stellar evolution calculations, the temperature inversion moves outwards with time.
.
This implies that turbulent entrainment leads to a strong heating of the inner neutrino-cooled center of the star that occurs on timescales relatively short compared with stellar evolutionary timescales. This heating was studied by both Deupree & Cole (1983) and Cole et al. (1985), who derived
qualitatively similar results. In one-dimensional stellar evolution calculations, the temperature inversion moves outwards with time.
Assuming that the estimated propagation speed of the temperature
inversion remains constant, it would reach the center of the helium
core and lift the electron degeneracy there within 24 days. This
scenario would exclude the occurrence of mini-flashes after
the main core helium flash, which are observed in stellar evolutionary
calculations (Fig. 4).
![\begin{figure}
\par\includegraphics[width=7cm,clip]{0169fg58.eps}\hspace*{1.3cm}
\includegraphics[width=7.4cm,clip]{0169fg59.eps}\end{figure}](/articles/aa/full/2008/40/aa10169-08/Timg164.gif) |
Figure 11:
Left panel: evolution of the total energy production rate in solar luminosity  for models hefl.2d.1 (dotted), hefl.2d.2 (dashed), and hefl.2d.3 (dash-dotted), respectively. Right panel: mean temperature distribution near the
temperature inversion for models hefl.2d.1 (dotted), hefl.2d.2 (dashed), and hefl.2d.3 (dash-dotted) at a
t = 30 000 s, respectively. The initial distribution is shown by the solid line.
for models hefl.2d.1 (dotted), hefl.2d.2 (dashed), and hefl.2d.3 (dash-dotted), respectively. Right panel: mean temperature distribution near the
temperature inversion for models hefl.2d.1 (dotted), hefl.2d.2 (dashed), and hefl.2d.3 (dash-dotted) at a
t = 30 000 s, respectively. The initial distribution is shown by the solid line. |
| Open with DEXTER |
Sweigart & Gross (1978) found that in stars with higher mass and helium
abundance, the flash occurs closer to their center, which implies
that in these stars can the temperature inversion reach the center of the
helium core due to the turbulent entrainment even faster.
We also found that turbulent entrainment influenced the outer boundary of the convection zone. In the initial model, this boundary was located at r = 9.2
108 cm and corresponded to a
discontinuous change in the distribution of elements (Fig. 3), which is in stellar evolution models a consequence of the assumed instantaneous mixing. In these models, all species in the convectively unstable region are mixed instantaneously across the entire convection zone, while the regions that are assumed to be convectively stable do not experience any mixing at all.
The distribution of 12C at the end of our simulation hefl.2d.3 is depicted in Fig. 10. Compared with that of the initial model, there is a clear shift of the carbon discontinuity, at the outer edge of the convection zone, to a larger radius (r = 9.7
108 cm). In hydrodynamic simulations, the gas overshoots naturally from the
convectively unstable to the formally convectively stable region because of its inertia. At the boundaries of the convection zone, the overshooting appears to destroy the stability, according to the Schwarzschild criterium, transforming the originally convectively stable region into a convectively unstable one. This allows the boundary to propagate further when a subsequent load of gas will try to overshoot at a later time. We estimated that the propagation speed
of the outer boundary of the convection zone was about
 .
With a propagation speed of this magnitude, the convection zone would reach the hydrogen-rich layers surrounding the helium core at a
radius r = 1.9
109 cm and trigger a hydrogen injection flash (Schlattl et al. 2001) within 10 days. Expected hydrodynamic phenomena due to the extra hydrogen mixing into the helium burning shell via this extended convection zone could alter
the structure of the star significantly. Additional nucleosynthesis could also be triggered because hydrogen entrainment will result in a production of neutrons and possibly also to a production of
some s-process elements.
.
With a propagation speed of this magnitude, the convection zone would reach the hydrogen-rich layers surrounding the helium core at a
radius r = 1.9
109 cm and trigger a hydrogen injection flash (Schlattl et al. 2001) within 10 days. Expected hydrodynamic phenomena due to the extra hydrogen mixing into the helium burning shell via this extended convection zone could alter
the structure of the star significantly. Additional nucleosynthesis could also be triggered because hydrogen entrainment will result in a production of neutrons and possibly also to a production of
some s-process elements.
The hydrogen injection flash in Pop I stars is in contradiction with the
canonical stellar evolutionary calculations where stars fail to inject
hydrogen to the helium core during the core helium flash, unless their
metallicity is close to zero (Fujimoto et al. 1990).
Since the turbulent entrainment at the inner convective boundary involved just three radial grid zones in the longest simulations that we performed, the estimated propagation velocity must be interpreted with caution and be considered as an order of magnitude estimate. The turbulent
entrainment at the outer convective boundary involved eighteen numerical zones in the radial direction: the estimated propagation velocity has higher confidence level.
We found only minor differences between the properties of model hefl.2d.3 and
those of the corresponding models computed with a different grid resolution.
First, the initial mapping process generated different interpolation
errors for different grid resolutions. However, the major source of
discrepancy in this phase of the calculation was the stabilization
itself. The iterative procedure that minimized the numerical fluxes
across zone boundaries (to retain the model in hydrostatic
equilibrium) tends to decrease the temperature stronger in models of
lower resolution.
Another source of discrepancy was caused by the numerical diffusion,
which was obviously stronger in models of lower resolution. Therefore,
model hefl.2d.1 suffered more from numerical diffusion than either model hefl.2d.2 or hefl.2d.3,
which is evident from Fig. 11. The temperature inversion, which at the beginning is almost discontinuous, is smoothed out faster in model hefl.2d.1. We note, that the temperature inversion is situated at smaller radii in models of higher resolution, since the typical
flow velocities are higher in better resolved models (Table 3), i.e.the turbulent entrainment is more effective, and the temperature inversion propagates at higher speed.
Nevertheless, models hefl.2d.2 and hefl.2d.3 appear to be well resolved
since differences between them are minor. The temporal evolution in their total
nuclear energy production rates, for instance, are in almost perfect agreement
(Fig. 11). The temperature fluctuations in the two-dimensional models are suppressed stronger in models of higher resolution. More intense temperature fluctuations observed in
models which we calculated with grid resolutions even lower than
that of the model hefl.2d.1, did not lead to an explosion.
We have presented one- and two-dimensional (i.e.axisymmetric) hydrodynamic simulations of the core helium flash close to its peak covering about eight hours of evolution time. We found no hydrodynamic events that deviated significantly from the predictions of stellar
evolutionary calculations. After an initial adjustment phase the 2D models reached a quasi-steady state where the temperature and nuclear energy production rate were increasing only slowly.
Convection played a crucial role in keeping the star in hydrostatic equilibrium. Based on our two-dimensional simulation of the highest grid resolution (model hefl.2d.3), convection followed the
predictions of mixing length theory approximately, although the temperature gradient
of our dynamically evolved 2D models deviated slightly from that of the initial model obtained from (1D) stellar evolutionary calculations (the relative difference was lower than 1%). The maximum
temperature
in our best resolved model hefl.2d.3 rose at a rate of about
,
which was about 60% lower than the rate predicted by stellar
evolutionary calculations. The mean convective velocity exceeded the
velocities predicted by mixing length theory by up to factor of four.
We note here, that in general, the velocities found in two-dimensional
hydrodynamical simulations tend to exceed those in their
three-dimensional (3D) counterparts where the velocities tend to agree
with the predictions of mixing length theory better (Meakin & Arnett 2007b).
During the early evolution (t < 1000 s) of our 2D simulations, the size of the convective
region did not deviate from that of the initial (hydrostatic) model. However, after a stable convective pattern was established, our 2D simulations showed that the convective flow, consisting of four quasi-stationary large scale (40 degrees angular width) vortices, started to push the inner and outer boundary of the convection zone, initially determined by the Schwarzschild stability criterium, towards the center of the star at a velocity of 2.3
 ,
and
towards the stellar surface at a velocity of 14
,
respectively. This produced a rapid growth in the radial extent of the convection zone on dynamic timescales. The boundary velocities may depend on the grid resolution and/or on the dimensionality of the flow. Therefore, they
should be considered as order of magnitude estimates only. We plan to
address this issue in a forthcoming paper.
,
and
towards the stellar surface at a velocity of 14
,
respectively. This produced a rapid growth in the radial extent of the convection zone on dynamic timescales. The boundary velocities may depend on the grid resolution and/or on the dimensionality of the flow. Therefore, they
should be considered as order of magnitude estimates only. We plan to
address this issue in a forthcoming paper.
Our 2D simulations further suggested that it is unlikely that the core helium flash is followed by subsequent core helium mini-flashes, which are observed in (1D) stellar evolutionary calculations, since the inner convective boundary can reach the center of the core in less
than one month. On the other hand, the injection of hydrogen from the
stellar envelope into the helium core is likely to happen within
10 days, which contradicts the predictions of the canonical
evolution of low-mass Pop I stars.
Since our 2D axisymmetric simulations are probably unable to capture accurately
an intrinsic three-dimensional behaviour of the convective flow,
we have started to develop 3D simulations of the core helium
flash. In addition, we plan to extend our 2D simulations to time
intervals of several days instead of hours. The results of these
long-term 2D simulations and of the first well resolved 3D simulations
of the core helium flash will be presented elsewhere.
Acknowledgements
The calculations were performed at the Rechenzentrum Garching on the
IBM pSeries Power5 system, and at the Leibniz-Rechenzentrum of the
Bavarian Academy of Sciences and Humanities on the SGI Altix 4700
system. The authors want to thank Frank Timmes for some of his public
Fortran subroutines which we used in the Herakles code for calculating
the core helium flash models. We also thank Kurt Achatz, whose
unpublished hydrodynamic simulations of the core helium flash,
performed as part of his diploma work, have motivated and inspired us.
The authors are grateful to an anonymous referee for his/her
comments which helped to improve this manuscript.
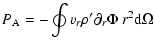
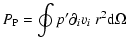
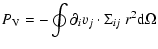
An analysis of the vertical energy transport investigates the importance
of the different physical processes occurring in
the convection zone. To separate the various contributions to the
total energy flux (Hurlburt et al. 1986; Achatz 1995), one
integrates the hydrodynamic equation of energy conservation
 |
(A.1) |
(with
 being the specific total energy density) over angular coordinates (,
  ), and separates both the specific enthalpy (
 )
and the kinetic energy (vivi/2) into a horizontal mean and a perturbation
(
)
and the kinetic energy (vivi/2) into a horizontal mean and a perturbation
(
 ). This results in
 |
(A.2) |
with![[*]](/icons/foot_motif.gif)
| |
|
 |
(A.3) |
| |
|
 |
(A.4) |
| |
|
 |
(A.5) |
| |
|
 |
(A.6) |
| |
|
 |
(A.7) |
| |
|
 |
(A.8) |
The various terms Fi indicate the total energy transported per unit time across a sphere by different physical processes. They are the convective (or enthalpy) flux ,
the flux of kinetic energy ,
the flux by heat conduction and radiation ,
and the
viscous flux .
Finally,  collects all terms causing a spherical mass flow, i.e.the model expansion or contraction, while
and
represent the deviations from this mean energy flow (vortices). The
and
are the major contributors to the heat transport by convection, while
is usually negligibly small.
collects all terms causing a spherical mass flow, i.e.the model expansion or contraction, while
and
represent the deviations from this mean energy flow (vortices). The
and
are the major contributors to the heat transport by convection, while
is usually negligibly small.
In a similar way, we can also formulate a conservation equation for
the mean horizontal kinetic energy, which provides further insight
into the effects of convective motions. Using the other hydrodynamic
equations
| |
|
 |
(A.9) |
| |
|
 |
(A.10) |
| |
|
i,j=1,2,3 |
(A.11) |
and
 ,
one finds
,
one finds
 |
(A.12) |
In terms of
and
as introduced above, one obtains
| |
|
 |
(A.13) |
| |
|
 |
(A.14) |
| |
|
 |
(A.15) |
| |
|
 |
(A.16) |
| |
|
 |
(A.17) |
| |
|
 |
(A.18) |
| |
|
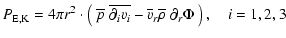 |
(A.19) |
where the Pi terms are source or sink terms of the kinetic energy. They are separated into the effect of buoyancy forces (), friction forces (), and the work due to density fluctuations (,
volume changes). By analyzing the individual Pi, one can determine
which process brakes or accelerates convective motion. The acoustic flux ,
describes the vertical transport of density fluctuations.
 and
and
 describes the effect of expansion (volume work, and work
against the gravitational potential), similar to
in Eq. (A.8).
describes the effect of expansion (volume work, and work
against the gravitational potential), similar to
in Eq. (A.8).
- Achatz, K.
1995, in Master thesis, Technical University München
(In the text)
-
Bader, G., & Deuflhard, P. 1983, Numer. Math., 41, 373 [CrossRef]
- Cole,
P. W., & Deupree, R. G. 1980, ApJ, 239, 284 [NASA ADS] [CrossRef]
- Cole,
P. W., & Deupree, R. G. 1981, ApJ, 247, 607 [NASA ADS] [CrossRef]
-
Cole, P. W., Demarque, P., & Deupree, R. G. 1985,
ApJ, 291, 291 [NASA ADS] [CrossRef]
(In the text)
-
Colella, P., & Glaz, H. H. 1984, J. Comput. Phys., 59,
264 [NASA ADS] [CrossRef]
(In the text)
- Colella, P., & Woodward,
P. R. 1984, J. Comput. Phys., 54, 174 [NASA ADS] [CrossRef]
(In the text)
- Cox,
A. N., & Stewart, J. N. 1970a, ApJS, 19, 243 [NASA ADS] [CrossRef]
- Cox,
A. N., & Stewart, J. N. 1970b, ApJS, 19, 261 [NASA ADS] [CrossRef]
- Dearborn,
D. S. P., Lattanzio, J. C., & Eggleton,
P. P. 2006, ApJ, 639, 405 [NASA ADS] [CrossRef]
(In the text)
- Deupree,
R. G. 1984a, ApJ, 282, 274 [NASA ADS] [CrossRef]
- Deupree,
R. G. 1984b, ApJ, 287, 268 [NASA ADS] [CrossRef]
- Deupree,
R. G. 1986, ApJ, 303, 649 [NASA ADS] [CrossRef]
- Deupree,
R. G. 1996, ApJ, 471, 377 [NASA ADS] [CrossRef]
(In the text)
-
Deupree, R. G., & Cole, P. W. 1983, ApJ, 269,
676 [NASA ADS] [CrossRef]
(In the text)
-
Deupree, R. G., & Wallace, R. K. 1987, ApJ, 317,
724 [NASA ADS] [CrossRef]
-
Dewitt, H. E., Graboske, H. C., & Cooper, M. S.
1973, ApJ, 181, 439 [NASA ADS] [CrossRef]
(In the text)
- Edwards,
A. C. 1969, MNRAS, 146, 445 [NASA ADS]
- Fernando,
H. 1991, Ann. Rev. Fluid Mech., 23, 455 [NASA ADS] [CrossRef]
- Fryxell, B., Arnett, D.,
& Müller, E. 1991, ApJ, 367, 619 [NASA ADS] [CrossRef]
-
Fujimoto, M. Y., Iben, I. J., & Hollowell, D. 1990,
ApJ, 349, 580 [NASA ADS] [CrossRef]
(In the text)
-
Hurlburt, N. E., Toomre, J., & Massaguer, J. M. 1986,
ApJ, 311, 563 [NASA ADS] [CrossRef]
- Iben, Jr., I. 1975,
ApJ, 196, 525 [NASA ADS] [CrossRef]
(In the text)
- Iben,
I., & Renzini, A. 1984, Phys. Rep., 105, 329 [NASA ADS] [CrossRef]
(In the text)
- Itoh, N., Hayashi,
H., Nishikawa, A., & Kohyama, Y. 1996, ApJS, 102, 411 [NASA ADS] [CrossRef]
(In the text)
-
Kifonidis, K., Plewa, T., Janka, H.-T., & Müller, E. 2003,
A&A, 408, 621 [NASA ADS] [CrossRef] [EDP Sciences]
-
Kifonidis, K., Plewa, T., Scheck, L., Janka, H.-T., &
Müller, E. 2006, A&A, 453, 661 [NASA ADS] [CrossRef] [EDP Sciences]
- Lattanzio, J., Dearborn, D.,
Eggleton, P., & Dossa, D. 2006
[arXiv:astro-ph/0612147]
(In the text)
- Meakin,
C. A., & Arnett, D. 2007a, ApJ, 665, 690 [NASA ADS] [CrossRef]
-
Meakin, C. A., & Arnett, D. 2007b, ApJ, 667, 448 [NASA ADS] [CrossRef]
- Müller,
E. 1998, in Computational methods for astrophysical fluid flow,
ed. O. Steiner & A. Gautschy (Berlin: Springer Verlag),
Lecture Notes in Physics, 27, 343
(In the text)
- Müller, E., & Steimnetz,
M. 1995, Comp. Phys. Comm., 89, 45 [NASA ADS] [CrossRef]
(In the text)
- Müller, E., Fryxell, B.,
& Arnett, D. 1991, in ESO/EIPC Workshop on Supernova 1987A and
other Supernovae, 99
-
Plewa, T., & Müller, E. 1999, A&A, 342, 179 [NASA ADS]
(In the text)
- Pope, S. B.
2000, Turbulent flows (The Press Syndicate of the University of
Cambridge)
-
Porter, D. H., & Woodward, P. R. 1994, ApJS, 93,
309 [NASA ADS] [CrossRef]
(In the text)
- Potekhin, A. Y., Chabrier,
G., & Yakovlev, D. G. 1997, A&A, 323, 415 [NASA ADS]
- Press,
W. H., Tukolsky, S. A., Vetterling, W. T., &
Flannery, B. P. 1992, in Numerical Recipes in FORTRAN, The Art
of Scientific Computing, Second Edition (Cambridge: Cambridge
University Press), 1
(In the text)
- Rogers,
F. J., Swenson, F. J., & Iglesias, C. A. 1996,
ApJ, 456, 902 [NASA ADS] [CrossRef]
(In the text)
- Schlattl, H., Cassisi, S.,
Salaris, M., & Weiss, A. 2001, ApJ, 559, 1082 [NASA ADS] [CrossRef]
- Sitine,
I. V., Porter, D. H., Woodward, P. R., Hodson,
S. W., & Winkler, K.-H. 2000, J. Comput. Phys., 158,
225 [NASA ADS] [CrossRef]
- Strang, G.
1968, SIAM J. Num. Anal., 5, 506 [CrossRef]
(In the text)
-
Sweigart, A. V., & Gross, P. G. 1978, ApJS, 36,
405 [NASA ADS] [CrossRef]
(In the text)
- Thomas, H.-C.
1967, Z. Astrophys., 67, 420 [NASA ADS]
(In the text)
-
Timmes, F. X., & Swesty, F. D. 2000, ApJS, 126,
501 [NASA ADS] [CrossRef]
(In the text)
- Turkel, E.
1999, Annu. Rev. Fluid Mech., 31, 385 [NASA ADS] [CrossRef]
(In the text)
- Villere,
K. R. 1976, Ph.D. Thesis, AA, Santa Cruz, California
Univ.
-
Weiss, A., & Schlattl, H. 2000, A&AS, 144, 487 [NASA ADS] [CrossRef] [EDP Sciences]
-
Weiss, A., & Schlattl, H. 2007, Ap&SS, 341
- Wickett,
A. J. 1977, in Problems of Stellar Convection,
ed. E. A. Spiegel, & J.-P. Zahn (Berlin: Springer
Verlag), Lecture Notes in Physics, 71, 284
-
Yakovlev, D. G., & Urpin, V. A. 1980, Sov. Astron.,
24, 303 [NASA ADS]
-
Zimmermann, R. 1970, Ph.D. Thesis, University of California at Los
Angeles
Copyright ESO 2008
![\begin{figure}
\par\includegraphics[width=7cm,clip]{0169fg11.eps}\end{figure}](/articles/aa/full/2008/40/aa10169-08/img53.gif)
![\begin{figure}
\par\includegraphics[width=7.2cm,clip]{0169fg21.eps}\end{figure}](/articles/aa/full/2008/40/aa10169-08/img54.gif)
![\begin{figure}
\par\includegraphics[width=6.8cm,clip]{0169fg22.eps}\hspace*{7mm}
\includegraphics[width=7.8cm,clip]{0169fg23.eps}\end{figure}](/articles/aa/full/2008/40/aa10169-08/img61.gif)
![\begin{figure}
\par\includegraphics[width=7.5cm,clip]{0169fg24.eps}\end{figure}](/articles/aa/full/2008/40/aa10169-08/img79.gif)
![\begin{figure}
\par\includegraphics[width=6.9cm,clip]{0169fg41.eps}\end{figure}](/articles/aa/full/2008/40/aa10169-08/img117.gif)
![\begin{figure}
\par\includegraphics[width=6.9cm,clip]{0169fg42.eps}\end{figure}](/articles/aa/full/2008/40/aa10169-08/img118.gif)
![\begin{figure}
\par\includegraphics[width=7.55cm,clip]{0169fg51.eps}\hspace*{1.3cm}
\includegraphics[width=7.3cm,clip]{0169fg52.eps}\end{figure}](/articles/aa/full/2008/40/aa10169-08/img128.gif)
![\begin{figure}
\par\includegraphics[width=5.25cm,clip]{0169btmp.eps}\hspace*{0.8...
....eps}\hspace*{1cm}
\includegraphics[width=5.1cm,clip]{0169ec12.eps}\end{figure}](/articles/aa/full/2008/40/aa10169-08/img132.gif)
![\begin{figure}
\par\includegraphics[width=7.5cm,clip]{0169f55a.eps}\hspace*{1.3c...
...eps}\hspace*{1.3cm}
\includegraphics[width=7.6cm,clip]{0169f55d.eps}\end{figure}](/articles/aa/full/2008/40/aa10169-08/img149.gif)
![\begin{figure}
\par\includegraphics[width=8.1cm,clip]{0169fg56.eps}\hspace*{7mm}
\includegraphics[width=7.85cm,clip]{0169fg57.eps}\end{figure}](/articles/aa/full/2008/40/aa10169-08/img156.gif)
![\begin{figure}
\par\includegraphics[width=7cm,clip]{0169fg58.eps}\hspace*{1.3cm}
\includegraphics[width=7.4cm,clip]{0169fg59.eps}\end{figure}](/articles/aa/full/2008/40/aa10169-08/img164.gif)