A&A 479, 533-539 (2008)
DOI: 10.1051/0004-6361:20078643
INTEGRAL observation of the accreting pulsar 1E1145.1-6141
C. Ferrigno1 -
A. Segreto1
-
T. Mineo1 -
A. Santangelo2 -
R. Staubert2
1 - IASF-Pa, via Ugo la Malfa 153, 90146 Palermo, Italy
2 -
IAAT, Abt. Astronomie, Universität Tübingen,
Sand 1, 72076 Tübingen, Germany
Received 10 September 2007 / Accepted 5 December 2007
Abstract
Aims. We analyze 1050 ks of INTEGRAL data of the high mass X-ray binary pulsar 1E 1145.1-6141 to study its properties over a long time baseline, from June 2003 to June 2004, with wide spectral coverage.
Methods. We study three high luminosity episodes, two of them at the system apoastron, three brightening with lower intensity, two at the periastron, and one extended period of intermediate luminosity spanning one orbital cycle. We perform a timing analysis to determine the pulse period and pulse profiles at different energy ranges. We also analyze the broad band phase averaged spectrum of different luminosity states and perform phase resolved spectroscopy for the first flare.
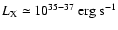
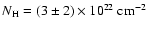
Results. From the timing analysis, we find a pulse period of  297 s around MJD 53 000 with a significant scatter around the mean value. From the spectral analysis we find that the source emission can be described by an absorbed bremsstrahlung model in which the electron temperature varies between 25 and 37 keV, without any correlation with luminosity, and the intrinsic absorbing column is constantly of the order of
 .
Phase resolved spectral analysis reveals a different temperature of the plasma in the ascending and descending edges of the pulse during the first flare. This justifies the pulse maximum shift by 0.4 phase units between 20 and 100 keV observed in the pulse profiles.
.
Phase resolved spectral analysis reveals a different temperature of the plasma in the ascending and descending edges of the pulse during the first flare. This justifies the pulse maximum shift by 0.4 phase units between 20 and 100 keV observed in the pulse profiles.
Conclusions. The comparison with the previous period measurements reveals that the source is currently spinning down, in contrast to the long term secular trend observed so far, indicating that at least a temporary accretion disk is formed. The study of the spectral property variations with respect to time and spin phase suggests the presence of two emitting components at different temperatures whose relative intensity varies with time.
Key words: X-rays: binaries - stars pulsars: individual: 1E 1145.1-6141
X-ray Binary Pulsars (XRBPs) were discovered more than 30 years ago
with the pioneer observation of Cen X-3 by Giacconi et al. (1971).
Although the basic mechanisms of the pulsed emission were
quickly understood (Pringle & Rees 1972; Davidson & Ostriker 1973), many puzzling aspects still persist.
In particular,
their wide band spectral behavior has not been completely explained on the
basis of a self consistent physical model; spectra are
successfully described by phenomenological models such as a power law modified
at high-energy by an exponential cut-off and
at low energy by intrinsic photo-electric absorption plus a
thermal component at 0.1 keV (di Salvo et al. 2004; Coburn et al. 2002).
XRBPs are powered by the accretion of ionized gas
from a nearby companion, an O or B star (
 )
in
High Mass X-ray Binaries (HMXBs), a later than type A star
or a white dwarf (
)
in
High Mass X-ray Binaries (HMXBs), a later than type A star
or a white dwarf (
 )
in Low Mass X-ray Binaries (LMXBs)
onto the surface of a black hole or neutron star (NS).
If the compact object is highly magnetized, with a surface field
as high as 1012 G,
the plasma is threaded at the magnetospheric boundary,
and then funneled to the magnetic poles (Pringle & Rees 1972; Davidson & Ostriker 1973) along the field lines;
pulsation is generated because of the
nonalignment between the magnetic and the rotational axes.
In HMXBs the plasma can be captured directly from the slow and dense equatorial stellar wind
of a Be star, or from the radiation driven wind of an early type super-giant.
In brighter systems, accretion can be also powered
by Roche-lobe overflow via an accretion disk.
)
in Low Mass X-ray Binaries (LMXBs)
onto the surface of a black hole or neutron star (NS).
If the compact object is highly magnetized, with a surface field
as high as 1012 G,
the plasma is threaded at the magnetospheric boundary,
and then funneled to the magnetic poles (Pringle & Rees 1972; Davidson & Ostriker 1973) along the field lines;
pulsation is generated because of the
nonalignment between the magnetic and the rotational axes.
In HMXBs the plasma can be captured directly from the slow and dense equatorial stellar wind
of a Be star, or from the radiation driven wind of an early type super-giant.
In brighter systems, accretion can be also powered
by Roche-lobe overflow via an accretion disk.
The systems with Be companions (often with appreciable orbital eccentricity)
are normally quiescent but sometimes they flare when
the NS passes through the companion's disk.
During these episodes the luminosity may increase
by a large factor, a temporary accretion disk may form, and the NS generally
spins up.
The bright HMXBs accreting from a stable accretion disk via Roche lobe overflow have rather short spin
and orbital periods, nearly circular orbits, and can exhibit torque reversal episodes superimposed on
a spin-up trend as observed for Cen X-3 (Bildsten et al. 1997).
Most wind-fed HMXBs with a super-giant companion
have long pulse periods (hundreds of seconds),
moderate and rather stable luminosity
(
 ), and can
spin-up or spin-down depending on the transfer of angular momentum
from the wind to the magnetosphere.
The pulse period evolution is then characterized by red-noise fluctuations due to the irregular accretion flow
as in the case of Vela X-1 (Bildsten et al. 1997).
Simulations have shown that a prograde or retrograde accretion disk,
which is not necessarily a true viscous disk,
may form and disrupt on time scales of 103 s, causing changes in the sign
of the pulse period derivative (Blondin et al. 1990), as observed in
the controversial case of the system with a supergiant companion OAO 1657-415
(Inam & Baykal 2000; Baykal 1997). A temporary accretion disk is also suggested to explain
the short episodes of spin-up, accompanied by luminosity enhancements, in the wind-fed binary GX 301-2
(Inam & Baykal 2000; Koh et al. 1997).
), and can
spin-up or spin-down depending on the transfer of angular momentum
from the wind to the magnetosphere.
The pulse period evolution is then characterized by red-noise fluctuations due to the irregular accretion flow
as in the case of Vela X-1 (Bildsten et al. 1997).
Simulations have shown that a prograde or retrograde accretion disk,
which is not necessarily a true viscous disk,
may form and disrupt on time scales of 103 s, causing changes in the sign
of the pulse period derivative (Blondin et al. 1990), as observed in
the controversial case of the system with a supergiant companion OAO 1657-415
(Inam & Baykal 2000; Baykal 1997). A temporary accretion disk is also suggested to explain
the short episodes of spin-up, accompanied by luminosity enhancements, in the wind-fed binary GX 301-2
(Inam & Baykal 2000; Koh et al. 1997).
From the Galactic plane monitoring
performed with the INTEGRAL satellite, a new class of HMXBs containing a neutron star and
super-giant (SG) donors has been identified: the Super-giant Fast X-ray Transients (SFXT),
characterized by short outbursts of X-ray emission
(Sguera et al. 2005,2006; Negueruela et al. 2006). The transient
behavior of these sources is explained by the motion in wide orbits (10 stellar radii)
through a clumpy SG wind (in't Zand 2005; Negueruela et al. 2006),
or to the recurrent passage of the NS through a denser equatorial wind component (Sidoli et al. 2007).
In this paper, we report on the INTEGRAL observations of one of the
less known HMXBs located very close ( )
to the extensively studied 4U 1145-61 (see e.g. Stevens et al. 1997), 1E 1145.1-6141.
Optical spectroscopy of its B2 Iae super-giant companion yields a distance
of
)
to the extensively studied 4U 1145-61 (see e.g. Stevens et al. 1997), 1E 1145.1-6141.
Optical spectroscopy of its B2 Iae super-giant companion yields a distance
of
 kpc (Densham & Charles 1982). X-ray
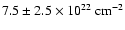
spectral analysis was first performed using the data in the energy range 0.5-3 keV
from the imaging proportional counter of the Einstein
observatory (Lamb et al. 1980) finding a column density of
kpc (Densham & Charles 1982). X-ray
spectral analysis was first performed using the data in the energy range 0.5-3 keV
from the imaging proportional counter of the Einstein
observatory (Lamb et al. 1980) finding a column density of
 .
This value
was confirmed, using the proportional counter array of the RXTE satellite in the energy range 2-60 keV,
by Ray & Chakrabarty (2002) who
modeled the spectrum using an absorbed cut-off power law with index
.
This value
was confirmed, using the proportional counter array of the RXTE satellite in the energy range 2-60 keV,
by Ray & Chakrabarty (2002) who
modeled the spectrum using an absorbed cut-off power law with index
 ,
cut-off energy
,
cut-off energy
 keV and e-folding energy
 keV.
They also measured the orbital parameters of the binary system
finding an eccentric (e=0.20)
orbit with period P=14.365 days,
keV.
They also measured the orbital parameters of the binary system
finding an eccentric (e=0.20)
orbit with period P=14.365 days,
 lt-sec,
periastron epoch
T0=51 008.1 MJD, and longitude of periastron
lt-sec,
periastron epoch
T0=51 008.1 MJD, and longitude of periastron
 .
They proposed, on the basis of previous
observations, a secular spin-up trend of 10-9 s/s between 1975 and 2000
(Ray & Chakrabarty 2002). The NS emission was characterized by a pulsed fraction of
50% in the 4-20 keV energy band and an X-ray luminosity of
1036 erg/s (Grebenev et al. 1992; Ray & Chakrabarty 2002; Hutchings et al. 1981).
Such a low luminosity is inconsistent with Roche lobe overflow
for this class of binaries
and indicates that the NS is almost certainly
accreting from the companion wind. The pulse shape has been studied
using the ART-B telescope on board the GRANAT observatory in the 3-60 keV energy range
by Grebenev et al. (1992) who found evidence of a notch
between the maximum and the minimum of the pulse; this feature
also appeared in the pulse shape obtained with RXTE
(Ray & Chakrabarty 2002).
.
They proposed, on the basis of previous
observations, a secular spin-up trend of 10-9 s/s between 1975 and 2000
(Ray & Chakrabarty 2002). The NS emission was characterized by a pulsed fraction of
50% in the 4-20 keV energy band and an X-ray luminosity of
1036 erg/s (Grebenev et al. 1992; Ray & Chakrabarty 2002; Hutchings et al. 1981).
Such a low luminosity is inconsistent with Roche lobe overflow
for this class of binaries
and indicates that the NS is almost certainly
accreting from the companion wind. The pulse shape has been studied
using the ART-B telescope on board the GRANAT observatory in the 3-60 keV energy range
by Grebenev et al. (1992) who found evidence of a notch
between the maximum and the minimum of the pulse; this feature
also appeared in the pulse shape obtained with RXTE
(Ray & Chakrabarty 2002).
Our paper studies the spectral and timing properties of
1E 1145.1-6141 between March 2003 and June 2004 using the data from
European Space Agency's International Gamma-Ray Astronomy Laboratory
(INTEGRAL) and is organized as follows: in
Sect. 2 we describe the observations, in
Sect. 3 we illustrate the scientific results which
are discussed in Sect. 4, and in
Sect. 5 we draw our conclusions.
2 Observation and data analysis
INTEGRAL, launched in October 2002, carries 3 co-aligned
coded mask telescopes.
- IBIS (Imager on Board the
INTEGRAL Satellite; Ubertini et al. 2003), which allows for
12 arcmin FWHM angular resolution imaging in the energy range from 15 keV to
600 keV with energy resolution of 8% at 100 keV and
 fully coded field of view. It is composed of a low energy
CdTe detector (15-600 keV), ISGRI (Lebrun et al. 2003), and a
CsI layer (175 keV-10 MeV), PICsIT (Labanti et al. 2003);
fully coded field of view. It is composed of a low energy
CdTe detector (15-600 keV), ISGRI (Lebrun et al. 2003), and a
CsI layer (175 keV-10 MeV), PICsIT (Labanti et al. 2003);
- SPI
(SPectrometer on INTEGRAL; Vedrenne et al. 2003),
sensitive from 20 keV to 8 MeV with an angular resolution
of
 and an energy resolution of a
0.2% at 1.3 MeV; the fully coded field of view is
and an energy resolution of a
0.2% at 1.3 MeV; the fully coded field of view is
 ;
;
- JEM-X (Joint European
X-ray Monitor; Lund et al. 2003) that includes two independent units JEM-X1
and JEM-X2, sensitive from 3 keV to 34 keV, with an
angular resolution of 1 arcmin and an energy resolution of 13%
at 10 keV; its fully coded field of view is
 .
.
INTEGRAL observations are divided in short periods
(of 2000 s each), called science windows (SCWs), during which
the telescope maintains the same pointing. From one science window to another,
the pointing follows a dithering or a survey strategy as chosen in the
observing program (Winkler et al. 2003).
To reduce and analyze JEM-X data we used the Off-line Science
Analysis (OSA) software version 5.1;
for ISGRI data we exploited also the software described
in Ferrigno et al. (2007) and Segreto & Ferrigno (2007). For the spectral analysis we used the
standard XSPEC package version 12.2.
In this paper we use the publicly available
INTEGRAL data in which 1E 1145.1-6141 was visible before
June 2004. Due to the ISGRI large field of view it has been
possible to observe the source for a total of 1.08 Ms
between June 2003 and June 2004, with a nearly continuous coverage of 2 binary orbits in 2004,
and a sparse coverage of two and a half orbits in 2003.
We limited our analysis to ISGRI and JEM-X data because the source is too weak
to be studied with SPI. As summarized in Table 1,
JEM-X detected the source only in a sub-set of the available SCWs,
because of its smaller field of view with respect to ISGRI.
![\begin{figure}
\par\includegraphics[width=8.2cm,clip]{8643F1_1.ps} \includegraphics[width=8.2cm,clip]{8643F1_2.ps} \end{figure}](/articles/aa/full/2008/08/aa8643-07/Timg24.gif) |
Figure 1:
Light curve of 1E 1145-6141 during the INTEGRAL
observations. From top to bottom, the data of
JEM-X (4-25 keV) and ISGRI (22-71 keV)
(from http://isdc.unige.ch/?Data+sources)
and the distance between the stars of the binary system expressed in light
seconds as computed from the ephemeris measured by Ray & Chakrabarty (2002).
The time intervals in which we performed the analysis are indicated in
the figure between vertical solid lines and labeled with the
corresponding name. |
| Open with DEXTER |
As can be seen from the light curves of Fig. 1,
we detected three flares of about the same intensity
(labeled H1, H2 and H3, where ``H'' is an abbreviation for High luminosity),
the first two occurred at the NS
apoastron, the last while the NS was moving away from the companion.
Apoastron flares of this source have been observed by the Burst Alert Telescope on
board Swift and reported by Corbet et al. (2007).
At MJD 53 144 (day 1600 in the scale of Fig. 1)
the source was so weak that it was pointless to perform any
analysis.
In the following orbital cycle, it exhibited weak and irregular luminosity
increases, none of which was intense enough to allow a dedicated analysis.
We then treated these data as a unique observation
named EI, meaning that the source had an Extended Intermediate
luminosity level.
We divided the rest of the observations into three intervals labeled L1, L2 and
L3 (where ``L'' is an abbreviation for Low luminosity),
during which the source exhibited less pronounced brightening. In the interval selection we
excluded the neighboring SCWs with few source counts to improve the S/N and
we separated L3 from EI since it has the appearance of a low luminosity flare occurring near
the system periastron, such as L1, rather than an extension of EI.
The L2 episode occurred while the NS was approaching the companion.
The H3 episode was reported by Bodaghee et al. (2004), who stated that a flare of this intensity
has never been mentioned in the literature for 1E 1145.1-6141.
But it should be noted that the source did present brightening
of the same intensity during the episodes here called H1 and H2.
To perform the timing analysis, we transformed the event arrival times
for each time interval listed in Table 1 to the Solar System
Barycenter and then to the Binary System Barycenter using the orbital parameters
found by Ray & Chakrabarty (2002). We determined the pulse period
with a version of the phase-shift method described extensively in
Ferrigno et al. (2007) and briefly summarized here.
Using the ISGRI data, which guarantee the best signal to noise ratio (S/N) and
time coverage, we find a tentative pulse period
from the Fourier analysis of the light curve. Then, using this value, we
accumulate a pulse profile ineach science window and determine
the phase of the pulse maximum.
Finally, from a parabolic fit of the pulse maximum phase as a
function of time, we find the optimal pulse period and an upper limit on its first derivative.
Unless differently stated, the errors in the paper are quoted at a  confidence level.
Table 1:
Summary of the INTEGRAL observations of 1E 1145.1-6141.
3 Results
3.1 Timing analysis
We measure the pulse period in the time intervals
reported in Table 2; during L1, L2 and L3 the statistics
is not sufficient for an independent determination.
The pulse period derivative is always too small to be directly
measured. In particular, during EI we find the  upper limit
 s/s.
Thus, during this orbital cycle the period variations do not exceed the long
term trend.
s/s.
Thus, during this orbital cycle the period variations do not exceed the long
term trend.
We plot in Fig. 2 our results together with
the period and the spin-up trend reported by Ray & Chakrabarty (2002).
We note that the INTEGRAL values
are significantly higher than the extrapolation of
the secular evolution measured by Ray & Chakrabarty (2002).
To verify the occurrence of a torque reversal, we computed the average value of our period determinations (
 s)
and of the last four RXTE results (
s)
and of the last four RXTE results (
 s): the difference
of
s): the difference
of
 s in five years suggests an average spin-down of
 s/s in
contrast to the previous spin-up trend of
s/s in
contrast to the previous spin-up trend of
 s/s. The source then
began to reduce its average angular speed on a time scale of years, even though fluctuations in the trend
are present.
At MJD 52 824.0 (H2) we found a period of
s/s. The source then
began to reduce its average angular speed on a time scale of years, even though fluctuations in the trend
are present.
At MJD 52 824.0 (H2) we found a period of
 s,
compatible with the RXTE determinations, but at more than
s,
compatible with the RXTE determinations, but at more than  from the other values we measured.
If the trend proposed by Ray & Chakrabarty (2002) is correct a torque reversal
would have taken place between RXTE and INTEGRAL observations around MJD 52 000; but we cannot exclude that the source was spinning down before MJD 45 000, spinning up until MJD 50 500 and then spinning up again. Unfortunately, the
poor determination of the pulse period by EINSTEIN at MJD 44 000 does not allow to verify this second hypothesis.
from the other values we measured.
If the trend proposed by Ray & Chakrabarty (2002) is correct a torque reversal
would have taken place between RXTE and INTEGRAL observations around MJD 52 000; but we cannot exclude that the source was spinning down before MJD 45 000, spinning up until MJD 50 500 and then spinning up again. Unfortunately, the
poor determination of the pulse period by EINSTEIN at MJD 44 000 does not allow to verify this second hypothesis.
Using the values of Table 2, we produced the
pulse profiles of the ISGRI data in the energy bands 15-35,
35-60, and 60-110 keV arbitrarily setting the zero phase at the pulse
minimum in the lowest energy range. The pulse profiles (Fig. 3)
show a similar shape over all the observing periods.
They are dominated by a single broad peak which moves to earlier phases with
increasing energy, and present also a hint of a second peak at phase 0.7,
which is reminiscent of the notch between the pulse maximum and minimum
reported by Grebenev et al. (1992) and Ray & Chakrabarty (2002).
However, some differences arise at
higher energy where the main peak has an increasing sharpness,
if the time intervals are put in the sequence EI,
H3, H1, and H2.
To investigate the evolution of the pulse profile with energy, we focus on
the H1 time interval when JEM-X exposure is long enough to accumulate pulse
profiles with an acceptable S/N below 20 keV.
The pulse profiles are modeled with a Gaussian plus a constant (reduced
 between 0.8 and 1.4 for 35 degrees of freedom) as shown in
Fig. 4.
We find that the width of the Gaussian remains constant with an average value
of
between 0.8 and 1.4 for 35 degrees of freedom) as shown in
Fig. 4.
We find that the width of the Gaussian remains constant with an average value
of
 while its centroid shifts to earlier phases for increasing energy:
between 2 and 8 keV the
pulse profile peaks at pulse phase
while its centroid shifts to earlier phases for increasing energy:
between 2 and 8 keV the
pulse profile peaks at pulse phase  ,
between 20 and 30 keV
at pulse phase
,
between 20 and 30 keV
at pulse phase  ,
and
above 80 keV at pulse phase
,
and
above 80 keV at pulse phase  .
The linear fit of the phase of the centroid position x as a function
of energy E gives:
.
The linear fit of the phase of the centroid position x as a function
of energy E gives:
![\begin{displaymath}x = (0.55\pm0.10) - (4.4 \pm 2.4)\times10^{-3} \frac{E}{{\rm [keV]}}\cdot
\end{displaymath}](/articles/aa/full/2008/08/aa8643-07/img42.gif) |
(1) |
Repeating the same procedure for the intervals H2, EI and H3 for the
ISGRI data alone, due to the poor quality or lack of JEM-X data,
we find that the relation of Eq. (1) is always verified.
However, the limited energy range prevents an independent
determination of the centroid evolution with energy.
In each observing period we perform broad band phase averaged spectral
analysis using ISGRI data and, whenever available, JEM-X data.
We investigate several spectral models and eventually find satisfactory fits
for a cut-off power law (
![$E^{-\gamma}\exp\left[-E/E_{\rm f}\right]$](/articles/aa/full/2008/08/aa8643-07/img43.gif) )
plus
photoelectric absorption, implemented as PHABS in XSPEC using the cross sections by Balucinska-Church & McCammon (1992),
and bremsstrahlung also attenuated by absorption.
But a discrimination between these models on a statistical base
is not possible because all fits give acceptable
values (see Table 3).
)
plus
photoelectric absorption, implemented as PHABS in XSPEC using the cross sections by Balucinska-Church & McCammon (1992),
and bremsstrahlung also attenuated by absorption.
But a discrimination between these models on a statistical base
is not possible because all fits give acceptable
values (see Table 3).
The cut-off power law model gives best fit values with
large uncertainties in most of the observing periods, probably
due to a strong correlation between the spectral index and the other
parameters. It is then difficult to find any significant trend of
the parameters with luminosity or time; nonetheless some conclusions can
be drawn: the lowest value of  (
(
 )
is
significantly higher than both the Galactic column
(
)
is
significantly higher than both the Galactic column
(
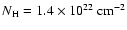 ;
Dickey & Lockman 1990) and the intrinsic column measured by
EINSTEIN (
;
Dickey & Lockman 1990) and the intrinsic column measured by
EINSTEIN (
 ,
Lamb et al. 1980); the measured spectral index of
the power law (1-1.5) is typical of several
HMXBs (Coburn et al. 2002).
,
Lamb et al. 1980); the measured spectral index of
the power law (1-1.5) is typical of several
HMXBs (Coburn et al. 2002).
Table 2:
Pulse periods (P) and the upper limits on its first derivatives ( ).
).
![\begin{figure}
\par\includegraphics[width=8cm,clip]{8643F2.eps} \end{figure}](/articles/aa/full/2008/08/aa8643-07/Timg57.gif) |
Figure 2:
Long-term evolution of the pulse period of 1E 1145.1-6141. The diamonds
after MJD 52 000 represent the results of our analysis. The crosses are the previous determinations,
and the solid line is the spin-up trend derived by Ray & Chakrabarty (2002).
|
| Open with DEXTER |
![\begin{figure}
\par\includegraphics[width=8.8cm,clip]{8643F3.eps} \end{figure}](/articles/aa/full/2008/08/aa8643-07/Timg58.gif) |
Figure 3:
Background subtracted pulse profiles of 1E 1145.1-6141 for different
periods in three energy bands.
|
| Open with DEXTER |
![\begin{figure}
\par\includegraphics[width=8cm,clip]{8643F4.ps} \end{figure}](/articles/aa/full/2008/08/aa8643-07/Timg59.gif) |
Figure 4:
Background subtracted pulse profiles of 1E 1145.1-6141 during H1. Below 20 keV the
data are from JEM-X, above from ISGRI. In each panel, the solid line is
the best fit pulse profile obtained adding a Gaussian
to a constant; the vertical dashed line is the position of the Gaussian
centroid.
|
| Open with DEXTER |
![\begin{figure}
\par\includegraphics[width=7cm,clip]{8643F5.eps} \end{figure}](/articles/aa/full/2008/08/aa8643-07/Timg60.gif) |
Figure 5:
Broad band unfolded energy spectra for the high state H1 and the low state L1.
Below 20 keV
data are from JEM-X, above this value from ISGRI. The model in both cases is
absorbed bremsstrahlung. The dashed line is the model used by
Ray & Chakrabarty (2002) with arbitrary normalization. |
| Open with DEXTER |
Table 3:
Summary of the results of spectral fits with two models:
cut-off power law and thermal bremsstrahlung, both modified by
photoelectric absorption.
The fluxes are computed directly from the source counts and are thus independent of the
adopted absorption; for comparison the flux of the Crab in the
20-50 keV energy band is
 .
The errors are at a 90% confidence level for one parameter of
interest (
.
The errors are at a 90% confidence level for one parameter of
interest (
 ).
).
In Fig. 5, we show the spectra in the low and high
luminosity states L1 and H1 together with the high energy cut-off model used by Ray & Chakrabarty (2002)
(
![$E^{-\gamma}\exp\left[-(E-E_{\rm c})/E_{\rm f}\right]$](/articles/aa/full/2008/08/aa8643-07/img103.gif) for
for
 and
and
 for
for
 ).
We note that in our data the source emission is considerably harder,
as confirmed by the higher value of the folding energy
).
We note that in our data the source emission is considerably harder,
as confirmed by the higher value of the folding energy
 keV when the spectra during H1 and H3 are
described by the same model of Ray & Chakrabarty (2002).
Fitting the spectra of the other observing periods with this function, we note
unreasonably large uncertainties in the parameters together with a
not better than
the values of Table 3. It is then evident that
the relatively low S/N of the INTEGRAL observations of this source
prevents the use of this phenomenological model, which has a redundant number of free parameters.
Since the source brightness in our observations is not greater than in the
past, we can exclude that this evolution is luminosity related.
keV when the spectra during H1 and H3 are
described by the same model of Ray & Chakrabarty (2002).
Fitting the spectra of the other observing periods with this function, we note
unreasonably large uncertainties in the parameters together with a
not better than
the values of Table 3. It is then evident that
the relatively low S/N of the INTEGRAL observations of this source
prevents the use of this phenomenological model, which has a redundant number of free parameters.
Since the source brightness in our observations is not greater than in the
past, we can exclude that this evolution is luminosity related.
From the best fit values of the bremsstrahlung model plotted in
Fig. 6, we note that the plasma temperature is variable
even if not correlated with the source luminosity.
Instead,
is always
higher than the Galactic column and does not present any significant
trend. We also verify that fixing the absorbing column at its
average value, the determinations of the plasma temperature do not
vary significantly.
During the time interval H1 the statistics allows us to perform broad band
phase resolved spectroscopy combining data from both ISGRI
and JEM-X. In the other time intervals the source is either too weak or
too off-axis for JEM-X to collect enough counts, and then
to significantly constrain the continuum parameters.
In this analysis we adopt the absorbed bremsstrahlung model, since it gives a good
description of the source emission with the lowest number of parameters.
We divide the pulse in five equally spaced phase intervals and
fit the spectra obtaining a reduced
 for 100 d.o.f. and the
the best fit parameters plotted in Fig. 7.
The value of
is approximately constant
(10
for 100 d.o.f. and the
the best fit parameters plotted in Fig. 7.
The value of
is approximately constant
(10
 ),
while the plasma temperature is higher at pulse phase 0-0.4
(ascending edge of the pulse) than at pulse phase 0.4-1 (descending edge).
Averaging the fitted values,
we find
),
while the plasma temperature is higher at pulse phase 0-0.4
(ascending edge of the pulse) than at pulse phase 0.4-1 (descending edge).
Averaging the fitted values,
we find
 keV and
 keV
corresponding to a variation of the temperature with a significance of
keV
corresponding to a variation of the temperature with a significance of  .
Fixing the value of
at
(the average over the spin period)
we obtain temperature determinations compatible with the previous case,
and a slight improvement in the significance of the variation (
.
Fixing the value of
at
(the average over the spin period)
we obtain temperature determinations compatible with the previous case,
and a slight improvement in the significance of the variation ( ).
The higher temperature in the rising part of the main
peak explains its shift
with energy since at increasing energy the hotter emission is prominent.
).
The higher temperature in the rising part of the main
peak explains its shift
with energy since at increasing energy the hotter emission is prominent.
The phase resolved spectral analysis in the other time intervals does not
give a statistically significant variation of the plasma temperature.
![\begin{figure}
\par\includegraphics[width=7.5cm,clip]{8643F6.eps} \end{figure}](/articles/aa/full/2008/08/aa8643-07/Timg114.gif) |
Figure 6:
Best fit parameters of the absorbed bremsstrahlung model as
function of the source luminosity.
In the left panel we plot the plasma temperature and in the right panel
the
of the intrinsic photoelectric absorber.
Errors are at 90% c.l. for one parameter of interest.
|
| Open with DEXTER |
![\begin{figure}
\par\includegraphics[angle=270,width=8.8cm,clip]{8643F7_1.eps} \includegraphics[angle=270,width=8.8cm,clip]{8643F7_2.eps} \end{figure}](/articles/aa/full/2008/08/aa8643-07/Timg115.gif) |
Figure 7:
Phase resolved spectral analysis results. Upper panel: the pulse profile during H1 in the 20-60 keV
energy range with the adopted phase intervals. Lower panel: the best fit parameters of the adopted model
(photo-electric absorbed bremsstrahlung) as a function of the pulse phase
during H1. From top to bottom we plot the hydrogen column density ,
the plasma
temperature kT, where
is a free parameter and where
is held fixed at
.
|
| Open with DEXTER |
4 Discussion
We obtain a good description of the source spectral energy distribution
using the absorbed bremsstrahlung model; this does not mean, alone, that
this is the real emission mechanism.
To check consistency, we compute from the expression of
the thermal bremsstrahlung emissivity, equation (87) of Longair (1999),
the quantity
 ,
where
,
where  is the electron density and V is the volume of the emitting region
for a pure hydrogen plasma emitting at the observed
temperature with a power compatible to the luminosity of the source.
Assuming for the accretion column
a radius of 100 m and deriving the mass accretion rate from the X-ray luminosity, it is possible
to estimate the order of magnitude of the electron density which implies a Compton optical
depth of order unity both in the vertical and in the horizontal
directions of the accretion column. Therefore, it is not possible to
ensure that Compton scattering is negligible, but, on the other
hand, it is not clear how much it distorts the underlying spectral energy
distribution.
is the electron density and V is the volume of the emitting region
for a pure hydrogen plasma emitting at the observed
temperature with a power compatible to the luminosity of the source.
Assuming for the accretion column
a radius of 100 m and deriving the mass accretion rate from the X-ray luminosity, it is possible
to estimate the order of magnitude of the electron density which implies a Compton optical
depth of order unity both in the vertical and in the horizontal
directions of the accretion column. Therefore, it is not possible to
ensure that Compton scattering is negligible, but, on the other
hand, it is not clear how much it distorts the underlying spectral energy
distribution.
Becker & Wolff (2007) recently showed that the observed spectrum of XRBPs is
well described by thermal and bulk Comptonization of
the optically thin bremsstrahlung and cyclotron emission from the accretion column.
Using the measured luminosity and distance of the source, we tested their model on the
spectrum with the best S/N, i.e. during H1. The fit was very good, suggesting that all the emission
comes from re-processing of an underlying bremsstrahlung with an electron temperature of
13 keV without any need for intrinsic absorption. Unfortunately, it was not possible to constrain
all the model parameters, especially the magnetic field,
due to the absence of absorption features.
However, we note that the spectral energy distribution
is very similar to absorbed bremsstrahlung and then, in data with relatively low
S/N, the two models are statistically equivalent.
The values we find for the plasma temperature
(higher than for the Becker and Wolff model)
and for the absorbing column depth should then be regarded as a useful parametrization of the
spectral energy distribution, rather than a measurement of the
plasma characteristics. The strong absorption could be due to an emission
turn-off at low energy, but could also be partially explained by the presence
of optically thick gas in the stellar wind e.g. a bow shock
formed by the X-ray pulsar radiation (Blondin et al. 1990).
Unfortunately, only observations with a better spectral resolutions
below 10 keV would detect the absorption edges
and then constrain significantly the column value.
More insight into the structure of the emission region can be achieved from the
pulse phase resolved spectroscopy.
The constant
at any phase indicates that the
low energy part of the spectrum is governed by a process isotropically
distributed around the NS or located far from it, while the bimodal temperature distribution
and the presence of
a notch in some pulse profiles (Fig. 3) suggest
the presence of two components at different temperatures in the magnetosphere
of 1E 1145.1-6141.
If their relative intensity is variable with time, the
different values of the plasma temperature in the phase averaged spectra between 25 and 40 keV
and the time modulation of the pulse shape would be justified.
Indeed, all the analyzed spectra can be fitted with a linear combination of
two bremsstrahlung models with fixed temperatures of 19 and 40 keV.
During three flares, the source reached 80-90 mCrab in the 20-50 keV
energy band. During three other periods it reached 30-40 mCrab,
but for one binary orbit (EI) it presented only
irregular and weak luminosity variation with an average flux of 20 mCrab.
Two of the most intense flares occurred at the apoastron,
the other at about two thirds of the maximum distance.
At the periastron the NS reached at most one third of the maximum luminosity.
This behavior rules out the hypothesis of a spherically symmetric wind, and of a
combination of disk and wind proposed to explain the periodic flares
in IGR J11215-5952 (Sidoli et al. 2007) or GX 301-2 (Pravdo & Ghosh 2001).
A complex wind environment with clumps or filaments of
higher density plasma is a more natural explanation of its irregular
luminosity increases, but our measurements do not allow a good spectral constraint of the
absorbing column, thus this hypothesis cannot be tested spectroscopically.
A clumpy stellar wind is invoked to explain the light curves of the super-giant fast X-ray transients (Leyder et al. 2007; in't Zand 2005)
characterized by short irregular flares lasting from a few ks to a fraction of a day.
The NS in these systems is thought to orbit at 10 stellar radii while in persistent systems
the separation is supposed to be smaller (Walter & Zurita Heras 2007).
We can estimate for 1E 1145.1-6141, on the basis of the
spectral type, a mass of 10  and a stellar radius
of 5
and a stellar radius
of 5  (Habets & Heintze 1981). From the measured orbital parameters,
we derive that the NS lies at about 10 stellar radii from the companion, with a distance modulation
of 20% due to the orbit eccentricity.
(Habets & Heintze 1981). From the measured orbital parameters,
we derive that the NS lies at about 10 stellar radii from the companion, with a distance modulation
of 20% due to the orbit eccentricity.
Although it is a persistent system, it has some characteristics similar to the SFXT:
in particular the component separation and the flaring activity.
However, compared to these objects, the flares are longer (from a significant fraction of a day to about four days) and have
a smaller relative (4-5) intensity with respect to the persistent flux level, which, in turn, is
two orders of magnitude larger. Supposing that the mechanism to capture the
plasma has similar efficiency in all systems, we infer that the wind is on average denser,
while the clumps are less compact than in SFXT,
making the system an intermediate case between transient and persistent wind-fed HMXBs with a super-giant companion.
Unfortunately, in our case, an estimate of the mass spectrum of the clumps
from the flare duration is not straightforward since the torque history
is characterized by local variations, and then the formation
of a temporary accretion disk is probable, which prevents the plasma from directly falling onto the NS surface.
Wind clumpyness appears a common feature in binary early type stellar wind suggesting further investigations
to clarify whether this can be due to the interaction with the NS
or is an intrinsic characteristic of the wind.
5 Conclusions
We confirm that 1E 1145.1-6141 is a persistent low luminosity binary system
but we find interesting peculiarities not previously noticed.
The source was always detectable, when in the instrument field of view, and
showed a complex light curve that strongly suggests a clumpy stellar wind.
The timing analysis shows that the pulse period of the source is not constant
(at the 98% confidence level). These variations of the torque are expected in wind-fed systems.
In addition we find that the source reversed its long term torque. The average of the measured pulse periods
is higher than the average of the RXTE observation (June 1997-January 2000) while Ray & Chakrabarty (2002)
found a previous spin-up trend. Unfortunately, the lack of continuous monitoring prevents us from
studing in more detail the torque history and the accretion model.
The absorbed bremsstrahlung model allows an
accurate parametrization of the source spectral characteristics, even though it cannot
be regarded as a coherent physical model,
since the Compton optical depth of the accretion column is of the order of unity.
We find that the plasma temperature
varies with no correlation to the source luminosity while the absorbing column
remains approximately constant.
A comparison with the model adopted in the previous RXTE observations
(Ray & Chakrabarty 2002) indicates a significant hardening of the spectrum
which cannot be explained by a different luminosity level.
Phase resolved spectroscopy
shows that the absorbing column depth is approximately constant, and
the plasmatemperature in the first half of the pulse profile is  keV higher than in
the second half. This justifies the pulse maximum shift by 0.4 phase units between 20 and 100 keV.
To describe the emission of 1E 1145.1-6141, we then propose the presence
of two spectral components at different temperatures
and, possibly, a layer of absorbing material
isotropically surrounding the NS or located far from it.
The variation of the components' relative intensity with time would also explain
the oscillations of the phase averaged temperature that we observe.
keV higher than in
the second half. This justifies the pulse maximum shift by 0.4 phase units between 20 and 100 keV.
To describe the emission of 1E 1145.1-6141, we then propose the presence
of two spectral components at different temperatures
and, possibly, a layer of absorbing material
isotropically surrounding the NS or located far from it.
The variation of the components' relative intensity with time would also explain
the oscillations of the phase averaged temperature that we observe.
Acknowledgements
The observational data used in this communication were
collected by INTEGRAL, an ESA science mission for
X-ray and Gamma-ray astronomy. The work was supported
by the Italian Space Agency (ASI) under contract No. I/R/023/05 and
by the German Space Agency (DLR) under
contract nos. 50 OG 9601 and 50 OG 0501.
C.F. would like to thank Rosario Iaria and the anonymous referee for their
useful comments and suggestions.
-
Balucinska-Church, M., & McCammon, D. 1992, ApJ, 400, 699 [NASA ADS] [CrossRef]
(In the text)
- Baykal, A.
1997, A&A, 319, 515 [NASA ADS]
- Becker,
P. A., & Wolff, M. T. 2007, ApJ, 654, 435 [NASA ADS] [CrossRef]
(In the text)
- Bildsten,
L., Chakrabarty, D., Chiu, J., et al. 1997, ApJS, 113,
367 [NASA ADS] [CrossRef]
(In the text)
- Blondin,
J. M., Kallman, T. R., Fryxell, B. A., & Taam,
R. E. 1990, ApJ, 356, 591 [NASA ADS] [CrossRef]
(In the text)
- Bodaghee, A., Mowlavi, N.,
& Ballet, J. 2004, The Astronomer's Telegram, 290, 1 [NASA ADS]
(In the text)
- Coburn, W.,
Heindl, W. A., Rothschild, R. E., et al. 2002, ApJ,
580, 394 [NASA ADS] [CrossRef]
- Corbet, R.,
Markwardt, C., Barbier, L., et al. 2007,
[arXiv:astro-ph/0703274]
(In the text)
- Davidson, K., &
Ostriker, J. P. 1973, ApJ, 179, 585 [NASA ADS] [CrossRef]
- Densham,
R. H., & Charles, P. A. 1982, MNRAS, 201, 171 [NASA ADS]
(In the text)
- di Salvo, T.,
Santangelo, A., & Segreto, A. 2004, Nuclear Physics B Proc.
Suppl. 132, 446
- Dickey,
J. M., & Lockman, F. J. 1990, ARA&A, 28, 215 [NASA ADS] [CrossRef]
(In the text)
- Ferrigno,
C., Segreto, A., Santangelo, A., et al. 2007, A&A, 462,
995 [NASA ADS] [CrossRef] [EDP Sciences]
(In the text)
- Giacconi, R., Gursky,
H., Kellogg, E., Schreier, E., & Tananbaum, H. 1971, ApJ, 167,
L67 [NASA ADS] [CrossRef]
(In the text)
- Grebenev,
S. A., Pavlinsk, M. N., & Syunyaev, R. A. 1992,
Sv A Lett. 18, 228
- Habets,
G. M. H. J., & Heintze, J. R. W. 1981,
A&AS, 46, 193 [NASA ADS]
(In the text)
-
Hutchings, J. B., Crampton, D., & Cowley, A. P. 1981,
AJ, 86, 871 [NASA ADS] [CrossRef]
- Inam,
S. Ç., & Baykal, A. 2000, A&A, 353, 617 [NASA ADS]
- in't Zand,
J. J. M. 2005, A&A, 441, L1 [NASA ADS] [CrossRef] [EDP Sciences]
- Koh, D. T.,
Bildsten, L., Chakrabarty, D., et al. 1997, ApJ, 479, 933 [NASA ADS] [CrossRef]
- Labanti, C., Di Cocco,
G., Ferro, G., et al. 2003, A&A, 411, L149 [NASA ADS] [CrossRef] [EDP Sciences]
(In the text)
- Lamb, R. C.,
Markert, T. H., Hartman, R. C., Thompson, D. J.,
& Bignami, G. F. 1980, ApJ, 239, 651 [NASA ADS] [CrossRef]
(In the text)
- Lebrun, F., Leray,
J. P., Lavocat, P., et al. 2003, A&A, 411, L141 [NASA ADS] [CrossRef] [EDP Sciences]
(In the text)
- Leyder, J.-C.,
Walter, R., Lazos, M., Masetti, N., & Produit, N. 2007,
A&A, 465, L35 [NASA ADS] [CrossRef] [EDP Sciences]
- Longair,
M. S. 1999, in X-Ray Spectroscopy in Astrophysics, ed.
J. van Paradijs, & J. A. M. Bleeker, LNP, 520,
p24
(In the text)
- Lund, N.,
Budtz-Jørgensen, C., Westergaard, N. J., et al.
2003, A&A, 411, L231 [NASA ADS] [CrossRef] [EDP Sciences]
(In the text)
-
Negueruela, I., Smith, D. M., Reig, P., Chaty, S., &
Torrejón, J. M. 2006, in The X-ray Universe 2005, ed.
A. Wilson, ESA Special Publication, 604, 165-170
- Pravdo,
S. H., & Ghosh, P. 2001, ApJ, 554, 383 [NASA ADS] [CrossRef]
(In the text)
- Pringle,
J. E., & Rees, M. J. 1972, A&A, 21, 1 [NASA ADS]
- Ray, P. S.,
& Chakrabarty, D. 2002, ApJ, 581, 1293 [NASA ADS] [CrossRef]
(In the text)
- Segreto, A.,
& Ferrigno, C. 2007, [arXiv:0709.4132]
(In the text)
- Sguera, V.,
Barlow, E. J., Bird, A. J., et al. 2005, A&A,
444, 221 [NASA ADS] [CrossRef] [EDP Sciences]
- Sguera, V.,
Bazzano, A., Bird, A. J., et al. 2006, ApJ, 646, 452 [NASA ADS] [CrossRef]
- Sidoli, L.,
Romano, P., Mereghetti, S., et al. 2007,
[arXiv:astro-ph/0710.1175]
(In the text)
- Stevens,
J. B., Reig, P., Coe, M. J., et al. 1997, MNRAS,
288, 988 [NASA ADS]
(In the text)
- Ubertini, P., Lebrun, F.,
Di Cocco, G., et al. 2003, A&A, 411, L131 [NASA ADS] [CrossRef] [EDP Sciences]
(In the text)
- Vedrenne, G., Roques, J.-P.,
Schönfelder, V., et al. 2003, A&A, 411, L63 [NASA ADS] [CrossRef] [EDP Sciences]
(In the text)
- Walter, R.,
& Zurita Heras, J. 2007, A&A, 476, 335 [NASA ADS] [CrossRef] [EDP Sciences]
(In the text)
- Winkler, C.,
Courvoisier, T. J.-L., Di Cocco, G., et al. 2003,
A&A, 411, L1 [NASA ADS] [CrossRef] [EDP Sciences]
(In the text)
Copyright ESO 2008
![\begin{figure}
\par\includegraphics[width=8.2cm,clip]{8643F1_1.ps} \includegraphics[width=8.2cm,clip]{8643F1_2.ps} \end{figure}](/articles/aa/full/2008/08/aa8643-07/img24.gif)
![\begin{figure}
\par\includegraphics[width=8cm,clip]{8643F2.eps} \end{figure}](/articles/aa/full/2008/08/aa8643-07/img57.gif)
![\begin{figure}
\par\includegraphics[width=8.8cm,clip]{8643F3.eps} \end{figure}](/articles/aa/full/2008/08/aa8643-07/img58.gif)
![\begin{figure}
\par\includegraphics[width=8cm,clip]{8643F4.ps} \end{figure}](/articles/aa/full/2008/08/aa8643-07/img59.gif)
![\begin{figure}
\par\includegraphics[width=7cm,clip]{8643F5.eps} \end{figure}](/articles/aa/full/2008/08/aa8643-07/img60.gif)
![\begin{figure}
\par\includegraphics[width=7.5cm,clip]{8643F6.eps} \end{figure}](/articles/aa/full/2008/08/aa8643-07/img114.gif)
![\begin{figure}
\par\includegraphics[angle=270,width=8.8cm,clip]{8643F7_1.eps} \includegraphics[angle=270,width=8.8cm,clip]{8643F7_2.eps} \end{figure}](/articles/aa/full/2008/08/aa8643-07/img115.gif)