A&A 479, 397-407 (2008)
DOI: 10.1051/0004-6361:20077810
Coexistence of chiral symmetry restoration and random orientation of galaxies
B. Aryal1,2 - S. Paudel2 - W. Saurer1
1 - Institut für Astrophysik, Universität Innsbruck, Technikerstraße 25, 6020 Innsbruck, Austria
2 -
Central Department of Physics, Tribhuvan University, Kirtipur, Kathmandu, Nepal
Received 8 May 2007 / Accepted 21 November 2007
Abstract
We studied the chiral symmetry restoration and the
spatial orientation of 2288 spiral and spiral barred galaxies
that have radial velocities (RV) less than 5000 km s-1. A
random direction of the rotation of galaxies is assumed in order
to classify the structural modes. The distribution of spin vector
and spin vector projections of leading and trailing arm galaxies
in the total sample and subsamples are studied. We use chi-square,
auto-correlation and Fourier tests in order to discriminate the
preferred alignments from the random alignments. A good
correlation between the random alignment and the chiral symmetry
is noticed in the Local Supercluster (RV < 3000 km s-1)
and in galaxies nearby the Local Supercluster (3000 < RV (km s-1)  5000). Spiral galaxies show a similar result.
The barred spirals show an opposite trend to that observed for the
spirals. Nearby the Local Supercluster, we noticed a preferred
spatial alignment and non-chiral property in the leading and
trailing arm spiral barred galaxies. Our result predicts that the
progressive loss of chirality might have some connection with the
rotationally supported (spirals, barred spirals) and randomized
(lenticulars, ellipticals) systems. Thus, we suspect that the
dynamical processes in the cluster evolution give rise to a
dynamical loss of chirality.
5000). Spiral galaxies show a similar result.
The barred spirals show an opposite trend to that observed for the
spirals. Nearby the Local Supercluster, we noticed a preferred
spatial alignment and non-chiral property in the leading and
trailing arm spiral barred galaxies. Our result predicts that the
progressive loss of chirality might have some connection with the
rotationally supported (spirals, barred spirals) and randomized
(lenticulars, ellipticals) systems. Thus, we suspect that the
dynamical processes in the cluster evolution give rise to a
dynamical loss of chirality.
Key words: Galaxy: formation - galaxies: statistics - Galaxy: evolution - Galaxy: structure
An object is said to be chiral if it cannot be superposed on its
mirror image, such as the letter ``B'' and its mirror image. These
objects do not show reflection symmetry, but may exhibit
rotational symmetry. In quantum field theory, chiral symmetry is a
possible symmetry of the Lagrangian, under which the left-handed
and right-handed parts of Dirac fields transform independently.
The chiral symmetry transformation can be divided into a component
that treats the left-handed and the right-handed parts equally,
known as vector symmetry, and a component that treats them
differently, known as axial symmetry. A non-chiral object is
called achiral and can be superimposed on its mirror image. Chiral
property is a key ingredient in different problems of theoretical
physics, from nonperturbative quantum cromodynamics to highly
doped semiconductors (Garcia-Garcia & Cuevas 2006). For
a pseudoscalar meson, it is found that the chiral symmetry
breaking decreases with increasing current-quark mass (Chang et al. 2007). Bagchi et al. (2006) studied the large
color approximation of the compact strange stars and discussed the
chiral symmetry restoration. They claimed that the chiral symmetry
restoration can be understood by exploring the possible existence
of strange stars in the Universe.
In principle, initial quantum fluctuations have been hugely
enhanced during the inflationary epoch, leading to the formation
of the large scale structure in the Universe (Peacock
1999; Liddle & Lyth 2000). Thus, the
macroscopic chirality should be related to some primordial
microscopic process, which has led to the large scale structures
observed today (Fall 1992). It is therefore interesting to
study the existence of chiral symmetry not only in microscopic
phenomena (L-neutrino, mesons, L-aminoacids, D-sugars, etc.), but
also in macroscopic ones (stars, clouds, galaxies, etc.).
By considering the group of transformations acting on the
configuration space, Capozziello & Lattanzi (2006)
claimed that the spiral galaxies exhibit chiral symmetry in the
large scale structure. In addition, they predicted that the
progressive loss of chirality might have some connection with the
rotationally-supported (spirals, barred spirals) and randomized
systems (lenticulars, ellipticals). Aryal et al. (2007a)
carried out a study to test Capozziello & Lattanzi's
(2006) prediction regarding the progressive loss of
chirality in the large scale structure. They concluded the
existence of chiral symmetry for both the spirals and the barred
spirals in the Local Supercluster (LSC). However, the Virgo
cluster galaxies show a preferred alignment: the galactic rotation
axes of leading and trailing structures are found to lie in the
equatorial plane. Aryal & Saurer (2005a) noticed a
preferred alignment for the late-type spirals and barred spirals
in the LSC. In addition, they found that the spin vector (SV)
projections of early- and late-type spirals show opposite
alignment. Their results hint the existence of the chiral
characterization.
In this work, we study the chiral symmetry and the spatial
orientation of the galaxies having radial velocity (RV) 5000 km s-1. We intend to study the correlation between the
chiral symmetry breaking and the preferred alignment of galaxies
in the total sample and subsamples. In addition, we ask the
following questions: (1) does chirality exist for the spirals and
barred spirals in our database; (2) does morphological dependence
exist concerning the spatial orientation of leading and trailing
arm galaxies; (3) do the subsamples of LSC and nearby LSC galaxies
exhibit chiral symmetry, (4) is there any correlation between the
chirality and the preferred alignment of galaxies; and (5) what
can we say about the chiral and achiral (non-chiral) properties of
the large scale structure.
First, in Sect. 2 we review past literatures concerning the
structural modes of the spiral galaxies. The data reduction
procedure and method of analysis are described in Sects. 3 and 4.
A discussion of the results concerning chiral symmetry and the
preferred spatial alignment is presented in Sects. 5 and 6.
Finally, we present the discussion, compare the results with the
previous works and draw conclusions in Sects. 7 and 8. Three
appendices concerning the determination of the SV and SV projections of galaxies (A), removal of selection effects (B) and
the statistics (C) are added.
In order to understand true structural modes (leading or trailing)
of spiral galaxies, we need to know the direction of the spiral
pattern (S- or Z-shaped), the approaching and receding sides and
the near and far parts, since galaxies are commonly inclined in
space to the line of the sight. The S and Z-patterns can be
determined from the image of the galaxy. Similarly, the
approaching and receding sides can be defined if spectroscopic
data on rotation is available. Determining the near and far parts,
however, is fairly hard to establish. For this, Pasha
(1985) used ``tilt'' criteria and studied the sense of
winding of the arms in 132 spirals. He found 107 spirals to have
trailing arms. It should be remembered that the classical ``tilt''
criteria is based on the visible asymmetry of a dust matter
distribution. It is well known that the dark matter (DM) halo
generally dominates the dynamics of the galaxies. Ostriker et al.
(1974) predicted that the DM is concentrated in the
extended galactic halos. A significant role of DM halos is
expected by the standard CDM model of hierarchical galaxy
formation. In our own galaxy, the observed rotation of the stars
and gas clouds indicates that the visible matter is surrounded by
a halo of this DM containing the major portion of the total galaxy
mass and extending very far beyond the visible matter (Olling &
Merrifield 2000). The nature of DM in the galactic halo
of spiral galaxies is still undetermined. Thomasson et al.
(1989) studied theoretically and performed N-body
simulations in order to understand the formation of spiral
structures in retrograde galaxy encounters. Interestingly, they
noticed the importance of halo mass. They concluded that the
spirals that have halos with masses larger than the disk mass
exhibit leading pattern.
Differential rotation in a galaxy's disc generates density waves
in the disc, leading to spiral arms. According to gravitational
theory, the spiral arms are born as leading and subsequently
transform to trailing modes. With the passage of time, the spiral
pattern deteriorates gradually by the differential rotation of the
plane of the galaxy, but the bar structure persists for a long
time (Oort 1970a). This structure can again regenerate
spiral patterns in the outer region. Thus, a close relation
between the origin of the leading and the trailing arm of the
galaxies cannot be denied (Oort 1970b). Thus, the makeup of
galactic halos is important to cosmology in order to understand
the winding sense of spiral galaxies.
Sugai & Iye (1995) used statistics to study the winding
sense of galaxies (S- and Z-shaped) in 9825 spirals. No
significant dominance from a random distribution is noticed. Aryal
& Saurer (2005a) studied the spatial orientations of SVs
of 4073 galaxies in the LSC. No preferred alignment is found.
These results hint that the distribution of angular momentum of
galaxies is entirely random in two- (S- and Z-shaped) and
three-dimensional (SV) analysis, provided the database is rich.
Thus, one can assume that the choice of rotation for a galaxy
might be random for an observer.
We used the NASA Extragalactic Database
(http://nedwww.ipac.caltech.edu/) to compile the sample galaxies.
The selection criteria were: (1) RV of the galaxy <5000 km s-1, (2) the morphology should be defined, (3) the diameters,
magnitude and the position angle should be given, and (4) the arm
patterns (S- or Z-shaped) should be visible.
The galaxies of the clusters A0426 (mean RV  5366 km s-1, 75
  5 Mpc) and A3627 (mean RV 4881 km s-1, 63 4 Mpc) are superimposed in our database (Abell
et al. 1989; Struble & Rodd 1999). We removed
these cluster galaxies using Brunzendorf & Meusinger
(1999), Photometric Atlas of Northern Bright Galaxies
(Kodaira et al. 1990) and the Uppsala Galaxy Catalogue
(Nilson 1973).
5 Mpc) and A3627 (mean RV 4881 km s-1, 63 4 Mpc) are superimposed in our database (Abell
et al. 1989; Struble & Rodd 1999). We removed
these cluster galaxies using Brunzendorf & Meusinger
(1999), Photometric Atlas of Northern Bright Galaxies
(Kodaira et al. 1990) and the Uppsala Galaxy Catalogue
(Nilson 1973).
Las Campanas Redshift Survey (Shectman 1996) is used to
compile the RVs of the galaxies. The position angle (PA) and the
diameters of galaxies were added from the Uppsala Galaxy Catalogue
(Nilson 1973), Uppsala obs. General Catalogue, Addendum
(Nilson 1974), Photometric Atlas of Northern Bright
Galaxies (Kodaira et al. 1990), ESO/Uppsala Survey of
the European Southern Observatory (Lauberts 1982),
Southern Galaxy Catalogue (Corwin et al. 1985) and Third
Reference Catalogue of Bright Galaxies (de Vaucouleurs et al.
1991).
The determination of the direction of rotation of the galaxies is
a difficult problem. In order to determine true rotation, huge
spectroscopic data is needed. In addition, one should identify
which side of the galaxy is towards and which side is far from us.
These data were available only for a few galaxies. The direction
of rotation and the arm patterns (S- and Z-shaped) should be known
in order to distinguish the structural modes (leading and
trailing) of a spiral galaxy. The leading mode is one whose outer
tip points towards the direction of galactic rotation (see Fig. 1a). Similarly, the outer tip of trailing mode directs in the
direction opposite to the galactic rotation. The arm patterns (S-
or Z-shaped) can be studied from the images of the galaxies.
Without knowing actual rotation, it is impossible to identify the
true mode. We assume that the choice of rotation of an individual
galaxy is random for a observer. We used computer to give random
directions to our galaxies. Thus, each galaxy got a virtual
direction by the computer. In this way, we identified structural
modes of galaxies in our database. For individual galaxies, these
structural modes might be incorrect. As a whole, it certainly
reveals the secret (to some extent) in the subjective sense. In
addition, we have information regarding the morphology, diameters,
inclination angle, RVs, and magnitudes of individual galaxies in
order to study true spatial orientations of SVs of galaxies.
In this way, we compiled a database of 2288 galaxies, which we
classified into two groups: leading and trailing. An example of
``S'' and ``Z'' patterns are shown in Fig. 1b. All sky distribution of
leading and trailing patterns is shown in Fig. 2a. We further
classify the total galaxies into LSC (RV 3000 km s-1) and nearby LSC (3000 < RV (km s-1) 5000) galaxies. Our database includes
667LSC and 1621 nearby
LSC galaxies. These galaxies are shown in Figs. 2b, c.
Several groups and aggregations of the galaxies can be seen in the
all-sky distribution of LSC and nearby LSC galaxies (Figs. 2b, c)
The inhomogeneous distribution of the positions of the galaxies
might be the selection effects for the galaxy orientation study
(Aryal & Saurer 2000, 2001).
The inclination angle (i) of galaxies was estimated using
Holmberg's (1946) formula:  = [(b/a)2-q2]/(1-q2), with b/a the measured axial
ratio and q the intrinsic flatness. We used the intrinsic
flatness value as suggested by Haynes & Giovanelli
(1984) and estimated the inclination angle of our
galaxies. Haynes & Giovanelli (1984) suggested
different q values for different types of galaxies, ranging from
q = 0.23 (for ellipticals) to q = 0.10 (for late-type spirals). We
used q = 0.20 for morphologically unidentified galaxies.
= [(b/a)2-q2]/(1-q2), with b/a the measured axial
ratio and q the intrinsic flatness. We used the intrinsic
flatness value as suggested by Haynes & Giovanelli
(1984) and estimated the inclination angle of our
galaxies. Haynes & Giovanelli (1984) suggested
different q values for different types of galaxies, ranging from
q = 0.23 (for ellipticals) to q = 0.10 (for late-type spirals). We
used q = 0.20 for morphologically unidentified galaxies.
The RV, inclination angle, major diameter and the magnitude
distributions of the leading and trailing arm LSC and nearby LSC
galaxies are shown in Fig. 3. In the histogram, the grey-shaded
bar and the solid circle with error bars represent the number of
leading and trailing arm galaxies, respectively.
![\begin{figure}
\par\includegraphics[height=9.5cm]{7810fig1.eps}
\end{figure}](/articles/aa/full/2008/08/aa7810-07/Timg23.gif) |
Figure 1:
a) Trailing and leading structures of spiral galaxies.
Spiral arms can be distinguished according to their orientation
relative to the direction of rotation of the galaxy. The outer tip
of a leading arm galaxy points towards the direction of galactic
rotation, whereas the trailing arm is one whose outer tip directs
in the direction opposite to the galactic rotation. b) An example
of ``S'' and ``Z'' arm pattern galaxies in our database. The name and
the RV of the galaxies are given in the image. |
| Open with DEXTER |
![\begin{figure}
\par\includegraphics[height=4.2cm]{7810f02a.eps} \includegraphics...
...3.85cm]{7810f02b.eps} \includegraphics[height=4.1cm]{7810f02c.eps}
\end{figure}](/articles/aa/full/2008/08/aa7810-07/Timg24.gif) |
Figure 2:
All-sky distribution of the total a), LSC (RV < 3000 km
s-1) b), and nearby LSC galaxies (3000 RV
(km s-1) < 5000) c). The symbols `` '' (``+'') and `` '' (``+'') and `` ''
(`` ''
(`` '') represent the trailing (leading)
patterns in the nearby LSC and LSC galaxies, respectively. '') represent the trailing (leading)
patterns in the nearby LSC and LSC galaxies, respectively. |
| Open with DEXTER |
![\begin{figure}
\par\mbox{\includegraphics[height=4.1cm]{7810f03a.eps} \includegr...
...1cm]{7810f03g.eps} \includegraphics[height=4.1cm]{7810f03h.eps} }
\end{figure}](/articles/aa/full/2008/08/aa7810-07/Timg25.gif) |
Figure 3:
The RV a), b), inclination angle c), d),
major diameter e), f) and the magnitude distribution g), h) of
the leading and the trailing patterns in the LSC and nearby LSC galaxies.
The statistical 1 error bars are shown for the trailing (
 )
subsample.
The solid line c), d) represents the expected distribution. )
subsample.
The solid line c), d) represents the expected distribution. |
| Open with DEXTER |
The database of LSC galaxies is dominated by the galaxies that
have RV  1200 km s-1 whereas the database of nearby
LSC galaxies is found to be homogeneous (Figs. 3a, b). The
inclination angle distribution shows a good agreement with the
expected cosine distribution in the limit 75
1200 km s-1 whereas the database of nearby
LSC galaxies is found to be homogeneous (Figs. 3a, b). The
inclination angle distribution shows a good agreement with the
expected cosine distribution in the limit 75

 (Figs. 3c, d). The lack of low inclination
angle galaxies can be seen in Figs. 3c, d. This is the major
selection effect in our database. In our database, the preferred
size (i.e., major diameter) of the LSC and nearby LSC galaxies are
found 1-4 arcmin and 0.5-2 arcmin, respectively (Figs. 3e, f).
Similarly, the majority of LSC and nearby LSC galaxies have
magnitudes in the range 11-15 and 13-16, respectively (Figs. 3g, h).
(Figs. 3c, d). The lack of low inclination
angle galaxies can be seen in Figs. 3c, d. This is the major
selection effect in our database. In our database, the preferred
size (i.e., major diameter) of the LSC and nearby LSC galaxies are
found 1-4 arcmin and 0.5-2 arcmin, respectively (Figs. 3e, f).
Similarly, the majority of LSC and nearby LSC galaxies have
magnitudes in the range 11-15 and 13-16, respectively (Figs. 3g, h).
We classified the database of LSC and nearby LSC galaxies into 25
and 30 subsamples for both the leading and trailing modes on the
basis of the morphology, RV, inclination angle, major diameter and
magnitude of galaxies. The chiral properties of the galaxies in
these subsamples are studied in Sect. 4.
For a subsample to show chiral symmetry, we set the difference
between the number of leading and trailing modes,
 5%. The chiral symmetry is assumed to be violated when > 5%.
We classify the total sample into various subsamples on the basis of
the morphology, RV, inclination angle, major diameters and the
magnitude of the galaxies. Basic statistics is used to study the
difference between the number of leading and trailing arm galaxies
in the subsample.
Thus, the preferred structural modes (leading or trailing arm) are
studied in the subsamples of LSC (RV < 3000 km s-1),
nearby LSC (3000 < RV (km s-1)
5000) and total
(RV < 5000 km s-1) galaxies, separately. Finally,
possible explanations of the dominance of leading or trailing arm
galaxies in the subsamples are discussed. In addition, the
chirality loss sequence will be explained.
We assume an isotropic distribution as a theoretical reference to
study the preferred orientation in the LSC (RV < 3000 km s-1), nearby LSC
(3000 < RV (km s-1) 5000)
and total (RV < 5000 km s-1) galaxies, separately. For
this, we use ``PA-inclination'' method as proposed by Flin &
Godlowski (1986) in order to convert two dimensional
parameters (i.e., PA) into three dimensional parameters (i.e.,
polar and azimuthal angles) (Appendix A). The selection effects in
the database are removed and the expected isotropic distribution
for polar ( )
and azimuthal (
)
and azimuthal ( )
angles are determined
using the method proposed by Aryal & Saurer (2000)
(Appendix B). We use the supergalactic coordinate system as a
reference. In order to measure the deviation from the isotropic
distribution we carried out three statistical tests: chi-square,
auto-correlation and the Fourier (Appendix C).
)
angles are determined
using the method proposed by Aryal & Saurer (2000)
(Appendix B). We use the supergalactic coordinate system as a
reference. In order to measure the deviation from the isotropic
distribution we carried out three statistical tests: chi-square,
auto-correlation and the Fourier (Appendix C).
The polar and azimuthal angle distributions in the 10 sample and
subsamples of the leading and trailing arm LSC, nearby LSC and
total galaxies are studied.
Table 1 summarizes of the database of leading and trailing arm
galaxies in the LSC and nearby LSC galaxies compiled by Aryal et al. (2007a, present work). The last four rows give a brief
statistics of the leading and trailing arm galaxies that have RV 5000 km s-1
(LSC + nearby LSC, total hereafter).
The percentage differences (%) between the total leading
and trailing arm galaxies are found to be less than 5% in the LSC
(subsample T1), nearby LSC (subsample T2) and total galaxies
(subsample T3). Aryal et al. (2007a) noticed chiral
symmetry violation in the Virgo cluster region. This violation
leads the LSC spirals (S1) to give > 5%. In addition,
value is found to be >5% in the subsamples O1, SB2,
O2 and SB3. It seems that the SB galaxies do not exhibit chiral
symmetry.
We study the inclination angle, RV, magnitude and major diameter
dependence concerning the chiral symmetry in the LSC, nearby LSC
and total galaxies (Table 2). At the end, a general discussion
will be presented.
Table 1:
Statistics of leading (Col. 3) and trailing (Col. 4) patterns in the
LSC, nearby LSC and total (LSC + nearby LSC) galaxies. The fifth column gives the percentage
difference ( = (T-L)/(T+L) 100) between the trailing (T) and the leading (L) structural modes.
The last column gives the error: (%) = (
 -
- )/(
)/(
 +
+  ) 100.
The sample/subsample and their abbreviations are given in the first two columns.
) 100.
The sample/subsample and their abbreviations are given in the first two columns.
Table 2:
Statistics of leading and trailing patterns in the subsamples of LSC, nearby LSC and total (LSC + nearby LSC) galaxies.
The sample/subsample and their abbreviations are given in the first two columns.
The symbols RV, i, a and m represent the radial
velocity, inclination angle, major diameter and the magnitude of galaxies.
Other symbols and the explanations are as in Table 1.
Figure 4 shows the comparison between the leading and trailing arm
galaxies in the subsamples as listed in Table 2. The (%)
in Table 2 and Fig. 4 represent the percentage difference between
the number of trailing and leading arm galaxies. In Fig. 4, the
grey-shaded region corresponds to the region showing %
value 5%.
Out of 22, 12 subsamples (54%) show the % value > 5%. Seven subsamples give the % value > 10%. A significant dominance (% = -20%) of
trailing structural mode is noticed for the galaxies that have RVs
2400 to 2700 km s-1 (Table 2). Leading modes dominate
( > 12%) for the galaxies that have RVs 1800 to
2400 km s-1. Interestingly, these subsamples (RV4, RV5,
RV6) compensate each other to give
value 0%, suggesting
the existence of chiral symmetry in high RV LSC galaxies. However,
the chiral symmetry violation cannot be denied in the subsamples.
The dominance (% > 8%) of leading and trailing
structural modes is noticed for low
(20 i < 30)
and high inclination (60 i < 70)
galaxies, respectively. Similar to this
result, the low (m < 14) and high magnitude (m > 14) galaxies show an excess number of trailing and leading arm
galaxies, respectively. A dominance of trailing structural modes
is found for the galaxies that have a > 3 arcmin. These
findings are interesting in the context of the Virgo cluster.
i < 30)
and high inclination (60 i < 70)
galaxies, respectively. Similar to this
result, the low (m < 14) and high magnitude (m > 14) galaxies show an excess number of trailing and leading arm
galaxies, respectively. A dominance of trailing structural modes
is found for the galaxies that have a > 3 arcmin. These
findings are interesting in the context of the Virgo cluster.
![\begin{figure}
\par\includegraphics[height=3.5cm]{7810fig4.eps}
\end{figure}](/articles/aa/full/2008/08/aa7810-07/Timg33.gif) |
Figure 4:
The basic statistics of the leading and trailing
patterns in the subsamples. The X-axis represents
the number corresponding to the subsample listed in the second column
of Table 2. See Table 1 for the explanation of .
The grey-shaded region ( 5%) represents
the region of chiral symmetry. |
| Open with DEXTER |
Aryal et al. (2007a) noticed two groups of galaxies in the
Virgo cluster region. In these groups, the dominance of trailing
and leading structural modes are found. They concluded that the
aggregation of the leading and trailing arm galaxies might have
already started in the Virgo cluster region. This process might
lead to the violation of chiral symmetry in the subsamples.
Seven subsamples (26%) of nearby LSC galaxies have an %
value >5%. These galaxies are not the cluster galaxies.
Thus, the chiral symmetry is found to be stronger for the field
galaxies than the LSC galaxies.
Similar to the subsamples RV4, RV5 and RV6, the subsamples RV8 and
RV9 compensate each other to give < 5%. A significant
dominance of trailing structural modes is noticed for the galaxies
that have RVs 4000 to 4200 km s-1. The galaxies having 15 m 16 show an excess number of leading arm galaxies
(Table 2).
No preferred structural modes are noticed for 20 subsamples,
suggesting the existence of chiral symmetry in the field galaxies.
Thus, it seems that the chiral symmetry of field galaxies is
independent of the inclination angle, RVs, magnitude and the size
of the galaxies.
The leading and trailing arm galaxies that have RV
5000 km s-1 show the value merely 1% (Table 1). This
result strongly advocates the existence of chiral symmetry in the
large scale structure. For the spirals, the difference between the
number of leading and trailing arm galaxies is insignificant (<0.5%). Thus, the chiral symmetry is found to be strong for the
spirals.
A significant dominance (
 %) of trailing structural
modes is noticed in the barred spirals. Thus, the violation of
chirality in the SB galaxies can be suspected.
%) of trailing structural
modes is noticed in the barred spirals. Thus, the violation of
chirality in the SB galaxies can be suspected.
No significant dominance (
 %) of either
face-on or edge-on leading or trailing arm galaxies is noticed
when the database of LSC (Aryal et al. 2007a) and nearby LSC
galaxies was added (Table 2). A dominance of trailing and leading
modes are noticed for the low (m < 13) and high magnitude
(m < 15) galaxies, respectively. Similarly, a dominance
( > -5%) of trailing modes is noticed for the galaxies
that have a > 3 arcmin.
%) of either
face-on or edge-on leading or trailing arm galaxies is noticed
when the database of LSC (Aryal et al. 2007a) and nearby LSC
galaxies was added (Table 2). A dominance of trailing and leading
modes are noticed for the low (m < 13) and high magnitude
(m < 15) galaxies, respectively. Similarly, a dominance
( > -5%) of trailing modes is noticed for the galaxies
that have a > 3 arcmin.
In Fig. 4, we can see the convergence of the scatter plots when
moving from LSC subsamples (solid circle) to the LSC + nearby LSC
subsamples (solid triangle). This suggests the importance of good
statistics in the study of chirality of galaxies. In addition,
violation of chirality can be suspected more in bounded system
(clusters, e.g. LSC) than in the open system (field, e.g. nearby
LSC).
![\begin{figure}
\par\includegraphics[height=3.9cm]{7810f05a.eps} \includegraphics[height=3.9cm]{7810f05b.eps}
\end{figure}](/articles/aa/full/2008/08/aa7810-07/Timg36.gif) |
Figure 5:
The expected polar ()
a) and azimuthal angle ()
distribution
b). The solid and the dashed line represent the expected
distribution curves for LSC (RV
3000 km s-1) and nearby LSC
(3000 < RV (km s-1) 5000) galaxies. The dotted line represents
expected distribution when there are no selections on inclination angle and positions. |
| Open with DEXTER |
Table 3:
Statistics of the polar ()
and azimuthal angle ()
distribution of leading and trailing patterns in the LSC,
nearby LSC and total galaxies (first column). The second and third
columns give the chi-square probability (
 )
and
correlation coefficient (C/C()) for leading arm galaxies.
The next two columns list the values of first order Fourier
coefficient (
)
and
correlation coefficient (C/C()) for leading arm galaxies.
The next two columns list the values of first order Fourier
coefficient (
 /(
)) and first order
Fourier probability P(
/(
)) and first order
Fourier probability P(
 )
for leading arm galaxies. The
last four columns repeat the previous columns for the trailing arm
galaxies.
)
for leading arm galaxies. The
last four columns repeat the previous columns for the trailing arm
galaxies.
We checked the effect of random distribution by repeating it five
more times. Interestingly, the results for all subsamples agree
within 5% error limit. This consistency advocates our
assumption regarding the direction of rotation of the galaxy for
an observer.
We assumed spatial isotropic distribution and supergalactic system
as a theoretical reference for LSC, nearby LSC and total (LSC + nearby LSC) galaxies. This spatial reference distribution gives
further reference distributions for the polar ()
and
azimuthal angles ()
with respect to the LSC plane.
Aryal & Saurer (2000) concluded that the expected
isotropic
and -distribution curves change with
positions (longitude, latitude) when making selections on the
inclination angle. A number of edge-on and face-on galaxies are
missing in our database (Figs. 3c, d). We have taken this fact in
the simulation and found different expected
and
-distribution curves for LSC and nearby LSC galaxies (Fig. 5). The isotropic distribution curves are based on calculations
including 106 virtual galaxies.
As a next step, our observations was compared with these isotropic
distributions in both the polar ()
and azimuthal angle (). For this comparison we used three different statistical
tests: chi-square, auto-correlation and the Fourier.
The bin size was chosen to be 10
for
and 20
for
distributions in the statistics. The ranges for the
angles
and
are 0
to 90
and
-90
to +90
,
respectively. The statistically poor
bins (number of solution <5) are omitted in the analysis. The
conditions for anisotropy are the following: the chi-square
probability P( ) < 0.050, correlation coefficient
C/
) < 0.050, correlation coefficient
C/ > 1, first order Fourier coefficient
/
> 1, first order Fourier coefficient
/
 ) > 1, and the first
order Fourier probability P(
) < 0.150, as used by
Aryal & Saurer (2004).
) > 1, and the first
order Fourier probability P(
) < 0.150, as used by
Aryal & Saurer (2004).
Table 3 lists the statistical parameters for the leading and
trailing subsamples of LSC, nearby LSC and total galaxies.
In the polar angle ()
distribution, all three statistical
tests show isotropy for both the leading and trailing pattern LSC
galaxies (Table 3). A good agreement between the expected and
observed distribution can be seen in Fig. 6a. Thus, no preferred
alignment is found in the SV orientations of leading and trailing
galaxies that have RV < 3000 km s-1. In the azimuthal
angle distribution, a hump at -80
(>1.5)
can be
seen for the trailing mode (Fig. 6b). This hump causes the Fourier
parameters
/(
)
and
P(
)
to be -1.7 and 5.5%, respectively. These values
suggest a preferred alignment: the SV projections of galaxies tend
to orient tangentially with respect to the Virgo cluster center.
In the leading mode, a hump at 60
(<1.5)
is not
sufficient to make the statistics anisotropy (Fig. 6b). Thus, we
conclude a random alignment for leading patterns of LSC galaxies
in the -distribution.
The trailing arm spirals show isotropy in both the
and
-distributions. No humps and dips can be seen (Table 3, Figs. 6c, d). The
is found 1.5
for leading arm
spirals in both the
and -distribution. However, the
P(
),
and C/C()
values are found well
within the error limit (Table 3). Hence, weak anisotropy can be
suspected in the leading pattern spirals whereas no preferred
alignment is noticed in the trailing patterns.
The leading and trailing spiral barred galaxies in the LSC show
isotropy in both the
and -distributions. A very
good agreement between the observed and expected distribution can
be seen in Figs. 6e, f. Thus, the trailing pattern spirals and
barred spirals that have RV < 3000 km s-1 show a random
orientation in both the
and -distributions.
![\begin{figure}
\par\mbox{\includegraphics[height=4cm]{7810f06a.eps} \includegrap...
...t=4cm]{7810f06e.eps} \includegraphics[height=4cm]{7810f06f.eps} }
\end{figure}](/articles/aa/full/2008/08/aa7810-07/Timg40.gif) |
Figure 6:
The polar ()
and azimuthal angle ()
distribution of
leading and trailing patterns in the LSC (RV 3000 km s-1) galaxies.
The symbols ``'' (solid circle) and `` '' (hollow circle) represent the observed
distribution of the leading and trailing patterns, respectively.
The statistical 1
error bars are shown.
The solid and dashed line represent the expected
distribution for leading and trailing type galaxies, respectively.
In the histogram, = 0
(90)
means the SV of galaxies tend to be oriented parallel
(perpendicular) with respect to the LSC. For azimuthal angle,
= 0
means the SV projections tend to
direct towards the LSC center (or Virgo cluster center). '' (hollow circle) represent the observed
distribution of the leading and trailing patterns, respectively.
The statistical 1
error bars are shown.
The solid and dashed line represent the expected
distribution for leading and trailing type galaxies, respectively.
In the histogram, = 0
(90)
means the SV of galaxies tend to be oriented parallel
(perpendicular) with respect to the LSC. For azimuthal angle,
= 0
means the SV projections tend to
direct towards the LSC center (or Virgo cluster center). |
| Open with DEXTER |
All three statistical tests suggest isotropy for both the leading
and trailing arm galaxies that have RVs in the range 3000 km s-1 to 5000 km s-1 in both the
and
-distributions (Table 3). No deviation from the expected
distribution can be seen (Figs. 7a, b). Spirals show a similar
result. Thus, a random spatial orientation is noticed for the
total and spiral galaxies.
![\begin{figure}
\par\mbox{\includegraphics[height=4cm]{7810f07a.eps} \includegrap...
...t=4cm]{7810f07e.eps} \includegraphics[height=4cm]{7810f07f.eps} }
\end{figure}](/articles/aa/full/2008/08/aa7810-07/Timg41.gif) |
Figure 7:
The polar ()
and azimuthal angle ()
distributions of
leading and trailing pattern in the nearby LSC
(3000 < RV (km s-1) 5000) galaxies.
Symbols as in Fig. 6. |
| Open with DEXTER |
The spiral barred galaxies show a preferred alignment in both the
leading and trailing structural modes. In the leading SB galaxies,
dips at 5
(>1.5)
and 15
(>1.5)
and humps at 55
(1.5)
and 65
(>1.5)
can be seen (Fig. 7e). Similarly, dips at
5
(>1.5)
and 15
(>1.5)
and humps
at 65
(2)
and 75
(>2)
can be
seen in the -distribution of trailing arm SB galaxies
(Fig. 7e). These humps and dips cause the SB subsamples to give
the
value 3.
Thus, the SVs of leading
and trailing arm SB galaxies tend to be oriented perpendicular the
LSC plane. In the -distribution, all three statistical tests
show anisotropy in both the leading and trailing arm SB galaxies.
A similar preferred alignment is noticed in these two structural
modes: SV projections tend to point towards the LSC center (or
Virgo cluster center).
All three statistical tests show isotropy in both the
and
-distributions of leading and trailing arm total galaxies.
No significant dips and humps are seen in Figs. 8a, b. Thus, a
random orientation of SVs of leading and trailing arm galaxies
that have RV 5000 km s-1 is noticed.
The leading and trailing arm spirals show no preferred alignment
in both the
and -distributions. The observed
distribution is found to be consistent with the expected
distribution (Figs. 8c, d). All statistical parameters advocate
isotropy. Thus, we conclude no preferred alignment in the leading
and trailing arm spirals.
![\begin{figure}
\par\mbox{\includegraphics[height=4.1cm]{7810f08a.eps} \includegr...
...m]{7810f08g.eps} \includegraphics[height=4.1cm]{7810f08h.eps} }
\end{figure}](/articles/aa/full/2008/08/aa7810-07/Timg42.gif) |
Figure 8:
The polar ()
and azimuthal angle ()
distributions of
leading and trailing pattern in the total (LSC + nearby LSC) galaxies.
Symbols as in Fig. 6. |
| Open with DEXTER |
In the polar angle distribution, a similar deviation can be seen
in the leading and trailing arm spiral barred galaxies (Fig. 8e).
All three statistical tests suggest anisotropy (Table 3). The
/
)
is negative (>2)
for both structural modes, suggesting a similar preferred
alignment: the SVs of galaxies tend to be oriented perpendicular
to the LSC plane. In the azimuthal angle distribution, the
chi-square probability (P
 )
is found to be greater than 5% significance level in both structural modes. The
auto-correlation coefficient suggests anisotropy (>2)
for the leading mode and isotropy for the trailing mode. The
Fourier probability (P(
)) is <5% for the leading
mode. In this mode, the
is found to be positive at
>3
level, indicating a preferred alignment. Thus, the SV
projections of leading arm SB galaxies tend to direct towards the
LSC center. A significant hump at 0
supports this result
(Fig. 8f).
)
is found to be greater than 5% significance level in both structural modes. The
auto-correlation coefficient suggests anisotropy (>2)
for the leading mode and isotropy for the trailing mode. The
Fourier probability (P(
)) is <5% for the leading
mode. In this mode, the
is found to be positive at
>3
level, indicating a preferred alignment. Thus, the SV
projections of leading arm SB galaxies tend to direct towards the
LSC center. A significant hump at 0
supports this result
(Fig. 8f).
No preferred alignment is noticed for morphologically unidentified
galaxies (subsample O3). All statistical parameters indicate
isotropy. However, the statistics is not rich (<100) in this
subsample.
Figure 9a shows a comparison between the % and the
/
)
value of leading and trailing
arm galaxies in the total sample and subsamples. This plot reveals
the correlation between the chirality (non-chirality) and the
random (preferred) alignment of galaxies in the total sample and
subsamples. The grey-shaded region represents the coexistence
between the chirality and the random orientation of galaxies.
In the -distribution,
/
)
values of the total samples (T1, T2 and T3) lie in the grey-shaded
region, suggesting no preferred alignment. In addition, the
% values for the total sample (T1, T2 and T3) are well
within the 5% error limit (grey-shaded region). Thus, a good
correlation between the random alignment and the chiral property
is found in the total leading and trailing arm galaxies.
![\begin{figure}
\par\includegraphics[height=5cm]{7810f09a.eps}
\includegraphics[height=5cm]{7810f09b.eps}
\end{figure}](/articles/aa/full/2008/08/aa7810-07/Timg44.gif) |
Figure 9:
A comparison between the chiral symmetry (%) and
the preferred alignment (
/
)) in
the polar ()
and azimuthal ()
angle distribution of
leading and trailing samples and subsamples. Error bars as in Fig. 4. |
| Open with DEXTER |
Two spiral subsamples, S2 and S3, show a similar trend to the
total sample. Interestingly, two SB subsamples, SB2 and SB3, show
an opposite trend to the total sample. The
/
)
and % values of
these subsamples (SB2, SB3) cannot be seen in the grey-shaded
region, suggesting a preferred alignment (Fig. 9a). Thus, a good
correlation between the preferred alignment and the achiral
(non-chiral) property is found in the SB subsamples. The
subsamples S1 and SB1 show different properties because of the
presence of Virgo cluster galaxies in the database (Aryal et al.
2007a).
In the -distribution, a good correlation between the
/
)
and % value is found
for SB2 and SB3 subsamples. The leading and trailing arm galaxies
of these subsamples show a preferred alignment in the spatial
orientation and the non-chiral property in the number statistics.
Thus, the coexistence of achirality and the preferred alignment of
SB galaxies cannot be denied. In the leading total subsamples (T1
and T3), a weak preference can be seen in the -distribution
(Fig. 9b). However, the trailing total subsamples (T1, T2 and T3)
show a random orientation of SV projections of galaxies. The
subsamples S2, S3 and O3 show a good correlation between the
random alignment and the chiral property (Fig. 9b).
Thus, our results in the
and -distributions lead us
to predict the coexistence of chiral property and the random
alignment of galaxies. This coexistence is found to be significant
in the spiral galaxies. This result indicates the fact that the
chiral property is a global phenomenon rather than a local
phenomenon. Interestingly, we noticed coexistence between the
preferred alignment and the achiral property in the spiral barred
galaxies. It seems that the chirality loss sequence (spiral
 barred spiral), as predicted by Capozziello &
Lattanzi (2006), might be true.
barred spiral), as predicted by Capozziello &
Lattanzi (2006), might be true.
Aryal et al. (2007a) found a random alignment of leading
and trailing arm LSC galaxies in the two dimensional analysis. We
found a similar result in the three dimensional analysis. Aryal et al. (2007a) concluded that the Hubble morphological
sequence is related to the degree of chirality of galaxies. Their
result hints that the late-type galaxies are chiral objects, while
early-type galaxies might be achiral. In this perspective, the
Hubble diagram probably represents a chirality-loss sequence.
Aryal & Saurer (2004, 2005b, 2006) and
Aryal et al. (2007b) studied the spatial orientation of galaxies
in 32 Abell clusters of BM type I (2004), BM type III (2005b), BM
type II-III (2006) and BM type II (2007) finding a significant
preferred alignment of angular momentum of the galaxies in the
late-type cluster (BM type II-III, BM type III). In addition, they
noticed that the randomness decreases systematically in galaxy
alignments from early-type (BM type I, II) to late-type (BM type II-III, III) clusters. Thus, the existence of chirality in BM type I cluster, as predicted by Capozziello & Lattanzi (2006)
might be true. We noticed a very good correlation between the
randomness and the chiral symmetry of galaxies. This result
indicates that the progressive loss of chirality might have some
connection with the rotationally-supported (spirals, barred
spirals) and randomized (lenticulars, ellipticals) system. Thus,
we suspect that the dynamical processes in the cluster evolution
(early-type
late-type) give rise to a dynamical
loss of chirality. In other words, existence of non-chirality and
non-randomness can be suspected for the late-type cluster
galaxies. It would be interesting to test this prediction by
analyzing the chiral property of spirals in the late-type clusters
in the future.
The ``Li model'' (Li 1998) predicts that the celestial bodies
acquire angular momentum during formation from the global rotation
of the Universe. Godlowski et al. (2003) derived a
relation between angular momentum and the mass of a galaxy using
the ``Li model'' (Li 1998) and tested this relation for Tully's
galaxy group (Godlowski et al. 2005). For that group, no
preferred alignment of SVs of galaxies is noticed. They conclude
that the minima of the relation between angular momenta and masses
of galaxy structures can be verified observationally. In this
study, we notice a vanishing angular momentum for the leading and
trailing arm galaxies in the LSC. In addition, our result for the
leading and trailing arm nearby LSC and total galaxies supports
this. This result is interesting in the sense that the chiral
property might coexist with the system (huge structures) of
vanishing angular momentum.
We studied the chiral symmetry and the spatial orientation of
2288 galaxies that have RV less than 5000 km s-1. These
galaxies include LSC (RV < 3000 km s-1) and nearby LSC
(3000 < RV (km s-1) 5000) galaxies. We assumed
random direction for the rotation of galaxies and classified
leading and trailing modes by observing the patterns (S- and
Z-shaped) of the arms in the spiral and barred spiral galaxies.
The distributions of structural modes are studied in the total
sample and 69 subsamples. To examine non-random effects, the
distribution of SV and SV projections of galaxies in the total
sample and 9 subsamples are studied. We compared our results
concerning chiral symmetry and the preferred spatial alignments of
the leading and trailing modes, and discussed them in the context
of Capozziello & Lattanzi's (2006) prediction. We
summarize our result as follows:
- 1.
- A good correlation between the random alignment and the
chiral symmetry of galaxies is found in the total leading and
trailing arm LSC (RV < 3000 km s-1), nearby LSC (3000 < RV (km s-1) 5000) and total (LSC + nearby LSC)
galaxies. Spiral galaxies show a similar results as shown by the
total sample: chiral symmetry and the random alignment.
- 2.
- A preferred alignment of angular momentum vectors of leading
and trailing arm SB galaxies is noticed. In addition, chiral
symmetry is found to be weak for barred spirals. Thus, we noticed
a good correlation between the preferred alignment and non-chiral
property in the leading and trailing arm SB galaxies. Our results
verify the prediction made by Capozziello & Lattanzi
(2006) concerning chirality loss sequence (spiral
barred spiral).
- 3.
- The random alignments of galaxies in BM type I cluster
(Aryal & Saurer 2004) lead us to suspect the existence of chiral
symmetry. This was predicted by Capozziello & Lattanzi
(2006). This result reveals that the progressive loss of
chirality might have some connection with the
rotationally-supported (spirals, barred spirals) and randomized
(lenticulars, ellipticals) systems. Thus, we suspect that the
dynamical processes in the cluster evolution give rise to a
dynamical loss of chirality. In other words, existence of
non-chirality and non-randomness can be suspected for the
late-type cluster galaxies.
- 4.
- Chiral symmetry is found to be strong in 52 subsamples (75%
subsamples). This result leads us to conclude the existence of
chiral symmetry between the leading and trailing modes in the LSC,
nearby LSC and the total (LSC + nearby LSC).
- 5.
- We found a vanishing angular momentum for the leading and
trailing arm galaxies in the LSC. In addition, our result for the
leading and trailing arm nearby LSC and total (LSC + nearby LSC)
galaxies support this. Thus, the chiral symmetry coexists with the
system of vanishing angular momentum. Thus, the coexistence
between the chiral symmetry and the random orientation of galaxies
might have originated from the fact that the celestial bodies
acquire angular momentum from the global rotation of the Universe
(Li 1998).
A wide discussion is needed regarding the relation between the
chirality-loss sequence and the preferred orientation of galaxies.
The result of this paper demands a series of work mainly in the
clusters. In addition, three dimensional determination of the
leading and the trailing arm patterns in the galaxies is a very
important problem. The true structural mode of a galaxy must
involve a determination of which side of the galaxy is closer to
the observer (Binney & Tremaine 1987). We intend to
determine the true structural modes of our galaxies in the future.
Acknowledgements
The authors wish to thank the referee for insightful comments
regarding the true structural modes of individual galaxies. This
research has made use of the NASA/IPAC Extragalactic Database
(NED), which is operated by the Jet Propulsion Laboratory,
California Institute of Technology, under contract with the
National Aeronautics and Space Administration. We acknowledge
Profs. Lok Narayan Jha, Udayraj Khanal and Mukunda Mani Aryal for
insightful discussions.
We adopt the method described by Flin & Godlowski (1986)
to calculate the polar ()
and azimuthal ()
angle of
galaxies. The polar angle ()
represents the angle between
the galactic SV and a reference plane. The angle between the
projection of a galactic SV on to this reference plane is the
azimuthal angle (). The reference plane is the LSC plane.
The formulae to obtain
and ,
as given in Flin &
Godlowski (1986), are as follows:
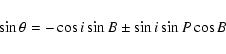 |
(1) |
![$\displaystyle \sin \phi = (\cos \theta)^{-1} [-\cos i\cos B \sin L+ \sin i
\mp \sin P\sin B\sin L \mp \cos P\cos L]$](/articles/aa/full/2008/08/aa7810-07/img47.gif) |
|
|
(2) |
where L, B and P are the supergalactic longitude, latitude
and position angle, respectively. The angle i is the inclination
angle, estimated with Holmberg's (1946) formula:
= [(b/a)2-q2]/(1-q2) where b/a is the
measured axial ratio and q is the intrinsic flatness of disk
galaxies. We adopt the supergalactic coordinate system as defined
by Tammann & Sandage (1976).
Aryal & Saurer (2000, 2001) studied the results
of random simulations for the expected isotropic distributions of
the polar and azimuthal angles of galaxy rotation axes. They found
that any selection criteria imposed on the data may cause severe
changes in the shapes of the expected isotropic distribution
curves. In order to remove the selection effects concerning
positions and inclination angles we use the method described by
Aryal & Saurer (2000, 2001). In their method,
the spatial distribution of galaxy rotation axes is assumed to be
isotropic. Then, due to projection effects, i is distributed


 ,
B can be distributed
,
B can be distributed 
 ,
the variables L and P can be distributed randomly, and Eqs. (1) and (2) are used to calculate the corresponding values of
and .
,
the variables L and P can be distributed randomly, and Eqs. (1) and (2) are used to calculate the corresponding values of
and .
To remove the selection effect concerning nearly face-on galaxies,
the inclination angle was randomly distributed sine in
the range 25
to 85
in the numerical simulation. The
isotropic distribution curves are based on calculations including 106 virtual galaxies.
The expected isotropic distribution curves of
and of our galaxies are shown in Fig. 5. In this figure, the dotted
lines are the expected isotropic distribution curves when there is
no selection on positions and inclination angles in the database.
The expected -distribution curve is found to hardly
deviate from the cosine curve. The deviation at small angles
(<15
)
in Fig. 5a is due to the selections on inclination
angles. The expected -distribution curve remarkably deviates
from the random distribution (Fig. 5b). This deviation is mainly
due to the inhomogenous distributions of L. The azimuthal angle
distribution changes with L even when the range of i and Bis full (Aryal & Saurer 2000).
We set the chi-square probability P() = 0.050 as the
critical value to discriminate isotropy from anisotropy (Godlowski
1993). We expect an auto correlation coefficient
C
 0 for an isotropic distribution.
The Fourier test is useful when the deviation from isotropy is
slowly varying with the angles (in our case, polar and azimuthal
angles).
A method of expanding a function by expressing it as an infinite
series of periodic functions (sine and cosine) is
called a Fourier series. Let N denote the total number of
solutions for galaxies in the sample, Nk the number of
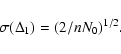
solutions in the  bin, N0 the mean number of
solutions per bin, and N0k the expected number of solutions
in the
bin. Then the Fourier series is given by (taking
first order Fourier mode),
bin, N0 the mean number of
solutions per bin, and N0k the expected number of solutions
in the
bin. Then the Fourier series is given by (taking
first order Fourier mode),
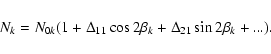 |
(3) |
Here the angle  k represents the polar angle in the
kth bin. The Fourier coefficients
and
k represents the polar angle in the
kth bin. The Fourier coefficients
and
 are the parameters of the distributions. We obtain
the following expressions for the Fourier coefficients
and
,
are the parameters of the distributions. We obtain
the following expressions for the Fourier coefficients
and
,
 |
(4) |
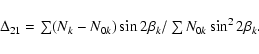 |
(5) |
The standard deviations ((
)) and
((
)) can be estimated using the expressions,
 |
(6) |
 |
(7) |
The probability that the amplitude
 |
(8) |
is greater than a certain chosen value is given by the formula
 |
(9) |
with standard deviation
 |
(10) |
The Fourier coefficient
gives the direction of
departure from isotropy. The first order Fourier probability
function P(>
 )
estimates whether (smaller value of
P(>
)
or not (higher value of P(>
)
a pronounced preferred orientation occurs in the sample.
)
estimates whether (smaller value of
P(>
)
or not (higher value of P(>
)
a pronounced preferred orientation occurs in the sample.
- Abell, G. O., Corwin, H.
G., & Olowin, R. P. 1989, ApJS, 70, 1 [NASA ADS] [CrossRef]
(In the text)
- Aryal, B., &
Saurer, W. 2000, A&A, 364, L97 [NASA ADS] (AS)
(In the text)
- Aryal, B., &
Saurer, W. 2001, in Galaxy Disk and Disk Galaxies, ed. J. S. Funes,
& E. M. Corsini, ASP Conf. Ser., 230, 145
(In the text)
- Aryal, B., &
Saurer, W. 2004, A&A, 425, 871 [NASA ADS] [CrossRef] [EDP Sciences]
(In the text)
- Aryal, B., &
Saurer, W. 2005a, A&A, 432, 841 [NASA ADS] [CrossRef] [EDP Sciences]
(In the text)
- Aryal, B., &
Saurer, W. 2005b, A&A, 432, 431 [NASA ADS] [CrossRef] [EDP Sciences]
(In the text)
- Aryal, B., &
Saurer, W. 2006, MNRAS, 366, 438 [NASA ADS] [CrossRef]
(In the text)
- Aryal, B., Acharya, S.,
& Saurer, W. 2007a, Ap&SS, 307, 4 [CrossRef], 369
(In the text)
- Aryal, B., Paudel, S.,
& Saurer, W. 2007b, MNRAS, 379, 1011 [NASA ADS] [CrossRef]
- Bagchi, M., Ray, S.,
Dey, M., & Dey, J. 2006, A&A, 450, 431 [NASA ADS] [CrossRef] [EDP Sciences]
(In the text)
- Binney, J., &
Tremaine, S. 1987, in Galactic Dynamics (Princeton New Jersey:
Princeton Univ. Press)
(In the text)
- Brunzendorf, J., &
Meusinger, H. 1999, A&ASS, 139, 141 [NASA ADS] [CrossRef]
(In the text)
- Capozziello, S., &
Lattanzi, A. 2006, Ap&SS, 301, 189 [NASA ADS] [CrossRef]
(In the text)
- Chang, L., et al. 2007,
Phy. Rev. C, 75, 015201 [NASA ADS] [CrossRef]
(In the text)
- Corwin, H. G., de
Vaucouleurs, A., & de Vaucouleurs, G. 1985, in Univ. Texas
Monogr. Astron., 4, 1
(In the text)
- de Vaucouleurs, G., de
Vaucouleurs, A., Corwin, et al. 1991, Third Reference Catalogue of
Bright Galaxies (New York: Springer-Verlag)
(In the text)
- Fall, S. M. 1992, in
Progress in Cosmology, Proc. of the Oxford Intl. Symp. (Oxford,
Dordrecht: D. Reidel Publishing Co.), 347
(In the text)
- Flin, P., &
Godlowski, W. 1986, MNRAS, 222, 525 [NASA ADS]
(In the text)
- Garcia-Garcia, A. M.,
& Cuevas, E. 2006, Phy. Rev. B., 74, 113101 [NASA ADS] [CrossRef]
(In the text)
- Godlowski, W. 1993
MNRAS, 265, 874
(In the text)
- Godlowski, W.,
Szydlowski, M., Flin, P., & Biernacka, M. 2003, J. General
Relativity & Gravitation, 35, 907 [NASA ADS] [CrossRef]
(In the text)
- Godlowski, W.,
Szydlowski, M., & Flin, P. 2005, J. General Relativity &
Gravitation, 37, 615 [NASA ADS] [CrossRef]
(In the text)
- Haynes, M., &
Giovanelli, R. 1984, AJ, 89, 6 [CrossRef], 758
(In the text)
- Holmberg, E. 1946,
Medd. Lund. Astron. Obs., Ser VI, No. 117
(In the text)
- Kodaira, K., Okamura,
S., & Ichikawa, S. 1990, Photometric Atlas of Northern Bright
Galaxies (Tokyo: Univ. of Tokyo Press) (PANBG)
(In the text)
- Lauberts, A. 1982,
ESO/Uppsala Survey of the ESO B Atlas, ESO (Garching bei
Muenchen)
(In the text)
- Li-Xin, Li. 1998, J. General
Relativity & Gravitation, 30, 497 [NASA ADS] [CrossRef]
(In the text)
- Liddle, A. R., &
Lyth, D. H. 2000, Cosmological Inflation and Large-Scale Structure
(Cambridge: Cambridge Univ. Press)
(In the text)
- Nilson, P. 1973,
Uppsala General Catalogue of Galaxies, Nova Acta Uppsala
University, Ser. V:A, Vol. 1 (UGC)
(In the text)
- Nilson, P. 1974,
Upps. Astron. Obs. Rep., 5 (UGCA)
(In the text)
- Oort, J. H. 1970a,
Science, 170, 1363 [NASA ADS] [CrossRef]
(In the text)
- Oort, J. H. 1970b,
A&A, 7, 405 [NASA ADS]
(In the text)
- Olling, R. P., &
Merrifield, M. R. 2000, MNRAS, 311, 361 [NASA ADS] [CrossRef]
(In the text)
- Ostriker, J. P.,
Peebles, P. J. E., & Yahil, A. 1974, ApJ, 193, L1 [NASA ADS] [CrossRef]
(In the text)
- Pasha, I. I. 1985, Sov.
Astron. Lett., 11, 1 [NASA ADS]
(In the text)
- Peacock, J. A. 1999,
in Cosmological Physics (Cambridge: Cambridge Univ. Press)
(In the text)
- Shectman, S. A.,
Landy, S. D., Oemler, A., et al. 1996, AJ, 470, 172 [NASA ADS] [CrossRef]
(In the text)
- Struble, M.F., &
Rodd, H. J. 1999, ApJS, 125, 355 [CrossRef]
(In the text)
- Sugai, H., & Iye, M.
1995 MNRAS, 276, 327
(In the text)
- Tammann, G. A., &
Sandage, A. 1976, ApJ, 207, L1 [NASA ADS] [CrossRef]
(In the text)
- Thomasson, M., Donner,
K. J., Sundelius, B., et al. 1989, A&A, 211, 25 [NASA ADS]
(In the text)
Copyright ESO 2008
![\begin{figure}
\par\includegraphics[height=9.5cm]{7810fig1.eps}
\end{figure}](/articles/aa/full/2008/08/aa7810-07/img23.gif)
![\begin{figure}
\par\includegraphics[height=4.2cm]{7810f02a.eps} \includegraphics...
...3.85cm]{7810f02b.eps} \includegraphics[height=4.1cm]{7810f02c.eps}
\end{figure}](/articles/aa/full/2008/08/aa7810-07/img24.gif)
![\begin{figure}
\par\mbox{\includegraphics[height=4.1cm]{7810f03a.eps} \includegr...
...1cm]{7810f03g.eps} \includegraphics[height=4.1cm]{7810f03h.eps} }
\end{figure}](/articles/aa/full/2008/08/aa7810-07/img25.gif)
![\begin{figure}
\par\mbox{\includegraphics[height=4cm]{7810f06a.eps} \includegrap...
...t=4cm]{7810f06e.eps} \includegraphics[height=4cm]{7810f06f.eps} }
\end{figure}](/articles/aa/full/2008/08/aa7810-07/img40.gif)
![\begin{figure}
\par\mbox{\includegraphics[height=4cm]{7810f07a.eps} \includegrap...
...t=4cm]{7810f07e.eps} \includegraphics[height=4cm]{7810f07f.eps} }
\end{figure}](/articles/aa/full/2008/08/aa7810-07/img41.gif)
![\begin{figure}
\par\mbox{\includegraphics[height=4.1cm]{7810f08a.eps} \includegr...
...m]{7810f08g.eps} \includegraphics[height=4.1cm]{7810f08h.eps} }
\end{figure}](/articles/aa/full/2008/08/aa7810-07/img42.gif)
![\begin{figure}
\par\includegraphics[height=5cm]{7810f09a.eps}
\includegraphics[height=5cm]{7810f09b.eps}
\end{figure}](/articles/aa/full/2008/08/aa7810-07/img44.gif)