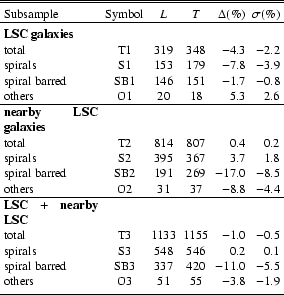
Table 1:
Statistics of leading (Col. 3) and trailing (Col. 4) patterns in the
LSC, nearby LSC and total (LSC + nearby LSC) galaxies. The fifth column gives the percentage
difference ( = (T-L)/(T+L) 100) between the trailing (T) and the leading (L) structural modes.
The last column gives the error: (%) = (
-)/(
+ ) 100.
The sample/subsample and their abbreviations are given in the first two columns.