A&A 475, 1159-1183 (2007)
DOI: 10.1051/0004-6361:20077638
J. Debosscher1 - L. M. Sarro3,7 - C. Aerts1,2 - J. Cuypers4 - B. Vandenbussche1 - R. Garrido5 - E. Solano6,7
1 - Instituut voor Sterrenkunde, KU Leuven, Celestijnenlaan 200B, 3001 Leuven, Belgium
2 -
Department of Astrophysics, Radbout University Nijmegen, PO Box 9010, 6500 GL Nijmegen, The Netherlands
3 -
Dpt. de Inteligencia Artificial , UNED, Juan del Rosal, 16, 28040 Madrid, Spain
4 -
Royal Observatory of Belgium, Ringlaan 3, 1180 Brussel, Belgium
5 -
Instituto de Astrofísica de Andalucía-CSIC, Apdo 3004, 18080 Granada, Spain
6 -
Laboratorio de Astrofísica Espacial y Física Fundamental, INSA, Apartado de Correos 50727, 28080 Madrid, Spain
7 -
Spanish Virtual Observatory, INTA, Apartado de Correos 50727, 28080 Madrid, Spain
Received 13 April 2007 / Accepted 7 August 2007
Abstract
Context. The fast classification of new variable stars is an important step in making them available for further research. Selection of science targets from large databases is much more efficient if they have been classified first. Defining the classes in terms of physical parameters is also important to get an unbiased statistical view on the variability mechanisms and the borders of instability strips.
Aims. Our goal is twofold: provide an overview of the stellar variability classes that are presently known, in terms of some relevant stellar parameters; use the class descriptions obtained as the basis for an automated ``supervised classification'' of large databases. Such automated classification will compare and assign new objects to a set of pre-defined variability training classes.
Methods. For every variability class, a literature search was performed to find as many well-known member stars as possible, or a considerable subset if too many were present. Next, we searched on-line and private databases for their light curves in the visible band and performed period analysis and harmonic fitting. The derived light curve parameters are used to describe the classes and define the training classifiers.
Results. We compared the performance of different classifiers in terms of percentage of correct identification, of confusion among classes and of computation time. We describe how well the classes can be separated using the proposed set of parameters and how future improvements can be made, based on new large databases such as the light curves to be assembled by the CoRoT and Kepler space missions.
Conclusions. The derived classifiers' performances are so good in terms of success rate and computational speed that we will evaluate them in practice from the application of our methodology to a large subset of variable stars in the OGLE database and from comparison of the results with published OGLE variable star classifications based on human intervention. These results will be published in a subsequent paper.
Key words: stars: variables: general - stars: binaries: general - techniques: photometric - methods: statistical - methods: data analysis
The current rapid progress in astronomical instrumentation provides us with a torrent of new data. For example, the large scale photometric monitoring of stars with ground-based automated telescopes and space telescopes delivers us large numbers of high quality light curves. The HIPPARCOS space mission is an example of this and led to a large number of new variable stars discovered in the huge set of light curves. In the near future, new space missions will deliver even larger numbers of light curves of much higher quality (in terms of sampling and photometric precision). The CoRoT mission (Convection Rotation and planetary Transits, launched on 27 December 2006) has two main scientific goals: asteroseismology and the search for exoplanets using the transit method. The latter purpose requires the photometric monitoring of a large number of stars with high precision. As a consequence, this mission will produce excellent time resolved light curves for up to 60 000 stars with a sampling rate better than 10 min during 5 months. Even higher numbers of stars (>100 000) will be measured for similar purposes and with comparable sampling rate by NASA's Kepler mission (launch end 2008, duration 4 years). The ESA Gaia mission (launch foreseen in 2011) will map our Galaxy in three dimensions. About one billion stars will be monitored for this purpose, with about 80 measurements over 5 years for each star.
Among these large samples, many new variable stars of known and unknown type will be present. Extracting them, and making their characteristics and data available to the scientific community within a reasonable timescale, will make these catalogues really useful. It is clear that automated methods have to be used here. Mining techniques for large databases are more and more frequently used in astronomy. Although we are far from reproducing capabilities of the human brain, a lot of work can be done efficiently using intelligent computer codes.
In this paper, we present automated supervised classification methods for variable stars. Special attention is paid to computational speed and robustness, with the intention to apply the methods to the huge datasets expected to come from the CoRoT, Kepler and Gaia satellite missions. We tackle this problem with two parallel strategies. In the first, we construct a Gaussian mixture model. Here, the main goals are to optimize speed, simplicity and interpretability of the model rather than optimizing the classifiers' performance. In the second approach, a battery of state-of-the-art pattern recognition techniques is applied to the same training set in order to select the best performing algorithm by minimizing the misclassification rate. The latter methods are more sophisticated and will be discussed in more detail in a subsequent paper (Sarro et al., in preparation).
For a supervised classification scheme, we need to predefine the classes. Every new object in a database to be classified will then be assigned to one of those classes (called definition or training classes) with a certain probability. The construction of the definition classes for stellar variability is, therefore, an important part of this paper. Not only are these classes necessary for this type of classification method, they also provide us with physical parameters describing the different variability types. They allow us to attain a good view on the separation and overlap of the classes in parameter space. For every variability class, we derive descriptive parameters using the light curves of their known member stars. We use exclusively light curve information for the basic methodology we present here, because additional information is not always available and we want to see how well the classes can be described (and separated) using only this minimal amount of information. This way, the method is broadly applicable. It is easy to adapt the methods when more information such as colors, radial velocities, etc. is available.
The first part of this paper is devoted to the description of the stellar variability classes and the parameter derivation. The classes are visualized in parameter space. In the second part, a supervised classifier based on multivariate statistics is presented in detail. We also summarize the results of a detailed statistical study on Machine Learning methods such as Bayesian Neural Networks. Our variability classes are used to train the classifiers and the performance is discussed. In a subsequent paper, the methods will be applied to a large selection of OGLE (Optical Gravitational Lensing Experiment) light curves, while we plan to update the training classes from the CoRoT exoplanet light curves in the coming two years.
We provide an astrophysical description of the stellar variability classes by means of a fixed set of parameters. These parameters are derived using the light curves of known member stars. An extensive literature search provided us with the object identifiers of well-known class members. We retrieved their available light curves from different sources. The main sources are the HIPPARCOS space data (Perryman & ESA 1997; ESA 1997) and the Geneva and OGLE ground-based data (Soszynski et al. 2002; Udalski et al. 1999a; Wyrzykowski et al. 2004). Other sources include ULTRACAM data (ULTRA-fast, triple-beam CCD CAMera), see Dhillon & Marsh (2001), MOST data (Microvariability and Oscillations of STars, see http://www.astro.ubc.ca/MOST/), WET data (Whole Earth Telescope, see http://wet.physics.iastate.edu/), ROTOR data (Grankin et al. 2007), Lapoune/CFHT data (Fontaine, private communication), and ESO-LTPV data (European Southern Observatory Long-Term Photometry of Variables project), see Sterken et al. (1995). Table 1 lists the number of light curves used from each instrument, together with their average total time span and their average number of measurements. For every considered class (see Table 2), we have tried to find the best available light curves, allowing recovery of the class' typical variability. Moreover, in order to be consistent in our description of the classes, we tried, as much as possible, to use light curves in the visible band (V-mag). This was not possible for all the classes however, due to a lack of light curves in the V-band, or an inadequate temporal sampling of the available V-band light curves. The temporal sampling (total time span and size of the time steps) is of primordial importance when seeking a reliable description of the variability present in the light curves. While HIPPARCOS light curves, for example, are adequate in describing the long term variability of Mira stars, they do not allow recovery of the rapid photometric variations seen in some classes such as rapidly oscillating Ap stars. We used WET or ULTRACAM data in this case, dedicated to this type of object. For the double-mode Cepheids, the RR-Lyrae stars of type RRd and the eclipsing binary classes, we used OGLE light curves, since they both have an adequate total time span and a better sampling than the HIPPARCOS light curves.
Table 1:
The sources and numbers of light curves NLC used to define the classes, their average total time span
![]() and their average number of measurements
and their average number of measurements
![]() .
.
For every definition class, mean parameter values and variances are calculated. Every variability class thus corresponds to a region in a multi-dimensional parameter space. We investigate how well the classes are separated with our description and point out where additional information is needed to make a clear distinction. Classes showing a large overlap will have a high probability of resulting in misclassifications when using them in the training set.
The classes considered are listed in Table 2, together with the code
we assigned to them and the number of light curves we used to define the class. We
use this coding further in this paper, and in the reference list, to indicate
which reference relates to which variability type. For completeness, we also
list the ranges for
![]() ,
,
![]() ,
and the range for the dominant frequencies and their amplitudes present in the light curves. The first two physical parameters cannot be measured directly, but are calculated from modeling. We do not use
these parameters for classification purposes here because they are in general
not available for newly measured stars. Also, for some classes, such as those
with non-periodic variability or outbursts, it is not possible to define a
reliable range for these parameters. The ranges for the light curve parameters result from our analysis, as described in Sect. 2.1.
,
and the range for the dominant frequencies and their amplitudes present in the light curves. The first two physical parameters cannot be measured directly, but are calculated from modeling. We do not use
these parameters for classification purposes here because they are in general
not available for newly measured stars. Also, for some classes, such as those
with non-periodic variability or outbursts, it is not possible to define a
reliable range for these parameters. The ranges for the light curve parameters result from our analysis, as described in Sect. 2.1.
We stress that the classes considered in Table 2 constitute the vast
majority of known stellar variability classes, but certainly not all of them. In
particular, we considered only those classes whose members show clear and
well-understood visual photometric variability. Several additional classes exist
which were defined dominantly on the basis of spectroscopic diagnostics or
photometry at wavelengths outside the visible range. For some classes, we were
unable to find good consistent light curves. Examples of omitted classes are
hydrogen-deficient carbon stars, extreme helium stars, ![]() or X-ray
bursts, pulsars, etc. Given that we do not use diagnostics besides light curves at or around visible wavelengths in our methods presently, these classes are not considered
here. In the following we describe our methods in detail. A summary of the different steps is shown in Fig. 1.
or X-ray
bursts, pulsars, etc. Given that we do not use diagnostics besides light curves at or around visible wavelengths in our methods presently, these classes are not considered
here. In the following we describe our methods in detail. A summary of the different steps is shown in Fig. 1.
![\begin{figure}
\par\includegraphics[angle=360,width=7cm,clip]{7638f1.eps} \end{figure}](/articles/aa/full/2007/45/aa7638-07/img16.gif) |
Figure 1: Schematic overview of the different steps (sections indicated) in the development and comparison of the classification methods presented in this paper. |
| Open with DEXTER | |
Table 2:
Stellar variability classes considered in this study, their code, the
number of light curves we used (NLC) and their source. Also listed (when relevant for
the class) are the ranges for the parameters
![]() and
and ![]() if they
could be determined from the literature. The last two columns list the range for the dominant frequencies (f1) and their amplitudes (A11) present in the light curves, resulting from our analysis (Sect. 2.1).
if they
could be determined from the literature. The last two columns list the range for the dominant frequencies (f1) and their amplitudes (A11) present in the light curves, resulting from our analysis (Sect. 2.1).
After removal of bad quality measurements, the photometric time series of the definition stars were subjected to analysis. First, we checked for possible linear trends of the form a+bT, with a the intercept, b the slope and Tthe time. These were subtracted, as they can have a large influence on the frequency spectrum. The larger the trend is for pulsating stars, the more the frequency values we find can deviate from the stars' real pulsation frequencies.
Subsequently, we performed a Fourier analysis to find periodicities in the light
curves. We used the well-known Lomb-Scargle method
(Scargle 1982; Lomb 1976). The computer code to calculate the periodograms
was based on an algorithm written by J. Cuypers. It followed outlines given by Ponman (1981) and Kurtz (1985) focussed on speedy
calculations. As is the case with all frequency determination methods, we
needed to specify a search range for frequencies (f0, fN and ![]() ). Since we were dealing with data coming from different instruments, it was
inappropriate to use the same search range for all the light curves. We adapted
it to each light curve's sampling, and took the starting frequency as
). Since we were dealing with data coming from different instruments, it was
inappropriate to use the same search range for all the light curves. We adapted
it to each light curve's sampling, and took the starting frequency as
![]() ,
with
,
with
![]() the total time span of the observations. A
frequency step
the total time span of the observations. A
frequency step
![]() was taken. For the highest frequency, we
used the average of the inverse time intervals between the measurements:
was taken. For the highest frequency, we
used the average of the inverse time intervals between the measurements:
![]() as a pseudo Nyquist frequency. Note that fN is equal to
the Nyquist frequency in the case of equidistant sampling. For particular
cases, an even higher upper limit can be used (see Eyer & Bartholdi 1999). Our
upper limit should be seen as a compromise between the required resolution to
allow a good fitting, and computation time.
as a pseudo Nyquist frequency. Note that fN is equal to
the Nyquist frequency in the case of equidistant sampling. For particular
cases, an even higher upper limit can be used (see Eyer & Bartholdi 1999). Our
upper limit should be seen as a compromise between the required resolution to
allow a good fitting, and computation time.
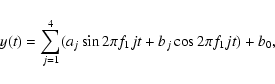
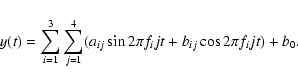
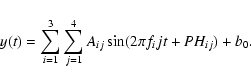
We searched for up to a maximum of three independent frequencies for every
star. The procedure was as follows: the Lomb-Scargle periodogram was calculated
and the highest peak was selected. The corresponding frequency value f1 was
then used to calculate a harmonic fit to the light curve of the form:
 |
(1) |
 |
(2) |
| (3) | |||
| (4) |
 |
(5) |
 |
(6) |
| (7) |
Another important parameter, which is also calculated during the fitting procedure, is the ratio of the variances vf1/v in the light curve, after and before subtraction of a harmonic fit with only the frequency f1. This parameter is very useful for discriminating between multi- and monoperiodic pulsators. Its value is much smaller for monoperiodic pulsators, where most of the variance in the light curve can be explained with a harmonic fit with only f1.
In total, we calculated 28 parameters starting from the original time series: the slope b of the linear trend, 3 frequencies, 12 amplitudes, 11 phases (PH11 is always zero and can be dropped) and 1 variance ratio. This way, the original time series, which can vary in length and number of measurements, were transformed into an equal number of descriptive parameters for every star.
We calculated the same parameter set for each star, irrespective of the variability class they belong to. This set provided us with an overall good description of the light curves for pulsating stars, and even did well for eclipsing binaries. It is clear, however, that the whole parameter set might not be needed for distinguishing, say, between class A and class B. The distinction between a Classical Cepheid and a Mira star is easily made with only the parameters f1 and A11, other parameters are thus not necessary and might even be completely irrelevant for this example. For other classes, we have to use more parameters to reach a clear distinction.
With these 28 selected parameters, we found a good compromise between maximum separability of all the classes and a minimum number of descriptive parameters. Our class definitions are based on the entire parameter set described above. A more detailed study on statistical attribute selection methods is presented in Sect. 3.2.1, as this is closely related to the performance of a classifier.
The different variability classes can now be represented as sets of points in multi-dimensional parameter space. Each point in every set corresponds to the light curve parameters of one of the class' member stars. The more the clouds are separated from each other, the better the classes are defined, and the fewer the misclassifications which will occur in the case of a supervised classification, using these class definitions. As an external check for the quality of our class definitions, we performed a visual inspection of phase plots made with only f1, for the complete set. If these were of dubious quality (or the wrong variability type), the objects were deleted from the class definition. It turned out to be very important to retain only definition stars with high-quality light curves. This quality is much more important than the number of stars to define the class, provided that enough stars are available for a good sampling of the class' typical parameter ranges. Visualizing the classes in multi-dimensional space is difficult. Therefore we plot only one parameter at a time for every class. Figures 2, 5, 6-10 show the spread of the derived light curve parameters for all the classes considered. Because the range can be quite large for frequencies and amplitudes, we have plotted the logarithm of the values (base 10 for the frequencies and base 2 for the amplitudes). As can be seen from Fig. 2, using only f1 and A11, we already attain a good distinction between monoperiodically pulsating stars such as Miras, RR-Lyrae and Cepheids. For the multiperiodic pulsators, a lot of overlap is present and more parameters (f2, f3, the A2j and the A3j) are needed to distinguish between those classes. If we look at the frequencies and amplitudes, we see that clustering is less apparent for the non-periodic variables such as Wolf-Rayet stars, T-Tauri stars and Herbig Ae/Be stars. For some of those classes, we only have a small number of light curves, i.e. we do not have a good "sampling'' of the distribution (selection effect). The main reason for their broad distribution is, however, the frequency spectrum: for the non-periodic variables, the periodogram will show a lot of peaks over a large frequency range, and selecting three of them is not adequate for describing the light curve. Selecting more than three, however, entails the danger of picking non-significant peaks. The phase values PH1i corresponding to the harmonics of f1 cluster especially well for the eclipsing binary classes, as can be expected from the nature of their light curves. These parameters are valuable for separating eclipsing binaries from other variables. The phase values for the harmonics of f2 and f3 do not show significant clustering structure. On the contrary, they tend to be rather uniformly distributed for every class and thus, they will likely not constitute very informative attributes for classification. This is not surprising, since these phases belong to less significant signal components and will vary more randomly for the majority of the stars in our training set. In the next section, we discuss more precise methods for assessing the separation and overlap of the classes in parameter space.
Complementary to these plots, we have conducted a more detailed analysis of the statistical properties of the training set. This analysis is of importance for a sensible interpretation of the class assignments obtained for unknown objects, since the class boundaries of the classifiers depend critically on the densities of examples of each class as functions of the classification parameters. This analysis comprises i) the computation of box-and-whiskers plots for all the attributes used in classification (see Figs. 3, 11, and 12 for example); ii) the search for correlations between the different parameters; iii) the computation of 1d, 2d and 3d nonparametric density estimates (see Fig. 4 for an easily interpretable hexagonal histogram); iv) clustering analysis of each class separately and for the complete training set. The results of this analysis are especially useful for guiding the extension of the training set as new examples become available to users, such as those from CoRoT and Gaia.
![\begin{figure}
\par\includegraphics[angle=180,width=14.5cm,clip]{7638f2.ps} \end{figure}](/articles/aa/full/2007/45/aa7638-07/img37.gif) |
Figure 2: The range for the frequency f1 (in cycles/day), its first harmonic amplitude A11 (in magnitude), the phases PH12 (in radians) and the variance ratio vf1/v (varrat) for all the 35 considered variability classes listed in Table 1. For visibility reasons, we have plotted the logarithm of the frequency and amplitude values. Every symbol in the plots corresponds to the parameter value of exactly one light curve. In this way, we attempt to visualize the distribution of the light curve parameters, in addition to their mere range. |
| Open with DEXTER | |
![\begin{figure}
\par\includegraphics[angle=-90,width=14.2cm,clip]{7638f3.eps} \end{figure}](/articles/aa/full/2007/45/aa7638-07/img38.gif) |
Figure 3: Box-and-whiskers plot of the logarithm of f1 for 29 classes with sufficient members to define such tools in the training set. Central boxes represent the median and interquantile ranges (25 to 75%) and the outer whiskers represent rule-of-thumb boundaries for the definition of outliers (1.5 the quartile range). The box widths are proportional to the number of examples in the class. |
| Open with DEXTER | |
![\begin{figure}
\includegraphics[origin=rb,angle=-90,width=12cm,clip]{7638f4.eps} \end{figure}](/articles/aa/full/2007/45/aa7638-07/img41.gif) |
Figure 4:
Hexagonal representation of the two dimensional density of examples
of the Classical Cepheids class in the |
| Open with DEXTER | |
![\begin{figure}
\par\includegraphics[width=15cm,angle=180,scale=0.94,clip]{7638f5.ps} \end{figure}](/articles/aa/full/2007/45/aa7638-07/img42.gif) |
Figure 5: The range in amplitudes A1j for the 3 higher harmonics of f1, and the linear trend b. For visibility reasons, we have plotted the logarithm of the amplitude values. |
| Open with DEXTER | |
![\begin{figure}
\par\includegraphics[width=15cm,angle=180,scale=0.94,clip]{7638f6.ps} \end{figure}](/articles/aa/full/2007/45/aa7638-07/img43.gif) |
Figure 6:
The range for the frequencies f2 and f3 and the phases PH1j of the higher harmonics of f1. For visibility reasons, we have plotted the logarithm of the frequency values. Note the split into two clouds of the phase values PH13 for the eclipsing binary classes. This is a computational artefact: phase values close to |
| Open with DEXTER | |
![\begin{figure}
\par\includegraphics[width=15cm,angle=180,scale=0.94,clip]{7638f7.ps} \end{figure}](/articles/aa/full/2007/45/aa7638-07/img44.gif) |
Figure 7: The range in amplitudes A2j for the 4 harmonics of f2. For visibility reasons, we have plotted the logarithm of the amplitude values. |
| Open with DEXTER | |
![\begin{figure}
\par\includegraphics[width=15cm,angle=180,scale=0.94,clip]{7638f8.ps} \end{figure}](/articles/aa/full/2007/45/aa7638-07/img45.gif) |
Figure 8: The range in amplitudes A3j for the 4 harmonics of f3. For visibility reasons, we have plotted the logarithm of the amplitude values. |
| Open with DEXTER | |
![\begin{figure}
\par\includegraphics[width=15cm,angle=180,scale=0.94,clip]{7638f9.ps} \end{figure}](/articles/aa/full/2007/45/aa7638-07/img46.gif) |
Figure 9: The range in phases PH2j for the 4 harmonics of f2. As can be seen from the plots, the distribution of these parameters is rather uniform for every class. They are unlikely to be good classification parameters, since for none of the classes, clear clustering of the phase values is present. |
| Open with DEXTER | |
![\begin{figure}
\par\includegraphics[width=15cm,angle=180,scale=0.94,clip]{7638f10.ps} \end{figure}](/articles/aa/full/2007/45/aa7638-07/img47.gif) |
Figure 10: The range in phases PH3j for the 4 harmonics of f3. The same comments as for Fig. 9 apply here. |
| Open with DEXTER | |
The class descriptions we attained, form the basis of the so-called "Supervised Classification''. This classification method assigns every new object to one of a set of pre-defined classes (called "training classes''), meaning that, given the time series characteristics described above, the system gives a set of probabilities that the source of the time series belongs to one of the set of classes listed in Table 1.
![\begin{figure}
\par\includegraphics[angle=-90,width=13.8cm,clip]{7638f11.eps} \end{figure}](/articles/aa/full/2007/45/aa7638-07/img48.gif) |
Figure 11: Box-and-whiskers plot of the logarithm of R21 for all classes in the training set. Central boxes represent the median and interquantile ranges (25 to 75%) and the outer whiskers represent rule-of-thumb boundaries for the definition of outliers (1.5 the quartile range). The boxes widths are proportional to the number of examples in the class. |
| Open with DEXTER | |
![\begin{figure}
\par\includegraphics[angle=-90,width=13.8cm,clip]{7638f12.eps} \end{figure}](/articles/aa/full/2007/45/aa7638-07/img49.gif) |
Figure 12: Box-and-whiskers plot of the logarithm of the variance ratio vf1/v (varrat) for all classes in the training set. Central boxes represent the median and interquantile ranges (25 to 75%) and the outer whiskers represent rule-of-thumb boundaries for the definition of outliers (1.5 the quartile range). The boxes widths are proportional to the number of examples in the class. |
| Open with DEXTER | |
A supervised classification can be done in many ways. The most suitable method depends on the kind of data to be classified, the required performance and the available computational power. We focus here on a statistical method based on multivariate analysis, also known as the "Gaussian Mixture Model''. We have chosen for a fast and easily adaptable code written in FORTRAN. We also summarize the results of a detailed study of other supervised classification methods, based on Artificial Intelligence techniques.
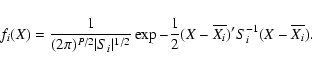
We assume that the descriptive parameters for every class have a multinormal
distribution. This is a reasonable assumption for a first approach. There is no
reason to assume a more complicated distribution function, unless there is clear evidence. The added advantages of the multinormal distribution are the well-known properties and the relatively simple calculations. We use our derived
light curve parameters to estimate the mean and the variance of the multinormal
distributions. If the vector Xij represents the parameters of light curve
number j belonging to class i, the following quantities are calculated for
every variability class. The class mean vector of length P (number of light
curve parameters, P=28 in our method for example):
 |
(8) |
 |
(9) |
If we want to classify a new object, we first have to calculate the same light
curve parameters as described in Sect. 2. We can then derive the statistical
distance of this object with respect to the different classes, and assign the
object to the nearest (most probable) class. If X denotes the parameters for
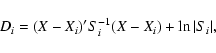
the new object, we calculate the following statistical distance for every class:
 |
(11) |
We emphasize the difference between a supervised classification method as defined here and an extraction method: a supervised classifier assigns new objects to one of a set of definition classes with a certain probability, given the object's derived parameters. An extractor, on the other hand, will only select those objects in the database for which the derived parameters fall within a certain range. Extractor methods are typically used by scientists only interested in one class of objects. The specified parameter range for an extractor (based on the knowledge of the variability type) can be chosen as to minimize the number of contaminating objects, to make sure that the majority of the selected objects will indeed be of the correct type. Of course, extraction methods can also be applied to our derived parameter set. The goal of our supervised classifier is much broader, however: we consider all the known variability classes at once and also get a better view on the differences and similarities between the classes. Moreover, our method does not need visual inspection of the light curves, while this was always needed in practice with extraction. On top of this, our class definitions can also be used to specify parameter ranges for extraction methods.
Following standard practice in the field of pattern recognition or statistical learning, we have adopted a parallel approach where we allow for more flexibility in the definition of the models used to classify the data. The Gaussian mixtures model presented in the previous section induces hyperquadratic boundaries between classes (with hyperspheres/hyperellipses as special cases). This has the advantage of providing a fast method for the detection of outliers (objects at large Mahalanobis distances from all centers) and easy interpretation of results. On the other hand, more sophisticated methods offer the flexibility to reproduce more complicated boundaries between classes, at the expense of more complex models with varying degrees of interpretability.
A common problem presented in the development of supervised
classification applications based on statistical learning methods, is
the search for the optimal trade-off between the two components of the
classifier error. In general, this error is composed of two
elements: the bias and the variance. The former is due to the
inability of our models to reproduce the real decision boundaries
between classes. To illustrate this kind of error, we can imagine a
set of training examples such that any point above the ![]() curve belongs to class A and any point below it, to class B. Here,
classes A and B are separable (unless we add noise to the class
assignment), and the decision boundary is precisely the curve
curve belongs to class A and any point below it, to class B. Here,
classes A and B are separable (unless we add noise to the class
assignment), and the decision boundary is precisely the curve
![]() .
Obviously, if we try to solve this toy classification
problem with a classifier inducing linear boundaries we will
inevitably have a large bias component to the total error. The second
component (the variance) is due to the finite nature of the training
set and the fact that it is only one realization of the random
process of drawing samples from the true (but unknown) probability
density of having an object at a given point in the hyperspace of
attributes.
.
Obviously, if we try to solve this toy classification
problem with a classifier inducing linear boundaries we will
inevitably have a large bias component to the total error. The second
component (the variance) is due to the finite nature of the training
set and the fact that it is only one realization of the random
process of drawing samples from the true (but unknown) probability
density of having an object at a given point in the hyperspace of
attributes.
If the model used to separate the classes in the classification problem is parametric, then we can always reduce the bias term by adding more and more degrees of freedom. In the Gaussian mixtures case, where we model the probability densities with multivariate Gaussians, this would be equivalent to describing each class by the sum of several components (i.e. several multivariate Gaussians). It has to be kept in mind, however, that there is an optimal number of components beyond which the decrease in the bias term is more than offset by an increase of the variance, due to the data being overfitted by the complexity of the model. The natural consequence is the loss of generalization capacities of the classifier, where the generalization ability is understood as the capacity of the model to correctly predict the class of unseen examples based on the inferences drawn from the training set.-0.5mm
We computed models allowing for more complex decision boundaries where the bias-variance trade-off is sought, using standard procedures. Here we present brief outlines of the methods and a summary of the results, while a more detailed analysis will be published in a forthcoming paper (Sarro et al., in preparation). We made use of what is widely known as Feature Selection Methods. These methods can be of several types and are used to counteract the pernicious effect of irrelevant and/or correlated attributes for the performance of classifiers. The robustness of a classifier to the degradation produced by irrelevance and correlation depends on the theoretical grounds on which the learning algorithms are based. Thus, detailed studies have to be conducted to find the optimal subset of attributes for a given problem. The interested reader can find a good introduction to the field and references to the methods used in this paper in Guyon & Elisseeff (2003).
We adopted two strategies: training a unique classifier for the 29 classes with sufficient stars for a reliable estimate of the errors, or adopting a multistage approach where several large groups with vast numbers of examples and well identified subgroups (eclipsing binaries, Cepheids, RR-Lyrae and Long Period Variables) are classified first by specialized modules in a sequential approach and then, objects not belonging to any of these classes are passed to a final classifier of reduced complexity.
Feature selection methods fall into one of two categories: filter and wrapper methods. Filter methods rank the attributes (or subsets of them) based on some criterion independent of the model to be implemented for classification (e.g., the mutual information between the attribute and the class or between attributes, or the statistical correlation between them). Wrapper methods, on the other hand, explore the space of possible attribute subsets and score each combination according to some assessment of the performance of the classifier trained only on the attributes included in the subset. The exhaustive search for an optimal subset in the space of all possible combinations rapidly becomes unfeasible as the total number of attributes in the original set increases. Therefore, some sort of heuristic search, based on expected properties of the problem, has to be used in order to accomplish the selection stage in reasonable times.
We applied several filtering techniques based on Information Theory (Information Gain, Gain Ratio and symmetrical uncertainty) and statistical correlations to the set of attributes described in Sect. 2.1, extended with peak-to-peak amplitudes, harmonic amplitude ratios (within and across frequencies) and frequency ratios. These techniques were combined with appropriate search heuristics in the space of feature subsets. Furthermore, we also investigated feature relevance by means of wrapper techniques applied to Bayesian networks and decision trees, but not to the Bayesian combination of neural networks or to Support Vector Machines due to the excessive computational cost of combining the search for the optimal feature subset and the search for the classifier's optimal set of parameters. The Bayesian model averaging of neural networks in the implementation used here, incorporates automatic relevance determination by means of hyperparameters. For this reason, we have not performed any feature selection.
In general, there is no well-founded way to combine the results of these methods. Each approach conveys a different perspective of the data and it is only by careful analysis of the rankings and selected subsets that particular choices can be made. As a general rule, we have combined the rankings of the different methodologies when dealing with single stage classifiers, whereas for sequential classifiers, each stage had its own feature selection process. When feasible in terms of computation time (e.g. for Bayesian networks), the attribute subsets were scored in the wrapper approach. Otherwise, several filter methods were applied and the best results used.
Bayesian networks are probabilistic graphical models where the uncertainty inherent to an expert system is encoded into two basic structures: a graphical structure S representing the conditional independence relations amongst the different attributes, and a joint probability distribution for its nodes (Pearl 1988). The nodes of the graph represent the variables (attributes) used to describe the examples (instances). There is one special node corresponding to the class attribute. Here, we have constructed models of the family known as k-dependent Bayesian classifier (Sahami 1996) with k, the maximum number of parents allowed for a node in the graph, set to a maximum of 3 (it was checked that higher degrees of dependency did not produce improvements in the classifier performance).
The induction of Bayesian classifiers implies finding an optimal structure and probability distribution according to it. We have opted for a score and search approach, where the score is based on the marginal likelihood of the structure as implemented in the K2 algorithm by Cooper & Herskovits (1992). Although there are implementations of the k-dependent Bayesian classifiers for continuous variables, also known as Gaussian networks, we have obtained significantly better results with discretized variables. The discretization process is based on the Minimum Description Length principle as proposed in Fayyad & Irani (1993). It is carried out as part of the cross validation experiments to avoid overfitting the training set.
Artificial neural networks are probably the most popular methodology for classification and clustering. They are taken from the world of Artificial Intelligence. In its most frequent implementation, it is defined as a feedforward network made up of several layers of interconnected units or neurons. With appropriate choices for the computations carried out by the neurons, we have the well-known multilayer perceptron. Bishop (1995) has written an excellent introductory text to the world of neural networks, statistical learning and pattern recognition.
We do not deviate here from this widely accepted architecture but use a training approach other than the popular error backpropagation algorithm. Instead of the maximum likelihood estimate provided by it, we use Bayesian Model Averaging (BMA). BMA combines the predictions of several models (networks) weighting each by the a posterior probability of its parameters (the weights of network synapses) given the training data. For a more in-depth description of the methods, see Neal (1996) or Sarro et al. (2006). In the following, we use the acronym BAANN to refer to the averaging of artificial neural networks.
Support vector machines (SVM) are based on the minimization of the structural risk (Gunn et al. 1997). The structural risk can be proven to be upper-bounded by the sum of the empirical risk and the optimism, a quantity dependent on the Vapnik-Chervonenkis dimension of the chosen set of classifier functions. For linear discriminant functions, minimizing the optimism amounts to finding the hyperplane separating the training data with the largest margin (distance to the closest examples called support vectors). For nonlinearly separable problems, the input space can be mapped into a higher dimensional space using kernels, in the hope that the examples in the new hyperspace are linearly separable. A good presentation of the foundations of the method can be found in Vapnik (1995). Common choices for the kernels are nth degree polynomial and Gaussian radial basis functions. The method can easily incorporate noisy boundaries by introducing regularization terms. We used radial basis functions kernels. The parameters of the method (the complexity or regularization parameter and the kernel scale) are optimized by grid search and 10-fold cross validation.
One of the central problems of statistical learning from samples is that of estimating the expected error of the developed classifiers. The final goal of automatic classification, as mentioned above, is to facilitate the analysis of large amounts of data which would otherwise be left unexplored because the amount of time needed for humans to undertake such an analysis is incommensurably large. This necessity cannot mask the fact that classifiers have errors and these need to be quantified if scientific hypotheses are to be drawn from their products.
When developing a classifier, the goal is to maximize the number of correct classifications of new cases. Given the classification method, the performance of a supervised classification depends, amongst other factors that measure the faithfulness of the representation of the real probability densities by the training set, on the quality of the descriptive parameters used for classifying. We seek a set of classification attributes which describes most light curves well and provides a good separation of the classes in attribute space.
Several methodologies exist to evaluate classifiers. A common way of testing a classifier's performance is feeding it with objects with a known member class and derive how many of them are correctly classified. This method is called "cross validation'' in the case that the complete training set is split up into two disjointed sets: a training set and a set that will be classified, called the validation set. It is also possible to use the complete set for both training and classifying. This is known as "resampling''. This is no longer a cross validation experiment, since the objects used for training and for classifying are the same. For a real cross validation experiment, the objects to classify must be different from the objects in the training set, in order to have statistical independence. The resampling method thus has a bias towards optimistic assessment of the misclassification rate, compared to a cross validation method. Another possibility (called holdout procedure) consists of training the classifier with a subset of the set of examples and evaluating its error rates with the remainder. Depending on the percentage split it can be biased as well, but this time in the opposite (pessimistic) direction. Finally, the most common approach to validating classification models is called k-fold cross validation. This consists of dividing the set of examples into k folds, repeating k times the process of training the model with k-1 folds and evaluating it with the kth fold not used for training. Several improvements to this method can be implemented to reduce the variance of its estimates, e.g. by assuring a proportional representation of classes in the folds (stratified cross validation). Recent proposals include bolstered resubstitution and several variants. Good and recent overviews of the problem with references to relevant bibliography can be found in Demsar (2006) and Bouckaert (2004).
For the simplest classifier, we also considered the simplest performance test by adopting the resampling approach. Using this method, we already get an idea of the overlap and separability of the classes in parameter space.
The total number of correct classifications expressed as a percentage, can be rather misleading. For example, if our training set contains many example light curves for the well-separated classes, we will have a high rate of correct classifications, even if the classifier performs very badly for some classes with only a small number of training objects. Therefore, it is better to judge the classifier's performance by looking at the "confusion matrix''. This is a square matrix with rows and columns having a class label. It lists the numbers of objects assigned to every class in the training set after cross validation. The diagonal elements represent the correct classifications, and their sum (trace of the matrix) divided by the total number of objects in the training set, equals the total correct classification rate. The off-diagonal elements show the number of misclassified (confused) objects and the classes they were assigned to. In this way, we get a clear view on the classifier's performance for every class separately. We can see which classes show high misclassification rates and are thus not very well separated using our set of classification attributes.
Table 3 shows the confusion matrix for a subset of 25 variability
classes. These are the classes with more than 13 member stars each. We have
chosen not to take the classes with fewer member stars into account here,
because the number of classification attributes is limited by the number of
member stars in the class. This is merely a numerical limitation of the
multivariate Gaussian mixture classifier: if the number of defining class
members is equal to or lower than the number of classification attributes, the
determinant of the variance-covariance matrix will become equal to zero. This
makes it impossible to calculate the statistical distance with respect to the
class using Eq. (10). We used 12 light curve parameters to perform the
classification (the smallest class in this set contains 13 member stars): the
three frequencies fi, the four amplitudes A1j, the phases PH1j, the
linear trend b and the variance ratio. The average correct classification rate
is about ![]() for this experiment. As can be seen from the matrix in
Table 3, the monoperiodic pulsators such as MIRA, CLCEP, DMCEP,
RRAB, RRC and RRD are well separated. Some of the multiperiodic pulsators are
also well identified (SPB, GDOR). A lot of misclassifications (fewer than
for this experiment. As can be seen from the matrix in
Table 3, the monoperiodic pulsators such as MIRA, CLCEP, DMCEP,
RRAB, RRC and RRD are well separated. Some of the multiperiodic pulsators are
also well identified (SPB, GDOR). A lot of misclassifications (fewer than
![]() correct classifications) occur for the following multiperiodic pulsators:
BE, PVSG, DSCUT. Also, some of the irregular and semi-regular variables show
poor results (SR, WR, HAEBE, TTAU) as was emphasized in Sect. 2.2.
correct classifications) occur for the following multiperiodic pulsators:
BE, PVSG, DSCUT. Also, some of the irregular and semi-regular variables show
poor results (SR, WR, HAEBE, TTAU) as was emphasized in Sect. 2.2.
Depending on the intended goal, it can be better to take fewer classes into account. For example, when the interest is focused on a few classes only, using fewer classes will decrease the risk of misclassifying members of those classes. To illustrate this, Table 4 shows the confusion matrix for only 14 classes using the complete set of 28 light curve parameters defined in Sect. 2.1 to perform the classification. We did not include the classes with very irregular light curves or the less well-defined classes such as BE, CP, WR and PVSG.
The average correct classification rate amounts to ![]() for this
experiment. It is clear that the monoperiodically pulsating stars are again very
well separated (MIRA, CLCEP, DMCEP, RRAB, RRC and RRD). Most of the classes with
multiperiodic variables also show high correct classification rates now (SPB,
GDOR). Confusion is still present for the DSCUT and the BCEP classes. This is
normal, as these stars have non-radial oscillations with similar amplitudes and
with overlap in frequencies. For those classes in particular, additional (or
different) attributes are necessary to distinguish them, e.g. the use of a
color index as we will discuss extensively in our future application of the
methods to the OGLE database. Parameter overlap (similarity) with other classes
is the main reason for misclassifications if only light curves in a single
photometric band are available. Note the high correct classification rate for
the three classes of eclipsing binaries (EA, EB and EW). Some of their light
curves (mainly from the EA class) are highly non-sinusoidal, but they are
nevertheless well described with our set of attributes.
for this
experiment. It is clear that the monoperiodically pulsating stars are again very
well separated (MIRA, CLCEP, DMCEP, RRAB, RRC and RRD). Most of the classes with
multiperiodic variables also show high correct classification rates now (SPB,
GDOR). Confusion is still present for the DSCUT and the BCEP classes. This is
normal, as these stars have non-radial oscillations with similar amplitudes and
with overlap in frequencies. For those classes in particular, additional (or
different) attributes are necessary to distinguish them, e.g. the use of a
color index as we will discuss extensively in our future application of the
methods to the OGLE database. Parameter overlap (similarity) with other classes
is the main reason for misclassifications if only light curves in a single
photometric band are available. Note the high correct classification rate for
the three classes of eclipsing binaries (EA, EB and EW). Some of their light
curves (mainly from the EA class) are highly non-sinusoidal, but they are
nevertheless well described with our set of attributes.
The higher correct classification rates for this classification experiment with 14 classes is caused by the removal of the most "confusing'' classes compared to the experiment with 25 classes, and the increased number of discriminating attributes (this was tested separately). Note that the use of fewer classes for classifying also implies more contamination of objects which actually belong to none of the classes in the training set. This can effectively be solved by imposing limits on the Mahalanobis distance to the class centers. Objects with a Mahalanobis distance larger than a certain user-defined value, will then not be assigned to any class.
Table 3:
The Confusion Matrix for the Gaussian Mixture method, using 25variability classes and 12 classification attributes. The last but one line
lists the total number of light curves (TOT) to define every class. The last
line lists the correct classification rate (CC) for every class separately. The
average correct classification rate is about ![]() .
.
Table 4:
The confusion matrix for the Gaussian mixture method using 14variability classes and 28 classification attributes. The last but one line
lists the total number of light curves (TOT) to define every class. The last
line lists the correct classification rate (CC) for every class separately. The
average correct classification rate is about ![]() .
.
Selecting a methodology amongst several possible choices is in itself a statistical problem. Here we only summarize the results of a complete study comparing the approaches listed in Sect. 3.2, the details of which will be published in a specialized journal in the area of Pattern Recognition.
As explained in Sect. 3.2, one reason models can fail is that they are not flexible enough to describe the decision boundaries required by the data (the bias error). Another reason is because the training set, due to its finite number of samples, is never a perfect representation of the real probability densities (otherwise one would work directly with them and not with examples). Since learning algorithms are inevitably bound to use the training set to construct the model, any deficiency or lack of faithfulness in their representation of the probability densities will translate into errors. The bias-variance trade-off explained above is somehow a way to prevent the learning algorithm from adjusting itself too tightly to the training data (a problem known as overfitting) because its ability to generalize depends critically on it. Finally, irrespective of all of the above, we cannot avoid dealing with confusion regions, i.e., regions of parameter space where different classes coexist.
For the machine learning technique, we selected the combination of 10 sorted runs of 10-fold cross validation experiments together with the standard t-test (Demsar 2006). This combination assures small bias, a reduced variance (due to the repetition of the cross validation experiments) and replicability, an issue of special importance since these analyses will be iterated as the training set will be completed with new instances for the poorly represented classes and new attributes from projects such as CoRoT, Kepler and Gaia.
In the following, we have split the results for single stage and sequential classifiers. It should be born in mind that the misclassification rates used in the following sections include entries in the confusion matrices which relate eclipsing binary subtypes. These are amongst the largest contributions to the overall misclassification rate and are due to a poor definition of the subtypes as argued in Sarro et al. (2006) and as is widely known. In future applications of the classifiers (i.e. for CoRoT data) the specialized classifier presented in Sarro et al. (2006) and its classification scheme will be used. Therefore, the misclassification rates quoted below are too pessimistic by an estimated 2%.
Table 5 shows the confusion matrix for the Bayesian model averaging of artificial neural networks. This methodology produces an average correct classification rate of 70%. For comparison, the second best single stage classifier measured by this figure is the 3-dependent Bayesian classifier with an overall rate of success of 66%.
According to the t-test run applied to the ten sorted runs of 10-fold cross validation, the probability of finding this difference under the null hypothesis is below 0.05%. However, this difference (equivalent to 73 more instances classified correctly by the ensemble of neural networks) has to be put into the context of a more demanding computational requirement of the method (several hours training time in a single 2.66 GHz processor) compared to the almost instantaneous search for the Bayesian network. For comparison, the classical C4.5 algorithm (Quinlan 1993) attains only slightly worse performances (averages of 65.2) at the expense of a more costly determination of the optimal parameters and greater variance with respect to the training sample.
Support Vector Machines obtain much poorer results (of the order of 50% correct identifications). We searched the parameter space as closely as possible given the computational needs of a cross validation experiment with 30 classes. The best combination found is not able to compete with other approaches. It is always possible that we missed an island of particularly good performance in the grid search but the most plausible explanation for the seemingly poor results is that SVMs are not optimized for multiclass problems. These are typically dealt with by reducing them to many two-class problems, but most implementations assume a common value of the parameters (complexity and radial basis exponent in our case) for all boundaries.
Table 5: The confusion matrix for the Bayesian model averaging of artificial neural networks. The last but one line lists the total number of light curves (TOT) to define every class. The last line lists the correct classification rate (CC) for every class separately as measured by 10 fold cross validation.
One of the most relevant characteristics of the stellar variability classification problem is the rather high number of classes dealt with. Trying to construct a single stage classifier for such a large number of different classes implies a trade off between the optimal values of the model parameters in different regions of attribute space. We constructed an optimal multistage classifier in the perspective of dividing the classification problem into several stages, during each of which a particular subset of the classes is separated from the rest.
Table 6: The confusion matrix for the Bayesian model averaging of artificial neural networks and the two class problem. The last but one line lists the total number of light curves (TOT) to define every class. The last line lists the correct classification rate (CC) for every class separately as measured by 10-fold cross validation. Separation between: A: eclipsing binaries (ECL) and all other types; B: Cepheids (CEP) and all other types; C: long period variables (LPV) and all other types except ECL and CEP; D: RR Lyrae stars (RR) from all other types except ECL, CEP and LPV.
Table 7: The confusion matrix for the Bayesian model averaging of artificial neural networks. The last but one line lists the total number of light curves (TOT) to define every class. The last line lists the correct classification rate (CC) for every class separately as measured by 10-fold cross validation. Separation between: A: Cepheids; B: long period variables; C: RR Lyrae stars.
Table 8: The confusion matrix for the Bayesian model averaging of artificial neural networks for the variables not assigned to any group. The last but one line lists the total number of light curves (TOT) to define every class. The last line lists the correct classification rate (CC) for every class separately as measured by 10-fold cross validation.
Table 9: The complete confusion matrix for the Bayesian model averaging of artificial neural networks. The last but one line lists the total number of light curves (TOT) to define every class. The last line lists the correct classification rate (CC) for every class separately as measured by 10-fold cross validation.
We have selected four subgroups, one for each of the stages of the classifier. The choice was based on the internal similarities between instances in a group (intra cluster distances) and the separations between different groups. The four groups are eclipsing binaries (EA, EB, EW), Cepheids (CLCEP, PTCEP, RVTAU, DMCEP), long period variables (MIRA, SR) and RR-Lyrae stars (RRAB, RRC, RRD). These groups are characterized by having significant entries in the confusion matrices for elements in each group and small contributions to these matrices across groups. We have trained sequential classifiers in the sense that the subsequent classifiers are not trained with the classes identified first. For example, if the first stage classifier is trained to separate eclipsing variables from the others, the second classifier will not have eclipsing variables in its training set. This way, given an instance, we can construct the complete class probability table as a product of conditional probabilities.
The experiments consists of performing 10 runs of 10-fold cross validation for each stage with SVMs, Bayesian k-dependent networks and Bayesian neural network averages. The order in which the groups are filtered is altered in order to test the 24 possible permutations. Each stage is preceded by a feature selection process that selects the optimal subset of features for each particular problem (as opposed to the single feature selection step of single stage classifiers). The results of the experiments consist of several confusion matrices of dimension 2 for each 2 class problem, and several other confusion matrices for the classification of instances within these main groups. These latter matrices do not depend on the order of the assignment of groups to stages. With only one exception, all statistical tests were inconclusive in the sense of not providing enough evidence for the rejection of the null hypothesis (having a threshold of 99.95%) that the classifiers have equal performance. The only exception is the eclipsing binaries classifier, where BAANN clearly outperforms all other methods. In all other cases the similarities in performance are remarkable.
Table 6 shows the BAANN confusion matrices for the different classification stages, while Tables 7 and 8 show the corresponding matrices for the internal classification problem of each group and the remaining classes not assigned to any group. Finally, Table 9 shows the combined confusion matrix constructed by multiplying conditional probabilities. For example, the probability of an instance being a classical Cepheid (CLCEP) is the probability of not being an eclipsing binary (first stage) times the probability of belonging to the Cepheids group (second stage) times the probability of being a classical Cepheid (specialized classifier). The average correct classification rate is about 66% for this classifier.
We presented a uniform description of the most important stellar variability classes currently known. Our description is based on light curve parameters from well-known member stars for which high quality data are available. The parameters are derived using Fourier analysis and harmonic fitting methods, and can be calculated on short timescales. The class descriptions obtained form the basis for a supervised classification method which produces class probabilities given a set of time series attributes. It is shown that our class descriptions are accurate enough to separate the monoperiodic variables, some of the multiperiodic variables, and eclipsing binaries. An obvious improvement to these capabilities will come from the addition of color information to the class definitions. This will be discussed in a subsequent paper, where our methodology will be applied to the OGLE database.
We obtained overall good classification results. The Gaussian mixture method is relatively simple and robust, and allows for an easy astrophysical interpretation. The machine learning algorithms, on the other hand, achieve a lower rate of misclassifications at the expense of longer training times, reduced interpretability and a higher level of statistical knowledge of the user. The following extensions/improvements are planned for the future:
It is important to realize that the methodology presented here should be
evaluated in a statistical sense, i.e., one can never be sure that each
individual star is correctly and unambiguously classified. Our method was
specifically designed for databases that are so large that individual inspection
of all the stars is impossible. Of course, such inspection can and should be
done after a first classification with our methods has been achieved, for the
specific class of interest to the user. We also note that our basic methods
described here assume the simplest possible input: single-band photometric time
series. Any additional independent information (color indices or time series,
radial velocity time series, spectral type or ![]() ,
etc.) will imply an
improved performance as will be shown in our application to the OGLE database
for which such additional attributes were retrieved through the Virtual
Observatory. We will judge the performance of the different classifiers
presented here in a future paper by comparing our classifications for the OGLE
stars with published results obtained with extractor-type methods requiring
human interaction.
,
etc.) will imply an
improved performance as will be shown in our application to the OGLE database
for which such additional attributes were retrieved through the Virtual
Observatory. We will judge the performance of the different classifiers
presented here in a future paper by comparing our classifications for the OGLE
stars with published results obtained with extractor-type methods requiring
human interaction.
Acknowledgements
We are very grateful to the following colleagues for providing us with high quality light curves: Don Kurtz, Simon Jeffery, Gilles Fontaine, Antonio Kanaan, Kepler Oliveira, Vik Dhillon, Suzanna Randall, Laure Lefèvre, Joris De Ridder, Mario van den Ancker, Bram Acke, Chris Sterken and Stéphane Charpinet. This work is made possible thanks to support from the Belgian PRODEX programme under grant PEA C90199 (COROT Mission Data Exploitation II), from the research Council of Leuven University under grant GOA/2003/04 and from the Spanish Ministerio de Educación y Ciencia through grant AYA2004-08067-C03-03 and AYA2005-04286. LMS wishes to thank M. García for the very useful discussions on the feature selection problem and JD wishes to thank A. Debosscher for the inspiring discussions.